
Key Insights
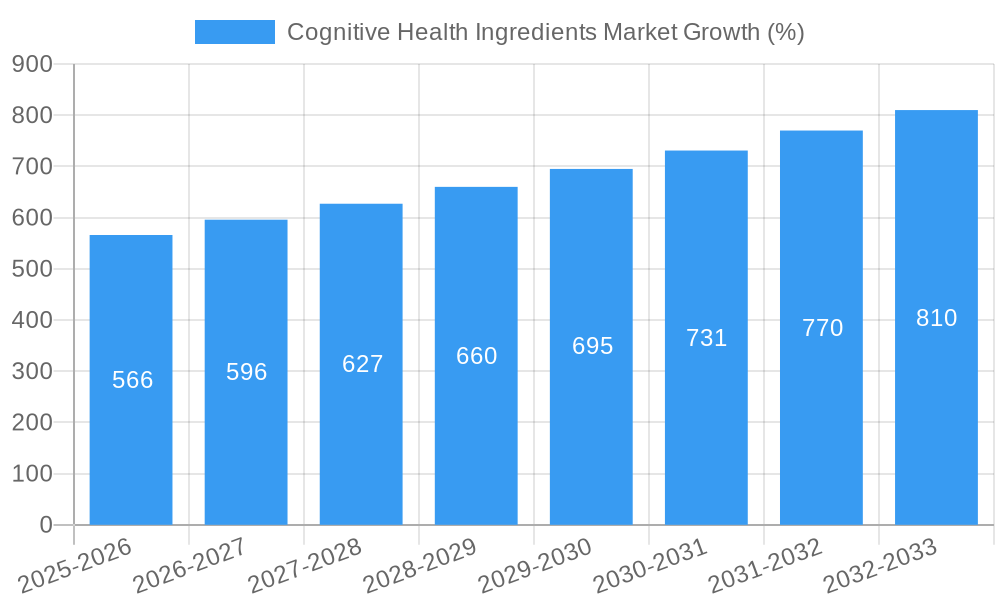
The Cognitive Health Ingredients market, currently valued at $9 billion (2025), is projected to experience robust growth, exhibiting a Compound Annual Growth Rate (CAGR) of 5.87% from 2025 to 2033. This expansion is driven by several key factors. The increasing geriatric population globally is a significant driver, as cognitive decline is a prevalent concern among older adults. Furthermore, rising awareness of the link between diet and brain health is fueling demand for cognitive-enhancing supplements and functional foods. Technological advancements in ingredient extraction and formulation are leading to more effective and palatable products, further boosting market growth. Specific ingredient categories such as omega-3 fatty acids, probiotics, and botanical extracts like ginseng and bacopa are experiencing particularly strong demand due to their established cognitive benefits. While regulatory hurdles and varying consumer perceptions across regions present challenges, the overall market outlook remains positive. The market segmentation reveals a strong preference for dietary supplements and functional foods as delivery methods for these ingredients. Leading companies, including DSM, Kerry, and Cargill, are strategically investing in research and development to capitalize on this growing market, introducing innovative products and expanding their market share.
Geographic distribution shows a significant concentration in North America and Europe, reflecting higher levels of health awareness and disposable income. However, Asia Pacific is poised for substantial growth in the coming years, driven by rapidly increasing middle-class populations and increased awareness of cognitive health. The market is characterized by a competitive landscape with both established players and emerging companies vying for dominance, leading to innovation and diversification of product offerings. Future growth will likely be shaped by further research validating the efficacy of different ingredients, personalized nutrition approaches, and a continued emphasis on product safety and quality. This will drive demand for transparency and traceability within the supply chain.

Cognitive Health Ingredients Market: A Comprehensive Report (2019-2033)
This detailed report provides a comprehensive analysis of the Cognitive Health Ingredients market, offering invaluable insights for stakeholders across the industry value chain. The study period covers 2019-2033, with 2025 serving as the base and estimated year. The forecast period spans 2025-2033, and the historical period encompasses 2019-2024. The market is segmented by product type (Vitamins and Minerals, Omega PUFA, Probiotics & Prebiotics, Amino Acids, Proteins & Peptides, Fibers, Botanical Extracts) and application (Functional Food and Beverages, Dietary Supplements). Key players analyzed include Koninklijke DSM, Food Chem International, Kerry Inc, DuPont de Nemours Inc, Archer Daniels Midland Company, BASF SE, Corbion N V, Cargill Inc, Ingredion Incorporated, and Rousselot BV. The report projects a market size of xx Million by 2033.
Cognitive Health Ingredients Market Market Concentration & Innovation
The Cognitive Health Ingredients market exhibits a moderately concentrated landscape, with a few major players holding significant market share. Koninklijke DSM and Cargill Inc., for example, collectively command approximately xx% of the market, based on 2024 revenue estimates. However, the market also witnesses considerable participation from smaller, specialized companies, particularly within niche segments like botanical extracts and specific probiotics. This fosters a dynamic competitive environment. Innovation is driven by the growing demand for natural and scientifically-backed cognitive enhancement solutions, pushing companies to invest heavily in R&D. This translates to the development of novel ingredients with enhanced efficacy and bioavailability, often backed by robust clinical trials. Regulatory frameworks, particularly those concerning food safety and labeling, play a crucial role in shaping product development and market access. Stricter regulations, while posing challenges, also drive innovation towards cleaner, more sustainable ingredients. The existence of product substitutes, such as traditional herbal remedies, introduces competitive pressure, compelling manufacturers to differentiate their offerings through superior quality, branding, and clinical evidence. M&A activity is noteworthy, with larger players frequently acquiring smaller companies to expand their product portfolios, gain access to new technologies, or strengthen their market presence. Deal values have fluctuated between xx Million and xx Million in recent years, depending on the size and strategic significance of the acquired company. End-user trends, characterized by increased health consciousness and a preference for natural ingredients, profoundly influence market dynamics and product innovation strategies.
Cognitive Health Ingredients Market Industry Trends & Insights
The Cognitive Health Ingredients market is experiencing robust growth, driven by several converging factors. The global aging population, coupled with rising awareness of cognitive decline and dementia, is significantly fueling demand for ingredients that support brain health. The increasing prevalence of neurodegenerative diseases further contributes to this demand. Technological advancements in ingredient extraction, formulation, and delivery systems have enabled the development of more effective and consumer-friendly products. This includes the use of nanotechnology for enhanced absorption and targeted delivery. Consumer preferences are shifting towards natural, organic, and sustainably sourced ingredients, leading manufacturers to reformulate products to meet these expectations. The market demonstrates a strong preference for functional foods and beverages, with consumers seeking convenient ways to integrate cognitive health support into their daily routines. The market is witnessing increased competition, with both established players and new entrants vying for market share. This competition is driving innovation and leading to more affordable and accessible products. The CAGR for the market is projected to be xx% during the forecast period (2025-2033), while market penetration for specific product types like Omega-3 PUFA is steadily increasing, reaching an estimated xx% in 2025. This growth is fueled by increasing scientific evidence highlighting the beneficial impact of these ingredients on cognitive function.
Dominant Markets & Segments in Cognitive Health Ingredients Market
North America currently holds a dominant position in the Cognitive Health Ingredients market, driven by high per capita consumption of dietary supplements and a strong focus on preventive healthcare. Within product types, Vitamins and Minerals hold the largest market share, owing to their established efficacy and widespread acceptance. Dietary Supplements represent the leading application segment, reflecting consumer preference for targeted interventions to enhance cognitive health.
Key Drivers in North America:
- High disposable income and health-conscious population.
- Well-established regulatory framework for dietary supplements.
- Extensive research and development activities.
Dominance Analysis: The dominance of North America stems from a confluence of factors including advanced healthcare infrastructure, high consumer awareness, and the presence of major players in the industry. Europe holds a significant market share as well, reflecting rising health concerns and similar trends in consumer preferences. The Asia-Pacific region is expected to witness the fastest growth in the coming years, due to rising disposable incomes and a rapidly expanding elderly population.
Cognitive Health Ingredients Market Product Developments
Recent product innovations highlight a move towards personalized nutrition, with the development of customized formulations tailored to specific age groups and cognitive needs. This is accompanied by a surge in products combining multiple cognitive-enhancing ingredients for synergistic effects, enhancing bioavailability and efficacy. Technological advancements are focused on improving ingredient delivery systems, ensuring optimal absorption and minimizing potential side effects. The market is also witnessing the introduction of novel ingredient sources, such as algae-based Omega-3s and innovative probiotic strains, demonstrating an emphasis on sustainability and enhanced efficacy.
Report Scope & Segmentation Analysis
This report provides a comprehensive analysis of the Cognitive Health Ingredients market across various segments.
Product Type: Vitamins and Minerals, Omega PUFA, Probiotics & Prebiotics, Amino Acids, Proteins & Peptides, Fibers, Botanical Extracts – each segment is analyzed for market size, growth rate, and competitive landscape.
Application: Functional Food and Beverages, Dietary Supplements - each segment is analyzed for market size, growth rate, and competitive landscape. Growth projections vary widely by segment. Vitamins & Minerals demonstrate steady growth, while the probiotics segment experiences faster expansion. The competitive dynamics also vary, with some segments characterized by intense competition and others exhibiting a more fragmented landscape.
Key Drivers of Cognitive Health Ingredients Market Growth
The market's growth is driven by multiple factors. The increasing prevalence of age-related cognitive decline and neurodegenerative diseases creates significant demand for effective preventive and therapeutic solutions. Technological advancements in ingredient delivery, formulation, and extraction techniques are improving product efficacy and appeal. Rising consumer awareness of the link between nutrition and brain health fuels demand for cognitive-enhancing products. Lastly, proactive government initiatives promoting healthy aging and increased healthcare spending further stimulate market expansion.
Challenges in the Cognitive Health Ingredients Market Sector
The market faces challenges like stringent regulatory frameworks and varying standards across different geographies, hindering product launches and market penetration. Supply chain disruptions, particularly for niche ingredients sourced from specific regions, can impact product availability and pricing. Intense competition and the need to demonstrate clinical efficacy through rigorous research add pressure on profit margins.
Emerging Opportunities in Cognitive Health Ingredients Market
Growing interest in personalized nutrition presents significant opportunities, enabling the development of customized cognitive health solutions. The increasing focus on natural and sustainable ingredients offers scope for innovation in sourcing and processing techniques. The exploration of new ingredient sources and advancements in delivery systems can unlock new avenues for enhanced efficacy and product differentiation. Finally, the expanding market in developing economies provides significant growth potential.
Leading Players in the Cognitive Health Ingredients Market Market
- Koninklijke DSM
- Food Chem International
- Kerry Inc
- DuPont de Nemours Inc
- Archer Daniels Midland Company
- BASF SE
- Corbion N V
- Cargill Inc
- Ingredion Incorporated
- Rousselot BV
Key Developments in Cognitive Health Ingredients Market Industry
- 2022 Q4: Koninklijke DSM launched a new line of clinically-proven cognitive enhancement ingredients.
- 2023 Q1: Cargill Inc. announced a significant expansion of its production capacity for Omega-3 PUFA.
- 2024 Q2: Kerry Inc. acquired a smaller company specializing in botanical extracts for cognitive health.
Strategic Outlook for Cognitive Health Ingredients Market Market
The Cognitive Health Ingredients market is poised for substantial growth, driven by escalating consumer demand, technological innovations, and the increasing prevalence of age-related cognitive decline. Opportunities abound in personalized nutrition, sustainable sourcing, and the expansion into emerging markets. The strategic focus should be on product innovation, strong clinical evidence, and effective communication of the benefits to consumers. Companies that invest in research and development, adopt sustainable practices, and effectively target their marketing efforts are likely to gain a competitive advantage and capitalize on the market's significant growth potential.
Cognitive Health Ingredients Market Segmentation
-
1. Product Type
- 1.1. Vitamins and Minerals
- 1.2. Omega PUFA
- 1.3. Probiotics & Prebiotics
- 1.4. Amino Acids, Proteins & Peptides
- 1.5. Fibers
- 1.6. Botanical Extracts
-
2. Application
- 2.1. Functional Food and Beverages
- 2.2. Dietary Supplements
Cognitive Health Ingredients Market Segmentation By Geography
-
1. North America
- 1.1. United States
- 1.2. Canada
- 1.3. Mexico
- 1.4. Rest of North America
-
2. Europe
- 2.1. Germany
- 2.2. United Kingdom
- 2.3. France
- 2.4. Russia
- 2.5. Spain
- 2.6. Italy
- 2.7. Rest of Europe
-
3. Asia Pacific
- 3.1. India
- 3.2. China
- 3.3. Japan
- 3.4. Australia
- 3.5. Rest of Asia Pacific
-
4. South America
- 4.1. Brazil
- 4.2. Argentina
- 4.3. Rest of South America
-
5. Middle East and Africa
- 5.1. South Africa
- 5.2. Saudi Arabia
- 5.3. Rest of Middle East and Africa

Cognitive Health Ingredients Market REPORT HIGHLIGHTS
| Aspects | Details |
|---|---|
| Study Period | 2019-2033 |
| Base Year | 2024 |
| Estimated Year | 2025 |
| Forecast Period | 2025-2033 |
| Historical Period | 2019-2024 |
| Growth Rate | CAGR of 5.87% from 2019-2033 |
| Segmentation |
|
Table of Contents
- 1. Introduction
- 1.1. Research Scope
- 1.2. Market Segmentation
- 1.3. Research Methodology
- 1.4. Definitions and Assumptions
- 2. Executive Summary
- 2.1. Introduction
- 3. Market Dynamics
- 3.1. Introduction
- 3.2. Market Drivers
- 3.2.1. Increasing Demand For Convenience & Processed Food
- 3.3. Market Restrains
- 3.3.1. Increased Consumer Awareness On Side-Effects Of Chemical Additives
- 3.4. Market Trends
- 3.4.1. Natural Health Ingredients Perceived to Be Highly Effective among Arthritis Patients
- 4. Market Factor Analysis
- 4.1. Porters Five Forces
- 4.2. Supply/Value Chain
- 4.3. PESTEL analysis
- 4.4. Market Entropy
- 4.5. Patent/Trademark Analysis
- 5. Global Cognitive Health Ingredients Market Analysis, Insights and Forecast, 2019-2031
- 5.1. Market Analysis, Insights and Forecast - by Product Type
- 5.1.1. Vitamins and Minerals
- 5.1.2. Omega PUFA
- 5.1.3. Probiotics & Prebiotics
- 5.1.4. Amino Acids, Proteins & Peptides
- 5.1.5. Fibers
- 5.1.6. Botanical Extracts
- 5.2. Market Analysis, Insights and Forecast - by Application
- 5.2.1. Functional Food and Beverages
- 5.2.2. Dietary Supplements
- 5.3. Market Analysis, Insights and Forecast - by Region
- 5.3.1. North America
- 5.3.2. Europe
- 5.3.3. Asia Pacific
- 5.3.4. South America
- 5.3.5. Middle East and Africa
- 5.1. Market Analysis, Insights and Forecast - by Product Type
- 6. North America Cognitive Health Ingredients Market Analysis, Insights and Forecast, 2019-2031
- 6.1. Market Analysis, Insights and Forecast - by Product Type
- 6.1.1. Vitamins and Minerals
- 6.1.2. Omega PUFA
- 6.1.3. Probiotics & Prebiotics
- 6.1.4. Amino Acids, Proteins & Peptides
- 6.1.5. Fibers
- 6.1.6. Botanical Extracts
- 6.2. Market Analysis, Insights and Forecast - by Application
- 6.2.1. Functional Food and Beverages
- 6.2.2. Dietary Supplements
- 6.1. Market Analysis, Insights and Forecast - by Product Type
- 7. Europe Cognitive Health Ingredients Market Analysis, Insights and Forecast, 2019-2031
- 7.1. Market Analysis, Insights and Forecast - by Product Type
- 7.1.1. Vitamins and Minerals
- 7.1.2. Omega PUFA
- 7.1.3. Probiotics & Prebiotics
- 7.1.4. Amino Acids, Proteins & Peptides
- 7.1.5. Fibers
- 7.1.6. Botanical Extracts
- 7.2. Market Analysis, Insights and Forecast - by Application
- 7.2.1. Functional Food and Beverages
- 7.2.2. Dietary Supplements
- 7.1. Market Analysis, Insights and Forecast - by Product Type
- 8. Asia Pacific Cognitive Health Ingredients Market Analysis, Insights and Forecast, 2019-2031
- 8.1. Market Analysis, Insights and Forecast - by Product Type
- 8.1.1. Vitamins and Minerals
- 8.1.2. Omega PUFA
- 8.1.3. Probiotics & Prebiotics
- 8.1.4. Amino Acids, Proteins & Peptides
- 8.1.5. Fibers
- 8.1.6. Botanical Extracts
- 8.2. Market Analysis, Insights and Forecast - by Application
- 8.2.1. Functional Food and Beverages
- 8.2.2. Dietary Supplements
- 8.1. Market Analysis, Insights and Forecast - by Product Type
- 9. South America Cognitive Health Ingredients Market Analysis, Insights and Forecast, 2019-2031
- 9.1. Market Analysis, Insights and Forecast - by Product Type
- 9.1.1. Vitamins and Minerals
- 9.1.2. Omega PUFA
- 9.1.3. Probiotics & Prebiotics
- 9.1.4. Amino Acids, Proteins & Peptides
- 9.1.5. Fibers
- 9.1.6. Botanical Extracts
- 9.2. Market Analysis, Insights and Forecast - by Application
- 9.2.1. Functional Food and Beverages
- 9.2.2. Dietary Supplements
- 9.1. Market Analysis, Insights and Forecast - by Product Type
- 10. Middle East and Africa Cognitive Health Ingredients Market Analysis, Insights and Forecast, 2019-2031
- 10.1. Market Analysis, Insights and Forecast - by Product Type
- 10.1.1. Vitamins and Minerals
- 10.1.2. Omega PUFA
- 10.1.3. Probiotics & Prebiotics
- 10.1.4. Amino Acids, Proteins & Peptides
- 10.1.5. Fibers
- 10.1.6. Botanical Extracts
- 10.2. Market Analysis, Insights and Forecast - by Application
- 10.2.1. Functional Food and Beverages
- 10.2.2. Dietary Supplements
- 10.1. Market Analysis, Insights and Forecast - by Product Type
- 11. North America Cognitive Health Ingredients Market Analysis, Insights and Forecast, 2019-2031
- 11.1. Market Analysis, Insights and Forecast - By Country/Sub-region
- 11.1.1 United States
- 11.1.2 Canada
- 11.1.3 Mexico
- 11.1.4 Rest of North America
- 12. Europe Cognitive Health Ingredients Market Analysis, Insights and Forecast, 2019-2031
- 12.1. Market Analysis, Insights and Forecast - By Country/Sub-region
- 12.1.1 Germany
- 12.1.2 United Kingdom
- 12.1.3 France
- 12.1.4 Russia
- 12.1.5 Spain
- 12.1.6 Italy
- 12.1.7 Rest of Europe
- 13. Asia Pacific Cognitive Health Ingredients Market Analysis, Insights and Forecast, 2019-2031
- 13.1. Market Analysis, Insights and Forecast - By Country/Sub-region
- 13.1.1 India
- 13.1.2 China
- 13.1.3 Japan
- 13.1.4 Australia
- 13.1.5 Rest of Asia Pacific
- 14. South America Cognitive Health Ingredients Market Analysis, Insights and Forecast, 2019-2031
- 14.1. Market Analysis, Insights and Forecast - By Country/Sub-region
- 14.1.1 Brazil
- 14.1.2 Argentina
- 14.1.3 Rest of South America
- 15. Middle East and Africa Cognitive Health Ingredients Market Analysis, Insights and Forecast, 2019-2031
- 15.1. Market Analysis, Insights and Forecast - By Country/Sub-region
- 15.1.1 South Africa
- 15.1.2 Saudi Arabia
- 15.1.3 Rest of Middle East and Africa
- 16. Competitive Analysis
- 16.1. Global Market Share Analysis 2024
- 16.2. Company Profiles
- 16.2.1 Koninklijke DSM
- 16.2.1.1. Overview
- 16.2.1.2. Products
- 16.2.1.3. SWOT Analysis
- 16.2.1.4. Recent Developments
- 16.2.1.5. Financials (Based on Availability)
- 16.2.2 Food Chem Internationa
- 16.2.2.1. Overview
- 16.2.2.2. Products
- 16.2.2.3. SWOT Analysis
- 16.2.2.4. Recent Developments
- 16.2.2.5. Financials (Based on Availability)
- 16.2.3 Kerry Inc
- 16.2.3.1. Overview
- 16.2.3.2. Products
- 16.2.3.3. SWOT Analysis
- 16.2.3.4. Recent Developments
- 16.2.3.5. Financials (Based on Availability)
- 16.2.4 DuPont de Nemours Inc
- 16.2.4.1. Overview
- 16.2.4.2. Products
- 16.2.4.3. SWOT Analysis
- 16.2.4.4. Recent Developments
- 16.2.4.5. Financials (Based on Availability)
- 16.2.5 Archer Daniels Midland Company
- 16.2.5.1. Overview
- 16.2.5.2. Products
- 16.2.5.3. SWOT Analysis
- 16.2.5.4. Recent Developments
- 16.2.5.5. Financials (Based on Availability)
- 16.2.6 BASF SE
- 16.2.6.1. Overview
- 16.2.6.2. Products
- 16.2.6.3. SWOT Analysis
- 16.2.6.4. Recent Developments
- 16.2.6.5. Financials (Based on Availability)
- 16.2.7 Corbion N V
- 16.2.7.1. Overview
- 16.2.7.2. Products
- 16.2.7.3. SWOT Analysis
- 16.2.7.4. Recent Developments
- 16.2.7.5. Financials (Based on Availability)
- 16.2.8 Cargill Inc
- 16.2.8.1. Overview
- 16.2.8.2. Products
- 16.2.8.3. SWOT Analysis
- 16.2.8.4. Recent Developments
- 16.2.8.5. Financials (Based on Availability)
- 16.2.9 Ingredion Incorporated
- 16.2.9.1. Overview
- 16.2.9.2. Products
- 16.2.9.3. SWOT Analysis
- 16.2.9.4. Recent Developments
- 16.2.9.5. Financials (Based on Availability)
- 16.2.10 Rousselot BV
- 16.2.10.1. Overview
- 16.2.10.2. Products
- 16.2.10.3. SWOT Analysis
- 16.2.10.4. Recent Developments
- 16.2.10.5. Financials (Based on Availability)
- 16.2.1 Koninklijke DSM
List of Figures
- Figure 1: Global Cognitive Health Ingredients Market Revenue Breakdown (Million, %) by Region 2024 & 2032
- Figure 2: Global Cognitive Health Ingredients Market Volume Breakdown (K Tons, %) by Region 2024 & 2032
- Figure 3: North America Cognitive Health Ingredients Market Revenue (Million), by Country 2024 & 2032
- Figure 4: North America Cognitive Health Ingredients Market Volume (K Tons), by Country 2024 & 2032
- Figure 5: North America Cognitive Health Ingredients Market Revenue Share (%), by Country 2024 & 2032
- Figure 6: North America Cognitive Health Ingredients Market Volume Share (%), by Country 2024 & 2032
- Figure 7: Europe Cognitive Health Ingredients Market Revenue (Million), by Country 2024 & 2032
- Figure 8: Europe Cognitive Health Ingredients Market Volume (K Tons), by Country 2024 & 2032
- Figure 9: Europe Cognitive Health Ingredients Market Revenue Share (%), by Country 2024 & 2032
- Figure 10: Europe Cognitive Health Ingredients Market Volume Share (%), by Country 2024 & 2032
- Figure 11: Asia Pacific Cognitive Health Ingredients Market Revenue (Million), by Country 2024 & 2032
- Figure 12: Asia Pacific Cognitive Health Ingredients Market Volume (K Tons), by Country 2024 & 2032
- Figure 13: Asia Pacific Cognitive Health Ingredients Market Revenue Share (%), by Country 2024 & 2032
- Figure 14: Asia Pacific Cognitive Health Ingredients Market Volume Share (%), by Country 2024 & 2032
- Figure 15: South America Cognitive Health Ingredients Market Revenue (Million), by Country 2024 & 2032
- Figure 16: South America Cognitive Health Ingredients Market Volume (K Tons), by Country 2024 & 2032
- Figure 17: South America Cognitive Health Ingredients Market Revenue Share (%), by Country 2024 & 2032
- Figure 18: South America Cognitive Health Ingredients Market Volume Share (%), by Country 2024 & 2032
- Figure 19: Middle East and Africa Cognitive Health Ingredients Market Revenue (Million), by Country 2024 & 2032
- Figure 20: Middle East and Africa Cognitive Health Ingredients Market Volume (K Tons), by Country 2024 & 2032
- Figure 21: Middle East and Africa Cognitive Health Ingredients Market Revenue Share (%), by Country 2024 & 2032
- Figure 22: Middle East and Africa Cognitive Health Ingredients Market Volume Share (%), by Country 2024 & 2032
- Figure 23: North America Cognitive Health Ingredients Market Revenue (Million), by Product Type 2024 & 2032
- Figure 24: North America Cognitive Health Ingredients Market Volume (K Tons), by Product Type 2024 & 2032
- Figure 25: North America Cognitive Health Ingredients Market Revenue Share (%), by Product Type 2024 & 2032
- Figure 26: North America Cognitive Health Ingredients Market Volume Share (%), by Product Type 2024 & 2032
- Figure 27: North America Cognitive Health Ingredients Market Revenue (Million), by Application 2024 & 2032
- Figure 28: North America Cognitive Health Ingredients Market Volume (K Tons), by Application 2024 & 2032
- Figure 29: North America Cognitive Health Ingredients Market Revenue Share (%), by Application 2024 & 2032
- Figure 30: North America Cognitive Health Ingredients Market Volume Share (%), by Application 2024 & 2032
- Figure 31: North America Cognitive Health Ingredients Market Revenue (Million), by Country 2024 & 2032
- Figure 32: North America Cognitive Health Ingredients Market Volume (K Tons), by Country 2024 & 2032
- Figure 33: North America Cognitive Health Ingredients Market Revenue Share (%), by Country 2024 & 2032
- Figure 34: North America Cognitive Health Ingredients Market Volume Share (%), by Country 2024 & 2032
- Figure 35: Europe Cognitive Health Ingredients Market Revenue (Million), by Product Type 2024 & 2032
- Figure 36: Europe Cognitive Health Ingredients Market Volume (K Tons), by Product Type 2024 & 2032
- Figure 37: Europe Cognitive Health Ingredients Market Revenue Share (%), by Product Type 2024 & 2032
- Figure 38: Europe Cognitive Health Ingredients Market Volume Share (%), by Product Type 2024 & 2032
- Figure 39: Europe Cognitive Health Ingredients Market Revenue (Million), by Application 2024 & 2032
- Figure 40: Europe Cognitive Health Ingredients Market Volume (K Tons), by Application 2024 & 2032
- Figure 41: Europe Cognitive Health Ingredients Market Revenue Share (%), by Application 2024 & 2032
- Figure 42: Europe Cognitive Health Ingredients Market Volume Share (%), by Application 2024 & 2032
- Figure 43: Europe Cognitive Health Ingredients Market Revenue (Million), by Country 2024 & 2032
- Figure 44: Europe Cognitive Health Ingredients Market Volume (K Tons), by Country 2024 & 2032
- Figure 45: Europe Cognitive Health Ingredients Market Revenue Share (%), by Country 2024 & 2032
- Figure 46: Europe Cognitive Health Ingredients Market Volume Share (%), by Country 2024 & 2032
- Figure 47: Asia Pacific Cognitive Health Ingredients Market Revenue (Million), by Product Type 2024 & 2032
- Figure 48: Asia Pacific Cognitive Health Ingredients Market Volume (K Tons), by Product Type 2024 & 2032
- Figure 49: Asia Pacific Cognitive Health Ingredients Market Revenue Share (%), by Product Type 2024 & 2032
- Figure 50: Asia Pacific Cognitive Health Ingredients Market Volume Share (%), by Product Type 2024 & 2032
- Figure 51: Asia Pacific Cognitive Health Ingredients Market Revenue (Million), by Application 2024 & 2032
- Figure 52: Asia Pacific Cognitive Health Ingredients Market Volume (K Tons), by Application 2024 & 2032
- Figure 53: Asia Pacific Cognitive Health Ingredients Market Revenue Share (%), by Application 2024 & 2032
- Figure 54: Asia Pacific Cognitive Health Ingredients Market Volume Share (%), by Application 2024 & 2032
- Figure 55: Asia Pacific Cognitive Health Ingredients Market Revenue (Million), by Country 2024 & 2032
- Figure 56: Asia Pacific Cognitive Health Ingredients Market Volume (K Tons), by Country 2024 & 2032
- Figure 57: Asia Pacific Cognitive Health Ingredients Market Revenue Share (%), by Country 2024 & 2032
- Figure 58: Asia Pacific Cognitive Health Ingredients Market Volume Share (%), by Country 2024 & 2032
- Figure 59: South America Cognitive Health Ingredients Market Revenue (Million), by Product Type 2024 & 2032
- Figure 60: South America Cognitive Health Ingredients Market Volume (K Tons), by Product Type 2024 & 2032
- Figure 61: South America Cognitive Health Ingredients Market Revenue Share (%), by Product Type 2024 & 2032
- Figure 62: South America Cognitive Health Ingredients Market Volume Share (%), by Product Type 2024 & 2032
- Figure 63: South America Cognitive Health Ingredients Market Revenue (Million), by Application 2024 & 2032
- Figure 64: South America Cognitive Health Ingredients Market Volume (K Tons), by Application 2024 & 2032
- Figure 65: South America Cognitive Health Ingredients Market Revenue Share (%), by Application 2024 & 2032
- Figure 66: South America Cognitive Health Ingredients Market Volume Share (%), by Application 2024 & 2032
- Figure 67: South America Cognitive Health Ingredients Market Revenue (Million), by Country 2024 & 2032
- Figure 68: South America Cognitive Health Ingredients Market Volume (K Tons), by Country 2024 & 2032
- Figure 69: South America Cognitive Health Ingredients Market Revenue Share (%), by Country 2024 & 2032
- Figure 70: South America Cognitive Health Ingredients Market Volume Share (%), by Country 2024 & 2032
- Figure 71: Middle East and Africa Cognitive Health Ingredients Market Revenue (Million), by Product Type 2024 & 2032
- Figure 72: Middle East and Africa Cognitive Health Ingredients Market Volume (K Tons), by Product Type 2024 & 2032
- Figure 73: Middle East and Africa Cognitive Health Ingredients Market Revenue Share (%), by Product Type 2024 & 2032
- Figure 74: Middle East and Africa Cognitive Health Ingredients Market Volume Share (%), by Product Type 2024 & 2032
- Figure 75: Middle East and Africa Cognitive Health Ingredients Market Revenue (Million), by Application 2024 & 2032
- Figure 76: Middle East and Africa Cognitive Health Ingredients Market Volume (K Tons), by Application 2024 & 2032
- Figure 77: Middle East and Africa Cognitive Health Ingredients Market Revenue Share (%), by Application 2024 & 2032
- Figure 78: Middle East and Africa Cognitive Health Ingredients Market Volume Share (%), by Application 2024 & 2032
- Figure 79: Middle East and Africa Cognitive Health Ingredients Market Revenue (Million), by Country 2024 & 2032
- Figure 80: Middle East and Africa Cognitive Health Ingredients Market Volume (K Tons), by Country 2024 & 2032
- Figure 81: Middle East and Africa Cognitive Health Ingredients Market Revenue Share (%), by Country 2024 & 2032
- Figure 82: Middle East and Africa Cognitive Health Ingredients Market Volume Share (%), by Country 2024 & 2032
List of Tables
- Table 1: Global Cognitive Health Ingredients Market Revenue Million Forecast, by Region 2019 & 2032
- Table 2: Global Cognitive Health Ingredients Market Volume K Tons Forecast, by Region 2019 & 2032
- Table 3: Global Cognitive Health Ingredients Market Revenue Million Forecast, by Product Type 2019 & 2032
- Table 4: Global Cognitive Health Ingredients Market Volume K Tons Forecast, by Product Type 2019 & 2032
- Table 5: Global Cognitive Health Ingredients Market Revenue Million Forecast, by Application 2019 & 2032
- Table 6: Global Cognitive Health Ingredients Market Volume K Tons Forecast, by Application 2019 & 2032
- Table 7: Global Cognitive Health Ingredients Market Revenue Million Forecast, by Region 2019 & 2032
- Table 8: Global Cognitive Health Ingredients Market Volume K Tons Forecast, by Region 2019 & 2032
- Table 9: Global Cognitive Health Ingredients Market Revenue Million Forecast, by Country 2019 & 2032
- Table 10: Global Cognitive Health Ingredients Market Volume K Tons Forecast, by Country 2019 & 2032
- Table 11: United States Cognitive Health Ingredients Market Revenue (Million) Forecast, by Application 2019 & 2032
- Table 12: United States Cognitive Health Ingredients Market Volume (K Tons) Forecast, by Application 2019 & 2032
- Table 13: Canada Cognitive Health Ingredients Market Revenue (Million) Forecast, by Application 2019 & 2032
- Table 14: Canada Cognitive Health Ingredients Market Volume (K Tons) Forecast, by Application 2019 & 2032
- Table 15: Mexico Cognitive Health Ingredients Market Revenue (Million) Forecast, by Application 2019 & 2032
- Table 16: Mexico Cognitive Health Ingredients Market Volume (K Tons) Forecast, by Application 2019 & 2032
- Table 17: Rest of North America Cognitive Health Ingredients Market Revenue (Million) Forecast, by Application 2019 & 2032
- Table 18: Rest of North America Cognitive Health Ingredients Market Volume (K Tons) Forecast, by Application 2019 & 2032
- Table 19: Global Cognitive Health Ingredients Market Revenue Million Forecast, by Country 2019 & 2032
- Table 20: Global Cognitive Health Ingredients Market Volume K Tons Forecast, by Country 2019 & 2032
- Table 21: Germany Cognitive Health Ingredients Market Revenue (Million) Forecast, by Application 2019 & 2032
- Table 22: Germany Cognitive Health Ingredients Market Volume (K Tons) Forecast, by Application 2019 & 2032
- Table 23: United Kingdom Cognitive Health Ingredients Market Revenue (Million) Forecast, by Application 2019 & 2032
- Table 24: United Kingdom Cognitive Health Ingredients Market Volume (K Tons) Forecast, by Application 2019 & 2032
- Table 25: France Cognitive Health Ingredients Market Revenue (Million) Forecast, by Application 2019 & 2032
- Table 26: France Cognitive Health Ingredients Market Volume (K Tons) Forecast, by Application 2019 & 2032
- Table 27: Russia Cognitive Health Ingredients Market Revenue (Million) Forecast, by Application 2019 & 2032
- Table 28: Russia Cognitive Health Ingredients Market Volume (K Tons) Forecast, by Application 2019 & 2032
- Table 29: Spain Cognitive Health Ingredients Market Revenue (Million) Forecast, by Application 2019 & 2032
- Table 30: Spain Cognitive Health Ingredients Market Volume (K Tons) Forecast, by Application 2019 & 2032
- Table 31: Italy Cognitive Health Ingredients Market Revenue (Million) Forecast, by Application 2019 & 2032
- Table 32: Italy Cognitive Health Ingredients Market Volume (K Tons) Forecast, by Application 2019 & 2032
- Table 33: Rest of Europe Cognitive Health Ingredients Market Revenue (Million) Forecast, by Application 2019 & 2032
- Table 34: Rest of Europe Cognitive Health Ingredients Market Volume (K Tons) Forecast, by Application 2019 & 2032
- Table 35: Global Cognitive Health Ingredients Market Revenue Million Forecast, by Country 2019 & 2032
- Table 36: Global Cognitive Health Ingredients Market Volume K Tons Forecast, by Country 2019 & 2032
- Table 37: India Cognitive Health Ingredients Market Revenue (Million) Forecast, by Application 2019 & 2032
- Table 38: India Cognitive Health Ingredients Market Volume (K Tons) Forecast, by Application 2019 & 2032
- Table 39: China Cognitive Health Ingredients Market Revenue (Million) Forecast, by Application 2019 & 2032
- Table 40: China Cognitive Health Ingredients Market Volume (K Tons) Forecast, by Application 2019 & 2032
- Table 41: Japan Cognitive Health Ingredients Market Revenue (Million) Forecast, by Application 2019 & 2032
- Table 42: Japan Cognitive Health Ingredients Market Volume (K Tons) Forecast, by Application 2019 & 2032
- Table 43: Australia Cognitive Health Ingredients Market Revenue (Million) Forecast, by Application 2019 & 2032
- Table 44: Australia Cognitive Health Ingredients Market Volume (K Tons) Forecast, by Application 2019 & 2032
- Table 45: Rest of Asia Pacific Cognitive Health Ingredients Market Revenue (Million) Forecast, by Application 2019 & 2032
- Table 46: Rest of Asia Pacific Cognitive Health Ingredients Market Volume (K Tons) Forecast, by Application 2019 & 2032
- Table 47: Global Cognitive Health Ingredients Market Revenue Million Forecast, by Country 2019 & 2032
- Table 48: Global Cognitive Health Ingredients Market Volume K Tons Forecast, by Country 2019 & 2032
- Table 49: Brazil Cognitive Health Ingredients Market Revenue (Million) Forecast, by Application 2019 & 2032
- Table 50: Brazil Cognitive Health Ingredients Market Volume (K Tons) Forecast, by Application 2019 & 2032
- Table 51: Argentina Cognitive Health Ingredients Market Revenue (Million) Forecast, by Application 2019 & 2032
- Table 52: Argentina Cognitive Health Ingredients Market Volume (K Tons) Forecast, by Application 2019 & 2032
- Table 53: Rest of South America Cognitive Health Ingredients Market Revenue (Million) Forecast, by Application 2019 & 2032
- Table 54: Rest of South America Cognitive Health Ingredients Market Volume (K Tons) Forecast, by Application 2019 & 2032
- Table 55: Global Cognitive Health Ingredients Market Revenue Million Forecast, by Country 2019 & 2032
- Table 56: Global Cognitive Health Ingredients Market Volume K Tons Forecast, by Country 2019 & 2032
- Table 57: South Africa Cognitive Health Ingredients Market Revenue (Million) Forecast, by Application 2019 & 2032
- Table 58: South Africa Cognitive Health Ingredients Market Volume (K Tons) Forecast, by Application 2019 & 2032
- Table 59: Saudi Arabia Cognitive Health Ingredients Market Revenue (Million) Forecast, by Application 2019 & 2032
- Table 60: Saudi Arabia Cognitive Health Ingredients Market Volume (K Tons) Forecast, by Application 2019 & 2032
- Table 61: Rest of Middle East and Africa Cognitive Health Ingredients Market Revenue (Million) Forecast, by Application 2019 & 2032
- Table 62: Rest of Middle East and Africa Cognitive Health Ingredients Market Volume (K Tons) Forecast, by Application 2019 & 2032
- Table 63: Global Cognitive Health Ingredients Market Revenue Million Forecast, by Product Type 2019 & 2032
- Table 64: Global Cognitive Health Ingredients Market Volume K Tons Forecast, by Product Type 2019 & 2032
- Table 65: Global Cognitive Health Ingredients Market Revenue Million Forecast, by Application 2019 & 2032
- Table 66: Global Cognitive Health Ingredients Market Volume K Tons Forecast, by Application 2019 & 2032
- Table 67: Global Cognitive Health Ingredients Market Revenue Million Forecast, by Country 2019 & 2032
- Table 68: Global Cognitive Health Ingredients Market Volume K Tons Forecast, by Country 2019 & 2032
- Table 69: United States Cognitive Health Ingredients Market Revenue (Million) Forecast, by Application 2019 & 2032
- Table 70: United States Cognitive Health Ingredients Market Volume (K Tons) Forecast, by Application 2019 & 2032
- Table 71: Canada Cognitive Health Ingredients Market Revenue (Million) Forecast, by Application 2019 & 2032
- Table 72: Canada Cognitive Health Ingredients Market Volume (K Tons) Forecast, by Application 2019 & 2032
- Table 73: Mexico Cognitive Health Ingredients Market Revenue (Million) Forecast, by Application 2019 & 2032
- Table 74: Mexico Cognitive Health Ingredients Market Volume (K Tons) Forecast, by Application 2019 & 2032
- Table 75: Rest of North America Cognitive Health Ingredients Market Revenue (Million) Forecast, by Application 2019 & 2032
- Table 76: Rest of North America Cognitive Health Ingredients Market Volume (K Tons) Forecast, by Application 2019 & 2032
- Table 77: Global Cognitive Health Ingredients Market Revenue Million Forecast, by Product Type 2019 & 2032
- Table 78: Global Cognitive Health Ingredients Market Volume K Tons Forecast, by Product Type 2019 & 2032
- Table 79: Global Cognitive Health Ingredients Market Revenue Million Forecast, by Application 2019 & 2032
- Table 80: Global Cognitive Health Ingredients Market Volume K Tons Forecast, by Application 2019 & 2032
- Table 81: Global Cognitive Health Ingredients Market Revenue Million Forecast, by Country 2019 & 2032
- Table 82: Global Cognitive Health Ingredients Market Volume K Tons Forecast, by Country 2019 & 2032
- Table 83: Germany Cognitive Health Ingredients Market Revenue (Million) Forecast, by Application 2019 & 2032
- Table 84: Germany Cognitive Health Ingredients Market Volume (K Tons) Forecast, by Application 2019 & 2032
- Table 85: United Kingdom Cognitive Health Ingredients Market Revenue (Million) Forecast, by Application 2019 & 2032
- Table 86: United Kingdom Cognitive Health Ingredients Market Volume (K Tons) Forecast, by Application 2019 & 2032
- Table 87: France Cognitive Health Ingredients Market Revenue (Million) Forecast, by Application 2019 & 2032
- Table 88: France Cognitive Health Ingredients Market Volume (K Tons) Forecast, by Application 2019 & 2032
- Table 89: Russia Cognitive Health Ingredients Market Revenue (Million) Forecast, by Application 2019 & 2032
- Table 90: Russia Cognitive Health Ingredients Market Volume (K Tons) Forecast, by Application 2019 & 2032
- Table 91: Spain Cognitive Health Ingredients Market Revenue (Million) Forecast, by Application 2019 & 2032
- Table 92: Spain Cognitive Health Ingredients Market Volume (K Tons) Forecast, by Application 2019 & 2032
- Table 93: Italy Cognitive Health Ingredients Market Revenue (Million) Forecast, by Application 2019 & 2032
- Table 94: Italy Cognitive Health Ingredients Market Volume (K Tons) Forecast, by Application 2019 & 2032
- Table 95: Rest of Europe Cognitive Health Ingredients Market Revenue (Million) Forecast, by Application 2019 & 2032
- Table 96: Rest of Europe Cognitive Health Ingredients Market Volume (K Tons) Forecast, by Application 2019 & 2032
- Table 97: Global Cognitive Health Ingredients Market Revenue Million Forecast, by Product Type 2019 & 2032
- Table 98: Global Cognitive Health Ingredients Market Volume K Tons Forecast, by Product Type 2019 & 2032
- Table 99: Global Cognitive Health Ingredients Market Revenue Million Forecast, by Application 2019 & 2032
- Table 100: Global Cognitive Health Ingredients Market Volume K Tons Forecast, by Application 2019 & 2032
- Table 101: Global Cognitive Health Ingredients Market Revenue Million Forecast, by Country 2019 & 2032
- Table 102: Global Cognitive Health Ingredients Market Volume K Tons Forecast, by Country 2019 & 2032
- Table 103: India Cognitive Health Ingredients Market Revenue (Million) Forecast, by Application 2019 & 2032
- Table 104: India Cognitive Health Ingredients Market Volume (K Tons) Forecast, by Application 2019 & 2032
- Table 105: China Cognitive Health Ingredients Market Revenue (Million) Forecast, by Application 2019 & 2032
- Table 106: China Cognitive Health Ingredients Market Volume (K Tons) Forecast, by Application 2019 & 2032
- Table 107: Japan Cognitive Health Ingredients Market Revenue (Million) Forecast, by Application 2019 & 2032
- Table 108: Japan Cognitive Health Ingredients Market Volume (K Tons) Forecast, by Application 2019 & 2032
- Table 109: Australia Cognitive Health Ingredients Market Revenue (Million) Forecast, by Application 2019 & 2032
- Table 110: Australia Cognitive Health Ingredients Market Volume (K Tons) Forecast, by Application 2019 & 2032
- Table 111: Rest of Asia Pacific Cognitive Health Ingredients Market Revenue (Million) Forecast, by Application 2019 & 2032
- Table 112: Rest of Asia Pacific Cognitive Health Ingredients Market Volume (K Tons) Forecast, by Application 2019 & 2032
- Table 113: Global Cognitive Health Ingredients Market Revenue Million Forecast, by Product Type 2019 & 2032
- Table 114: Global Cognitive Health Ingredients Market Volume K Tons Forecast, by Product Type 2019 & 2032
- Table 115: Global Cognitive Health Ingredients Market Revenue Million Forecast, by Application 2019 & 2032
- Table 116: Global Cognitive Health Ingredients Market Volume K Tons Forecast, by Application 2019 & 2032
- Table 117: Global Cognitive Health Ingredients Market Revenue Million Forecast, by Country 2019 & 2032
- Table 118: Global Cognitive Health Ingredients Market Volume K Tons Forecast, by Country 2019 & 2032
- Table 119: Brazil Cognitive Health Ingredients Market Revenue (Million) Forecast, by Application 2019 & 2032
- Table 120: Brazil Cognitive Health Ingredients Market Volume (K Tons) Forecast, by Application 2019 & 2032
- Table 121: Argentina Cognitive Health Ingredients Market Revenue (Million) Forecast, by Application 2019 & 2032
- Table 122: Argentina Cognitive Health Ingredients Market Volume (K Tons) Forecast, by Application 2019 & 2032
- Table 123: Rest of South America Cognitive Health Ingredients Market Revenue (Million) Forecast, by Application 2019 & 2032
- Table 124: Rest of South America Cognitive Health Ingredients Market Volume (K Tons) Forecast, by Application 2019 & 2032
- Table 125: Global Cognitive Health Ingredients Market Revenue Million Forecast, by Product Type 2019 & 2032
- Table 126: Global Cognitive Health Ingredients Market Volume K Tons Forecast, by Product Type 2019 & 2032
- Table 127: Global Cognitive Health Ingredients Market Revenue Million Forecast, by Application 2019 & 2032
- Table 128: Global Cognitive Health Ingredients Market Volume K Tons Forecast, by Application 2019 & 2032
- Table 129: Global Cognitive Health Ingredients Market Revenue Million Forecast, by Country 2019 & 2032
- Table 130: Global Cognitive Health Ingredients Market Volume K Tons Forecast, by Country 2019 & 2032
- Table 131: South Africa Cognitive Health Ingredients Market Revenue (Million) Forecast, by Application 2019 & 2032
- Table 132: South Africa Cognitive Health Ingredients Market Volume (K Tons) Forecast, by Application 2019 & 2032
- Table 133: Saudi Arabia Cognitive Health Ingredients Market Revenue (Million) Forecast, by Application 2019 & 2032
- Table 134: Saudi Arabia Cognitive Health Ingredients Market Volume (K Tons) Forecast, by Application 2019 & 2032
- Table 135: Rest of Middle East and Africa Cognitive Health Ingredients Market Revenue (Million) Forecast, by Application 2019 & 2032
- Table 136: Rest of Middle East and Africa Cognitive Health Ingredients Market Volume (K Tons) Forecast, by Application 2019 & 2032
Frequently Asked Questions
1. What is the projected Compound Annual Growth Rate (CAGR) of the Cognitive Health Ingredients Market?
The projected CAGR is approximately 5.87%.
2. Which companies are prominent players in the Cognitive Health Ingredients Market?
Key companies in the market include Koninklijke DSM, Food Chem Internationa, Kerry Inc, DuPont de Nemours Inc, Archer Daniels Midland Company, BASF SE, Corbion N V, Cargill Inc, Ingredion Incorporated, Rousselot BV.
3. What are the main segments of the Cognitive Health Ingredients Market?
The market segments include Product Type, Application.
4. Can you provide details about the market size?
The market size is estimated to be USD 9000 Million as of 2022.
5. What are some drivers contributing to market growth?
Increasing Demand For Convenience & Processed Food.
6. What are the notable trends driving market growth?
Natural Health Ingredients Perceived to Be Highly Effective among Arthritis Patients.
7. Are there any restraints impacting market growth?
Increased Consumer Awareness On Side-Effects Of Chemical Additives.
8. Can you provide examples of recent developments in the market?
The launch of new products by major players
9. What pricing options are available for accessing the report?
Pricing options include single-user, multi-user, and enterprise licenses priced at USD 4750, USD 5250, and USD 8750 respectively.
10. Is the market size provided in terms of value or volume?
The market size is provided in terms of value, measured in Million and volume, measured in K Tons.
11. Are there any specific market keywords associated with the report?
Yes, the market keyword associated with the report is "Cognitive Health Ingredients Market," which aids in identifying and referencing the specific market segment covered.
12. How do I determine which pricing option suits my needs best?
The pricing options vary based on user requirements and access needs. Individual users may opt for single-user licenses, while businesses requiring broader access may choose multi-user or enterprise licenses for cost-effective access to the report.
13. Are there any additional resources or data provided in the Cognitive Health Ingredients Market report?
While the report offers comprehensive insights, it's advisable to review the specific contents or supplementary materials provided to ascertain if additional resources or data are available.
14. How can I stay updated on further developments or reports in the Cognitive Health Ingredients Market?
To stay informed about further developments, trends, and reports in the Cognitive Health Ingredients Market, consider subscribing to industry newsletters, following relevant companies and organizations, or regularly checking reputable industry news sources and publications.
Methodology
Step 1 - Identification of Relevant Samples Size from Population Database


Step 2 - Approaches for Defining Global Market Size (Value, Volume* & Price*)

Note*: In applicable scenarios
Step 3 - Data Sources
Primary Research
- Web Analytics
- Survey Reports
- Research Institute
- Latest Research Reports
- Opinion Leaders
Secondary Research
- Annual Reports
- White Paper
- Latest Press Release
- Industry Association
- Paid Database
- Investor Presentations

Step 4 - Data Triangulation
Involves using different sources of information in order to increase the validity of a study
These sources are likely to be stakeholders in a program - participants, other researchers, program staff, other community members, and so on.
Then we put all data in single framework & apply various statistical tools to find out the dynamic on the market.
During the analysis stage, feedback from the stakeholder groups would be compared to determine areas of agreement as well as areas of divergence


