
Key Insights
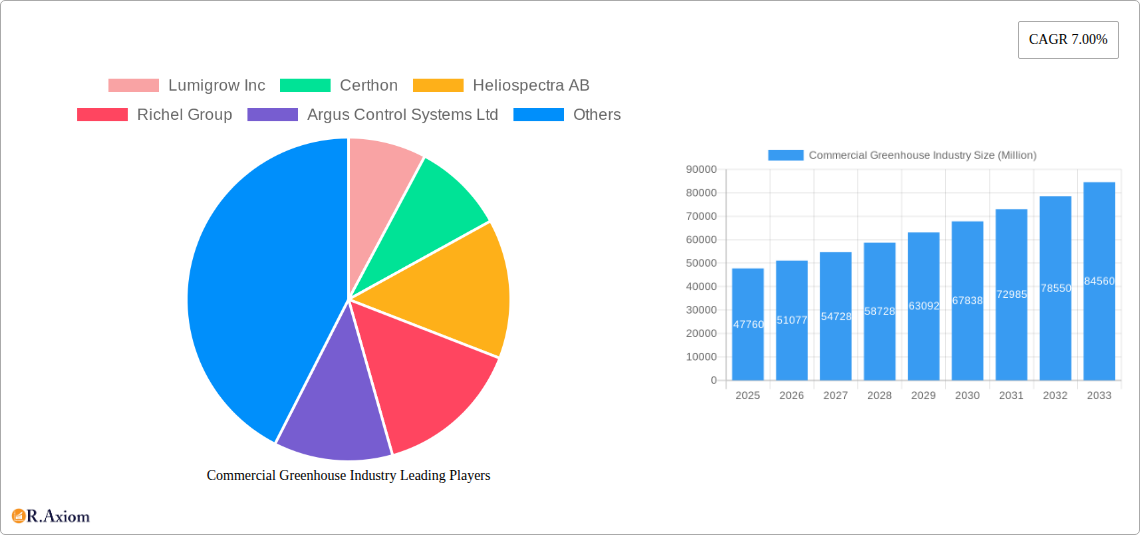
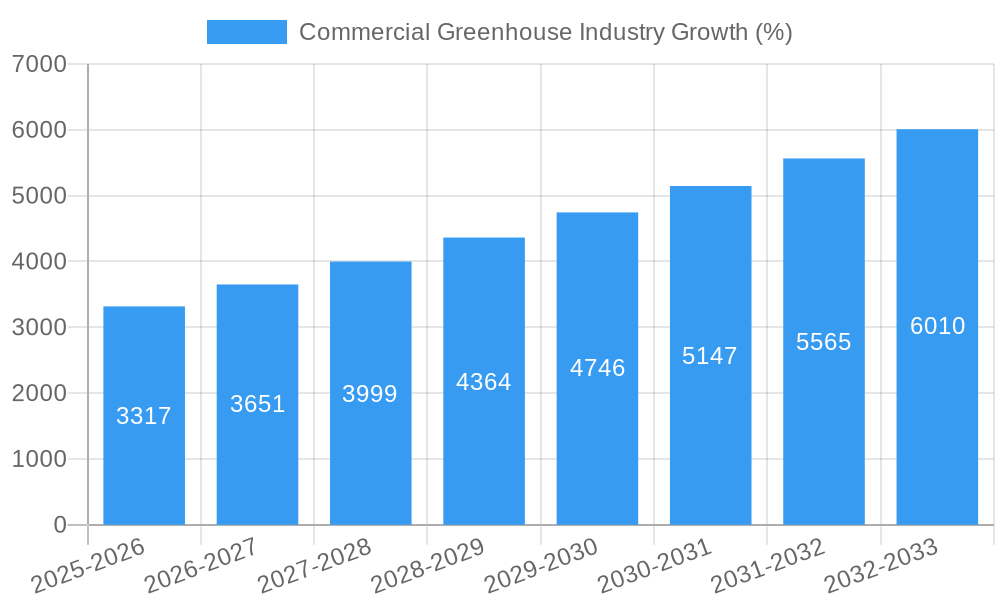
The commercial greenhouse industry, valued at $47.76 billion in 2025, is experiencing robust growth, projected to expand at a compound annual growth rate (CAGR) of 7% from 2025 to 2033. This expansion is driven by several key factors. Increasing consumer demand for fresh, locally sourced produce fuels the need for efficient and technologically advanced greenhouse operations. Advancements in greenhouse technology, such as sophisticated climate control systems (heating, cooling, and lighting) and automation, are enhancing productivity and yield, further stimulating market growth. The rising adoption of sustainable agricultural practices, including hydroponics and aeroponics within greenhouses, is also contributing to the sector's expansion. Furthermore, government initiatives promoting food security and sustainable agriculture are creating a favorable regulatory environment for investment and growth within the industry. Market segmentation reveals strong performance across various greenhouse types (glass and plastic), equipment categories (heating, cooling, and other systems), and crop types (horticulture crops and herbs).
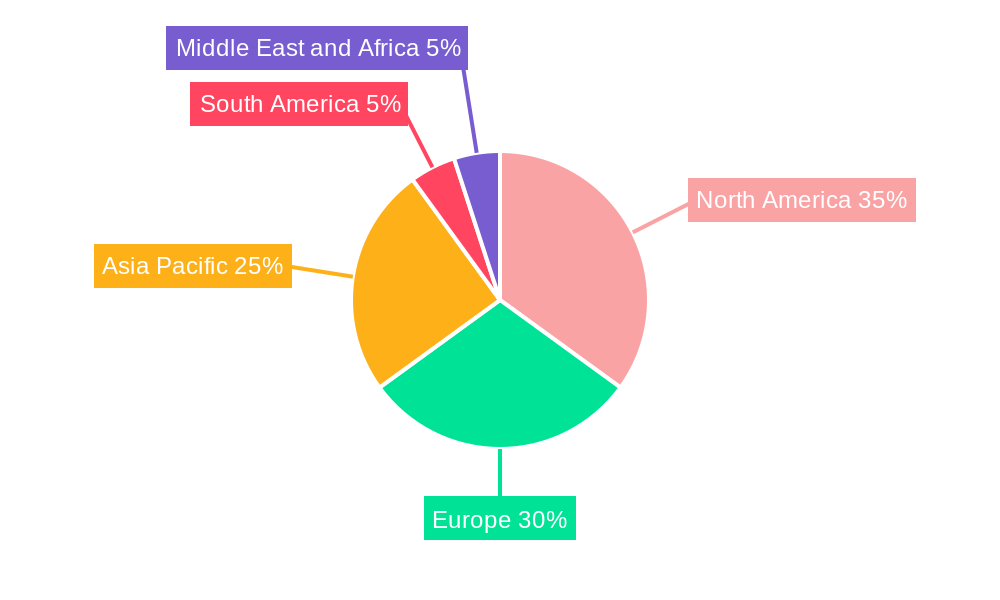
Geographically, North America and Europe currently hold significant market shares, but the Asia-Pacific region is anticipated to witness substantial growth in the coming years due to increasing urbanization, rising disposable incomes, and supportive government policies promoting agricultural modernization. While challenges such as initial high investment costs for greenhouse infrastructure and potential supply chain disruptions related to component sourcing exist, the overall industry outlook remains positive, driven by sustained demand and technological innovation. Companies like Lumigrow, Certhon, and Richel Group are leading the way in providing advanced greenhouse solutions, contributing to the industry's dynamic evolution and expansion. The continued focus on improving resource efficiency and optimizing production methods will be key factors influencing future market growth trajectories.
Commercial Greenhouse Industry: A Comprehensive Market Report (2019-2033)
This detailed report provides a comprehensive analysis of the Commercial Greenhouse Industry, offering actionable insights for stakeholders across the value chain. With a study period spanning 2019-2033, a base year of 2025, and a forecast period of 2025-2033, this report leverages rigorous data analysis to illuminate market trends, segment performance, and future growth potential. The report covers a market valued at $XX Million in 2025, projected to reach $XX Million by 2033, exhibiting a CAGR of XX%. Key players analyzed include Lumigrow Inc, Certhon, Heliospectra AB, Richel Group, Argus Control Systems Ltd, Agra Tech Inc, Rough Brothers Inc, Logiqs BV, International Greenhouse Company, and Gibraltar Industries (Nexus Corporation). The report segments the market by greenhouse type (glass, plastic), equipment type (heating, cooling, other), and crop type (horticulture, herbs, other).
Commercial Greenhouse Industry Market Concentration & Innovation
The commercial greenhouse industry exhibits a moderately concentrated market structure, with a few large players holding significant market share, while numerous smaller companies cater to niche segments. Key players like Richel Group and Certhon command substantial market share due to their extensive global reach and technological expertise. However, the market remains dynamic, with ongoing innovation driving competition. Mergers and acquisitions (M&A) activity plays a significant role in shaping the market landscape. For example, Richel Group's strategic partnership exemplifies efforts to enhance market position and reach. While precise M&A deal values are not publicly disclosed for all transactions, the industry has seen deals in the range of tens to hundreds of millions of dollars.
- Market Concentration: The top 5 players collectively hold approximately XX% market share.
- Innovation Drivers: Technological advancements in automation, climate control, lighting, and sustainable practices are key innovation drivers.
- Regulatory Frameworks: Government regulations pertaining to energy efficiency, water usage, and sustainable agriculture impact market dynamics.
- Product Substitutes: Traditional farming methods pose a degree of competition but increasingly, technology and climate control benefits position the commercial greenhouse industry as a reliable alternative for quality and year round production.
- End-User Trends: Growing demand for high-quality, locally sourced produce, particularly in urban areas, fuels industry expansion.
- M&A Activities: Strategic partnerships and acquisitions consolidate market share and enhance technological capabilities. The average M&A deal value is estimated at $XX Million.
Commercial Greenhouse Industry Industry Trends & Insights
The commercial greenhouse industry is experiencing robust growth driven by factors like increasing demand for fresh produce, advancements in greenhouse technology, and favorable government policies promoting sustainable agriculture. The market is witnessing a rapid shift towards advanced technologies such as precision climate control, automation, and data analytics for optimizing crop yield and resource efficiency. Consumer preferences for locally sourced, organically grown food are also driving adoption of greenhouse technology. The competitive landscape is intensifying, leading to increased investments in R&D, strategic partnerships, and innovative business models. This competitive pressure fosters efficiency and drives innovation across all segments of the commercial greenhouse market. The industry demonstrates a growing interest in environmentally friendly technologies, such as renewable energy integration and water conservation, impacting both operational costs and brand image.
Dominant Markets & Segments in Commercial Greenhouse Industry
The global commercial greenhouse market is geographically diverse, with significant growth across multiple regions. However, North America and Europe currently dominate due to strong agricultural sectors and higher adoption of advanced greenhouse technologies. Within these regions, specific countries like the Netherlands and Canada show particularly strong market penetration.
- Leading Region: North America and Europe
- Leading Segment (Greenhouse Type): Glass greenhouses hold a larger market share currently, owing to their durability and climate control capabilities. However, plastic greenhouses show faster growth due to lower initial investment costs.
- Leading Segment (Equipment Type): Heating and cooling systems are essential components, representing a substantial segment, while the "other equipment" segment (lighting, automation, etc.) shows the highest growth.
- Leading Segment (Crop Type): Horticulture crops (tomatoes, lettuce, peppers, etc.) constitute the largest segment, followed by herbs, with significant growth potential in other specialized crops.
Key Drivers:
- Economic Policies: Government subsidies and incentives for sustainable agriculture.
- Infrastructure: Availability of reliable energy sources and transportation networks.
- Consumer Preferences: Demand for fresh, locally sourced produce.
- Technological advancements: Improved climate control, automation, and energy efficiency
Commercial Greenhouse Industry Product Developments
Recent product innovations include the introduction of more energy-efficient lighting systems (e.g., Heliospectra's MITRA Flex), advanced climate control solutions, and automated harvesting technologies. These innovations enhance yield, reduce operating costs, and improve overall efficiency. The market is seeing integration of AI and IoT in greenhouse management systems. This shift allows for data-driven decision-making, optimized resource allocation, and improved crop quality and yield. The focus is on providing customized solutions for diverse crop types and environmental conditions, leading to greater market fit and enhanced competitiveness.
Report Scope & Segmentation Analysis
This report segments the commercial greenhouse market based on greenhouse type (glass and plastic), equipment type (heating, cooling, and other), and crop type (horticulture crops, herbs, and other). Each segment is analyzed in detail, providing insights into market size, growth projections, and competitive dynamics. For example, the plastic greenhouse segment is projected to exhibit a higher growth rate compared to the glass greenhouse segment, driven by cost-effectiveness and ease of installation. Similarly, the 'other equipment' segment, encompassing automation and advanced technologies, presents a significant growth opportunity.
Key Drivers of Commercial Greenhouse Industry Growth
Several key factors contribute to the growth of the commercial greenhouse industry. These include increasing urbanization and growing demand for fresh produce in densely populated areas. Advancements in greenhouse technologies, such as improved climate control systems and automation, enhance efficiency and profitability. Favorable government policies, such as subsidies and incentives for sustainable agriculture, are further boosting industry growth. Technological advancements in sensors, AI, and data analytics allow for precision agriculture, optimizing resource use and maximizing yields.
Challenges in the Commercial Greenhouse Industry Sector
The commercial greenhouse industry faces several challenges, including high initial investment costs for advanced technologies. Fluctuations in energy prices directly impact operating costs, presenting a significant risk. Supply chain disruptions can affect the availability of necessary equipment and inputs. Intense competition requires continuous innovation and efficiency improvements to maintain profitability. The increasing need for skilled labor also poses a challenge.
Emerging Opportunities in Commercial Greenhouse Industry
Emerging opportunities include vertical farming and the growing market for specialized crops, including medicinal cannabis and other high-value produce. The integration of renewable energy sources into greenhouse operations presents a significant opportunity for cost savings and environmental sustainability. Further advancements in automation and robotics offer increased efficiency and productivity. The utilization of AI and machine learning for predictive analytics and automated decision-making is also a promising area of growth.
Leading Players in the Commercial Greenhouse Industry Market
- Lumigrow Inc
- Certhon
- Heliospectra AB
- Richel Group
- Argus Control Systems Ltd
- Agra Tech Inc
- Rough Brothers Inc
- Logiqs BV
- International Greenhouse Company
- Gibraltar Industries (Nexus Corporation)
Key Developments in Commercial Greenhouse Industry Industry
- September 2023: Richel Group announced a three-year strategic partnership to enhance its high-tech greenhouse design and construction capabilities in challenging climates (Middle East, Asia). This signifies a major investment in expanding market reach and addressing specific regional demands.
- June 2023: Certhon and Living Greens Farm partnered to globally expand Living Greens Farm's aeroponic technology. This collaboration leverages Certhon's expertise and network to bring a new growing system to the global market, presenting a potential disruptive technology.
- February 2023: Heliospectra AB launched MITRA Flex, a wirelessly controlled flexible far-red light, expanding its product portfolio and enhancing customization options for growers. This product innovation targets specific growing needs and addresses market demands for flexible solutions.
Strategic Outlook for Commercial Greenhouse Industry Market
The commercial greenhouse industry is poised for continued growth driven by technological advancements, increasing demand for fresh produce, and a growing focus on sustainable agriculture. Future market potential lies in the adoption of advanced technologies, such as AI, IoT, and robotics, to enhance efficiency, productivity, and sustainability. Expanding into new markets and developing innovative business models, such as vertical farming and specialized crop production, will be crucial for sustained growth and competitiveness. The industry's focus on environmental sustainability, through energy-efficient technologies and resource management, will further drive its growth and appeal to environmentally conscious consumers.
Commercial Greenhouse Industry Segmentation
- 1. Production Analysis
- 2. Consumption Analysis
- 3. Import Market Analysis (Value & Volume)
- 4. Export Market Analysis (Value & Volume)
- 5. Price Trend Analysis
Commercial Greenhouse Industry Segmentation By Geography
-
1. North America
- 1.1. United States
- 1.2. Canada
- 1.3. Mexico
-
2. South America
- 2.1. Brazil
- 2.2. Argentina
- 2.3. Rest of South America
-
3. Europe
- 3.1. United Kingdom
- 3.2. Germany
- 3.3. France
- 3.4. Italy
- 3.5. Spain
- 3.6. Russia
- 3.7. Benelux
- 3.8. Nordics
- 3.9. Rest of Europe
-
4. Middle East & Africa
- 4.1. Turkey
- 4.2. Israel
- 4.3. GCC
- 4.4. North Africa
- 4.5. South Africa
- 4.6. Rest of Middle East & Africa
-
5. Asia Pacific
- 5.1. China
- 5.2. India
- 5.3. Japan
- 5.4. South Korea
- 5.5. ASEAN
- 5.6. Oceania
- 5.7. Rest of Asia Pacific
Commercial Greenhouse Industry REPORT HIGHLIGHTS
| Aspects | Details |
|---|---|
| Study Period | 2019-2033 |
| Base Year | 2024 |
| Estimated Year | 2025 |
| Forecast Period | 2025-2033 |
| Historical Period | 2019-2024 |
| Growth Rate | CAGR of 7.00% from 2019-2033 |
| Segmentation |
|
Table of Contents
- 1. Introduction
- 1.1. Research Scope
- 1.2. Market Segmentation
- 1.3. Research Methodology
- 1.4. Definitions and Assumptions
- 2. Executive Summary
- 2.1. Introduction
- 3. Market Dynamics
- 3.1. Introduction
- 3.2. Market Drivers
- 3.2.1. Decreasing Per Capita Arable Land; Increased Demand for Food
- 3.3. Market Restrains
- 3.3.1. High Initial Investments; Requirement of Precision Agriculture
- 3.4. Market Trends
- 3.4.1. Horticultural Crops Are In High Demand
- 4. Market Factor Analysis
- 4.1. Porters Five Forces
- 4.2. Supply/Value Chain
- 4.3. PESTEL analysis
- 4.4. Market Entropy
- 4.5. Patent/Trademark Analysis
- 5. Global Commercial Greenhouse Industry Analysis, Insights and Forecast, 2019-2031
- 5.1. Market Analysis, Insights and Forecast - by Production Analysis
- 5.2. Market Analysis, Insights and Forecast - by Consumption Analysis
- 5.3. Market Analysis, Insights and Forecast - by Import Market Analysis (Value & Volume)
- 5.4. Market Analysis, Insights and Forecast - by Export Market Analysis (Value & Volume)
- 5.5. Market Analysis, Insights and Forecast - by Price Trend Analysis
- 5.6. Market Analysis, Insights and Forecast - by Region
- 5.6.1. North America
- 5.6.2. South America
- 5.6.3. Europe
- 5.6.4. Middle East & Africa
- 5.6.5. Asia Pacific
- 5.1. Market Analysis, Insights and Forecast - by Production Analysis
- 6. North America Commercial Greenhouse Industry Analysis, Insights and Forecast, 2019-2031
- 6.1. Market Analysis, Insights and Forecast - by Production Analysis
- 6.2. Market Analysis, Insights and Forecast - by Consumption Analysis
- 6.3. Market Analysis, Insights and Forecast - by Import Market Analysis (Value & Volume)
- 6.4. Market Analysis, Insights and Forecast - by Export Market Analysis (Value & Volume)
- 6.5. Market Analysis, Insights and Forecast - by Price Trend Analysis
- 6.1. Market Analysis, Insights and Forecast - by Production Analysis
- 7. South America Commercial Greenhouse Industry Analysis, Insights and Forecast, 2019-2031
- 7.1. Market Analysis, Insights and Forecast - by Production Analysis
- 7.2. Market Analysis, Insights and Forecast - by Consumption Analysis
- 7.3. Market Analysis, Insights and Forecast - by Import Market Analysis (Value & Volume)
- 7.4. Market Analysis, Insights and Forecast - by Export Market Analysis (Value & Volume)
- 7.5. Market Analysis, Insights and Forecast - by Price Trend Analysis
- 7.1. Market Analysis, Insights and Forecast - by Production Analysis
- 8. Europe Commercial Greenhouse Industry Analysis, Insights and Forecast, 2019-2031
- 8.1. Market Analysis, Insights and Forecast - by Production Analysis
- 8.2. Market Analysis, Insights and Forecast - by Consumption Analysis
- 8.3. Market Analysis, Insights and Forecast - by Import Market Analysis (Value & Volume)
- 8.4. Market Analysis, Insights and Forecast - by Export Market Analysis (Value & Volume)
- 8.5. Market Analysis, Insights and Forecast - by Price Trend Analysis
- 8.1. Market Analysis, Insights and Forecast - by Production Analysis
- 9. Middle East & Africa Commercial Greenhouse Industry Analysis, Insights and Forecast, 2019-2031
- 9.1. Market Analysis, Insights and Forecast - by Production Analysis
- 9.2. Market Analysis, Insights and Forecast - by Consumption Analysis
- 9.3. Market Analysis, Insights and Forecast - by Import Market Analysis (Value & Volume)
- 9.4. Market Analysis, Insights and Forecast - by Export Market Analysis (Value & Volume)
- 9.5. Market Analysis, Insights and Forecast - by Price Trend Analysis
- 9.1. Market Analysis, Insights and Forecast - by Production Analysis
- 10. Asia Pacific Commercial Greenhouse Industry Analysis, Insights and Forecast, 2019-2031
- 10.1. Market Analysis, Insights and Forecast - by Production Analysis
- 10.2. Market Analysis, Insights and Forecast - by Consumption Analysis
- 10.3. Market Analysis, Insights and Forecast - by Import Market Analysis (Value & Volume)
- 10.4. Market Analysis, Insights and Forecast - by Export Market Analysis (Value & Volume)
- 10.5. Market Analysis, Insights and Forecast - by Price Trend Analysis
- 10.1. Market Analysis, Insights and Forecast - by Production Analysis
- 11. North America Commercial Greenhouse Industry Analysis, Insights and Forecast, 2019-2031
- 11.1. Market Analysis, Insights and Forecast - By Country/Sub-region
- 11.1.1 United States
- 11.1.2 Canada
- 11.1.3 Mexico
- 11.1.4 Rest of North America
- 12. Europe Commercial Greenhouse Industry Analysis, Insights and Forecast, 2019-2031
- 12.1. Market Analysis, Insights and Forecast - By Country/Sub-region
- 12.1.1 Germany
- 12.1.2 United Kingdom
- 12.1.3 France
- 12.1.4 Russia
- 12.1.5 Spain
- 12.1.6 Rest of Europe
- 13. Asia Pacific Commercial Greenhouse Industry Analysis, Insights and Forecast, 2019-2031
- 13.1. Market Analysis, Insights and Forecast - By Country/Sub-region
- 13.1.1 China
- 13.1.2 Japan
- 13.1.3 India
- 13.1.4 South Korea
- 13.1.5 Rest of Asia Pacific
- 14. South America Commercial Greenhouse Industry Analysis, Insights and Forecast, 2019-2031
- 14.1. Market Analysis, Insights and Forecast - By Country/Sub-region
- 14.1.1 Brazil
- 14.1.2 Argentina
- 14.1.3 Rest of South America
- 15. Middle East and Africa Commercial Greenhouse Industry Analysis, Insights and Forecast, 2019-2031
- 15.1. Market Analysis, Insights and Forecast - By Country/Sub-region
- 15.1.1 South Africa
- 15.1.2 Egypt
- 15.1.3 Rest of Middle East and Africa
- 16. Competitive Analysis
- 16.1. Global Market Share Analysis 2024
- 16.2. Company Profiles
- 16.2.1 Lumigrow Inc
- 16.2.1.1. Overview
- 16.2.1.2. Products
- 16.2.1.3. SWOT Analysis
- 16.2.1.4. Recent Developments
- 16.2.1.5. Financials (Based on Availability)
- 16.2.2 Certhon
- 16.2.2.1. Overview
- 16.2.2.2. Products
- 16.2.2.3. SWOT Analysis
- 16.2.2.4. Recent Developments
- 16.2.2.5. Financials (Based on Availability)
- 16.2.3 Heliospectra AB
- 16.2.3.1. Overview
- 16.2.3.2. Products
- 16.2.3.3. SWOT Analysis
- 16.2.3.4. Recent Developments
- 16.2.3.5. Financials (Based on Availability)
- 16.2.4 Richel Group
- 16.2.4.1. Overview
- 16.2.4.2. Products
- 16.2.4.3. SWOT Analysis
- 16.2.4.4. Recent Developments
- 16.2.4.5. Financials (Based on Availability)
- 16.2.5 Argus Control Systems Ltd
- 16.2.5.1. Overview
- 16.2.5.2. Products
- 16.2.5.3. SWOT Analysis
- 16.2.5.4. Recent Developments
- 16.2.5.5. Financials (Based on Availability)
- 16.2.6 Agra Tech Inc *List Not Exhaustive
- 16.2.6.1. Overview
- 16.2.6.2. Products
- 16.2.6.3. SWOT Analysis
- 16.2.6.4. Recent Developments
- 16.2.6.5. Financials (Based on Availability)
- 16.2.7 Rough Brothers Inc
- 16.2.7.1. Overview
- 16.2.7.2. Products
- 16.2.7.3. SWOT Analysis
- 16.2.7.4. Recent Developments
- 16.2.7.5. Financials (Based on Availability)
- 16.2.8 Logiqs BV
- 16.2.8.1. Overview
- 16.2.8.2. Products
- 16.2.8.3. SWOT Analysis
- 16.2.8.4. Recent Developments
- 16.2.8.5. Financials (Based on Availability)
- 16.2.9 International Greenhouse Company
- 16.2.9.1. Overview
- 16.2.9.2. Products
- 16.2.9.3. SWOT Analysis
- 16.2.9.4. Recent Developments
- 16.2.9.5. Financials (Based on Availability)
- 16.2.10 Gibraltar Industries (Nexus Corporation)
- 16.2.10.1. Overview
- 16.2.10.2. Products
- 16.2.10.3. SWOT Analysis
- 16.2.10.4. Recent Developments
- 16.2.10.5. Financials (Based on Availability)
- 16.2.1 Lumigrow Inc
List of Figures
- Figure 1: Global Commercial Greenhouse Industry Revenue Breakdown (Million, %) by Region 2024 & 2032
- Figure 2: Global Commercial Greenhouse Industry Volume Breakdown (Kiloton, %) by Region 2024 & 2032
- Figure 3: North America Commercial Greenhouse Industry Revenue (Million), by Country 2024 & 2032
- Figure 4: North America Commercial Greenhouse Industry Volume (Kiloton), by Country 2024 & 2032
- Figure 5: North America Commercial Greenhouse Industry Revenue Share (%), by Country 2024 & 2032
- Figure 6: North America Commercial Greenhouse Industry Volume Share (%), by Country 2024 & 2032
- Figure 7: Europe Commercial Greenhouse Industry Revenue (Million), by Country 2024 & 2032
- Figure 8: Europe Commercial Greenhouse Industry Volume (Kiloton), by Country 2024 & 2032
- Figure 9: Europe Commercial Greenhouse Industry Revenue Share (%), by Country 2024 & 2032
- Figure 10: Europe Commercial Greenhouse Industry Volume Share (%), by Country 2024 & 2032
- Figure 11: Asia Pacific Commercial Greenhouse Industry Revenue (Million), by Country 2024 & 2032
- Figure 12: Asia Pacific Commercial Greenhouse Industry Volume (Kiloton), by Country 2024 & 2032
- Figure 13: Asia Pacific Commercial Greenhouse Industry Revenue Share (%), by Country 2024 & 2032
- Figure 14: Asia Pacific Commercial Greenhouse Industry Volume Share (%), by Country 2024 & 2032
- Figure 15: South America Commercial Greenhouse Industry Revenue (Million), by Country 2024 & 2032
- Figure 16: South America Commercial Greenhouse Industry Volume (Kiloton), by Country 2024 & 2032
- Figure 17: South America Commercial Greenhouse Industry Revenue Share (%), by Country 2024 & 2032
- Figure 18: South America Commercial Greenhouse Industry Volume Share (%), by Country 2024 & 2032
- Figure 19: Middle East and Africa Commercial Greenhouse Industry Revenue (Million), by Country 2024 & 2032
- Figure 20: Middle East and Africa Commercial Greenhouse Industry Volume (Kiloton), by Country 2024 & 2032
- Figure 21: Middle East and Africa Commercial Greenhouse Industry Revenue Share (%), by Country 2024 & 2032
- Figure 22: Middle East and Africa Commercial Greenhouse Industry Volume Share (%), by Country 2024 & 2032
- Figure 23: North America Commercial Greenhouse Industry Revenue (Million), by Production Analysis 2024 & 2032
- Figure 24: North America Commercial Greenhouse Industry Volume (Kiloton), by Production Analysis 2024 & 2032
- Figure 25: North America Commercial Greenhouse Industry Revenue Share (%), by Production Analysis 2024 & 2032
- Figure 26: North America Commercial Greenhouse Industry Volume Share (%), by Production Analysis 2024 & 2032
- Figure 27: North America Commercial Greenhouse Industry Revenue (Million), by Consumption Analysis 2024 & 2032
- Figure 28: North America Commercial Greenhouse Industry Volume (Kiloton), by Consumption Analysis 2024 & 2032
- Figure 29: North America Commercial Greenhouse Industry Revenue Share (%), by Consumption Analysis 2024 & 2032
- Figure 30: North America Commercial Greenhouse Industry Volume Share (%), by Consumption Analysis 2024 & 2032
- Figure 31: North America Commercial Greenhouse Industry Revenue (Million), by Import Market Analysis (Value & Volume) 2024 & 2032
- Figure 32: North America Commercial Greenhouse Industry Volume (Kiloton), by Import Market Analysis (Value & Volume) 2024 & 2032
- Figure 33: North America Commercial Greenhouse Industry Revenue Share (%), by Import Market Analysis (Value & Volume) 2024 & 2032
- Figure 34: North America Commercial Greenhouse Industry Volume Share (%), by Import Market Analysis (Value & Volume) 2024 & 2032
- Figure 35: North America Commercial Greenhouse Industry Revenue (Million), by Export Market Analysis (Value & Volume) 2024 & 2032
- Figure 36: North America Commercial Greenhouse Industry Volume (Kiloton), by Export Market Analysis (Value & Volume) 2024 & 2032
- Figure 37: North America Commercial Greenhouse Industry Revenue Share (%), by Export Market Analysis (Value & Volume) 2024 & 2032
- Figure 38: North America Commercial Greenhouse Industry Volume Share (%), by Export Market Analysis (Value & Volume) 2024 & 2032
- Figure 39: North America Commercial Greenhouse Industry Revenue (Million), by Price Trend Analysis 2024 & 2032
- Figure 40: North America Commercial Greenhouse Industry Volume (Kiloton), by Price Trend Analysis 2024 & 2032
- Figure 41: North America Commercial Greenhouse Industry Revenue Share (%), by Price Trend Analysis 2024 & 2032
- Figure 42: North America Commercial Greenhouse Industry Volume Share (%), by Price Trend Analysis 2024 & 2032
- Figure 43: North America Commercial Greenhouse Industry Revenue (Million), by Country 2024 & 2032
- Figure 44: North America Commercial Greenhouse Industry Volume (Kiloton), by Country 2024 & 2032
- Figure 45: North America Commercial Greenhouse Industry Revenue Share (%), by Country 2024 & 2032
- Figure 46: North America Commercial Greenhouse Industry Volume Share (%), by Country 2024 & 2032
- Figure 47: South America Commercial Greenhouse Industry Revenue (Million), by Production Analysis 2024 & 2032
- Figure 48: South America Commercial Greenhouse Industry Volume (Kiloton), by Production Analysis 2024 & 2032
- Figure 49: South America Commercial Greenhouse Industry Revenue Share (%), by Production Analysis 2024 & 2032
- Figure 50: South America Commercial Greenhouse Industry Volume Share (%), by Production Analysis 2024 & 2032
- Figure 51: South America Commercial Greenhouse Industry Revenue (Million), by Consumption Analysis 2024 & 2032
- Figure 52: South America Commercial Greenhouse Industry Volume (Kiloton), by Consumption Analysis 2024 & 2032
- Figure 53: South America Commercial Greenhouse Industry Revenue Share (%), by Consumption Analysis 2024 & 2032
- Figure 54: South America Commercial Greenhouse Industry Volume Share (%), by Consumption Analysis 2024 & 2032
- Figure 55: South America Commercial Greenhouse Industry Revenue (Million), by Import Market Analysis (Value & Volume) 2024 & 2032
- Figure 56: South America Commercial Greenhouse Industry Volume (Kiloton), by Import Market Analysis (Value & Volume) 2024 & 2032
- Figure 57: South America Commercial Greenhouse Industry Revenue Share (%), by Import Market Analysis (Value & Volume) 2024 & 2032
- Figure 58: South America Commercial Greenhouse Industry Volume Share (%), by Import Market Analysis (Value & Volume) 2024 & 2032
- Figure 59: South America Commercial Greenhouse Industry Revenue (Million), by Export Market Analysis (Value & Volume) 2024 & 2032
- Figure 60: South America Commercial Greenhouse Industry Volume (Kiloton), by Export Market Analysis (Value & Volume) 2024 & 2032
- Figure 61: South America Commercial Greenhouse Industry Revenue Share (%), by Export Market Analysis (Value & Volume) 2024 & 2032
- Figure 62: South America Commercial Greenhouse Industry Volume Share (%), by Export Market Analysis (Value & Volume) 2024 & 2032
- Figure 63: South America Commercial Greenhouse Industry Revenue (Million), by Price Trend Analysis 2024 & 2032
- Figure 64: South America Commercial Greenhouse Industry Volume (Kiloton), by Price Trend Analysis 2024 & 2032
- Figure 65: South America Commercial Greenhouse Industry Revenue Share (%), by Price Trend Analysis 2024 & 2032
- Figure 66: South America Commercial Greenhouse Industry Volume Share (%), by Price Trend Analysis 2024 & 2032
- Figure 67: South America Commercial Greenhouse Industry Revenue (Million), by Country 2024 & 2032
- Figure 68: South America Commercial Greenhouse Industry Volume (Kiloton), by Country 2024 & 2032
- Figure 69: South America Commercial Greenhouse Industry Revenue Share (%), by Country 2024 & 2032
- Figure 70: South America Commercial Greenhouse Industry Volume Share (%), by Country 2024 & 2032
- Figure 71: Europe Commercial Greenhouse Industry Revenue (Million), by Production Analysis 2024 & 2032
- Figure 72: Europe Commercial Greenhouse Industry Volume (Kiloton), by Production Analysis 2024 & 2032
- Figure 73: Europe Commercial Greenhouse Industry Revenue Share (%), by Production Analysis 2024 & 2032
- Figure 74: Europe Commercial Greenhouse Industry Volume Share (%), by Production Analysis 2024 & 2032
- Figure 75: Europe Commercial Greenhouse Industry Revenue (Million), by Consumption Analysis 2024 & 2032
- Figure 76: Europe Commercial Greenhouse Industry Volume (Kiloton), by Consumption Analysis 2024 & 2032
- Figure 77: Europe Commercial Greenhouse Industry Revenue Share (%), by Consumption Analysis 2024 & 2032
- Figure 78: Europe Commercial Greenhouse Industry Volume Share (%), by Consumption Analysis 2024 & 2032
- Figure 79: Europe Commercial Greenhouse Industry Revenue (Million), by Import Market Analysis (Value & Volume) 2024 & 2032
- Figure 80: Europe Commercial Greenhouse Industry Volume (Kiloton), by Import Market Analysis (Value & Volume) 2024 & 2032
- Figure 81: Europe Commercial Greenhouse Industry Revenue Share (%), by Import Market Analysis (Value & Volume) 2024 & 2032
- Figure 82: Europe Commercial Greenhouse Industry Volume Share (%), by Import Market Analysis (Value & Volume) 2024 & 2032
- Figure 83: Europe Commercial Greenhouse Industry Revenue (Million), by Export Market Analysis (Value & Volume) 2024 & 2032
- Figure 84: Europe Commercial Greenhouse Industry Volume (Kiloton), by Export Market Analysis (Value & Volume) 2024 & 2032
- Figure 85: Europe Commercial Greenhouse Industry Revenue Share (%), by Export Market Analysis (Value & Volume) 2024 & 2032
- Figure 86: Europe Commercial Greenhouse Industry Volume Share (%), by Export Market Analysis (Value & Volume) 2024 & 2032
- Figure 87: Europe Commercial Greenhouse Industry Revenue (Million), by Price Trend Analysis 2024 & 2032
- Figure 88: Europe Commercial Greenhouse Industry Volume (Kiloton), by Price Trend Analysis 2024 & 2032
- Figure 89: Europe Commercial Greenhouse Industry Revenue Share (%), by Price Trend Analysis 2024 & 2032
- Figure 90: Europe Commercial Greenhouse Industry Volume Share (%), by Price Trend Analysis 2024 & 2032
- Figure 91: Europe Commercial Greenhouse Industry Revenue (Million), by Country 2024 & 2032
- Figure 92: Europe Commercial Greenhouse Industry Volume (Kiloton), by Country 2024 & 2032
- Figure 93: Europe Commercial Greenhouse Industry Revenue Share (%), by Country 2024 & 2032
- Figure 94: Europe Commercial Greenhouse Industry Volume Share (%), by Country 2024 & 2032
- Figure 95: Middle East & Africa Commercial Greenhouse Industry Revenue (Million), by Production Analysis 2024 & 2032
- Figure 96: Middle East & Africa Commercial Greenhouse Industry Volume (Kiloton), by Production Analysis 2024 & 2032
- Figure 97: Middle East & Africa Commercial Greenhouse Industry Revenue Share (%), by Production Analysis 2024 & 2032
- Figure 98: Middle East & Africa Commercial Greenhouse Industry Volume Share (%), by Production Analysis 2024 & 2032
- Figure 99: Middle East & Africa Commercial Greenhouse Industry Revenue (Million), by Consumption Analysis 2024 & 2032
- Figure 100: Middle East & Africa Commercial Greenhouse Industry Volume (Kiloton), by Consumption Analysis 2024 & 2032
- Figure 101: Middle East & Africa Commercial Greenhouse Industry Revenue Share (%), by Consumption Analysis 2024 & 2032
- Figure 102: Middle East & Africa Commercial Greenhouse Industry Volume Share (%), by Consumption Analysis 2024 & 2032
- Figure 103: Middle East & Africa Commercial Greenhouse Industry Revenue (Million), by Import Market Analysis (Value & Volume) 2024 & 2032
- Figure 104: Middle East & Africa Commercial Greenhouse Industry Volume (Kiloton), by Import Market Analysis (Value & Volume) 2024 & 2032
- Figure 105: Middle East & Africa Commercial Greenhouse Industry Revenue Share (%), by Import Market Analysis (Value & Volume) 2024 & 2032
- Figure 106: Middle East & Africa Commercial Greenhouse Industry Volume Share (%), by Import Market Analysis (Value & Volume) 2024 & 2032
- Figure 107: Middle East & Africa Commercial Greenhouse Industry Revenue (Million), by Export Market Analysis (Value & Volume) 2024 & 2032
- Figure 108: Middle East & Africa Commercial Greenhouse Industry Volume (Kiloton), by Export Market Analysis (Value & Volume) 2024 & 2032
- Figure 109: Middle East & Africa Commercial Greenhouse Industry Revenue Share (%), by Export Market Analysis (Value & Volume) 2024 & 2032
- Figure 110: Middle East & Africa Commercial Greenhouse Industry Volume Share (%), by Export Market Analysis (Value & Volume) 2024 & 2032
- Figure 111: Middle East & Africa Commercial Greenhouse Industry Revenue (Million), by Price Trend Analysis 2024 & 2032
- Figure 112: Middle East & Africa Commercial Greenhouse Industry Volume (Kiloton), by Price Trend Analysis 2024 & 2032
- Figure 113: Middle East & Africa Commercial Greenhouse Industry Revenue Share (%), by Price Trend Analysis 2024 & 2032
- Figure 114: Middle East & Africa Commercial Greenhouse Industry Volume Share (%), by Price Trend Analysis 2024 & 2032
- Figure 115: Middle East & Africa Commercial Greenhouse Industry Revenue (Million), by Country 2024 & 2032
- Figure 116: Middle East & Africa Commercial Greenhouse Industry Volume (Kiloton), by Country 2024 & 2032
- Figure 117: Middle East & Africa Commercial Greenhouse Industry Revenue Share (%), by Country 2024 & 2032
- Figure 118: Middle East & Africa Commercial Greenhouse Industry Volume Share (%), by Country 2024 & 2032
- Figure 119: Asia Pacific Commercial Greenhouse Industry Revenue (Million), by Production Analysis 2024 & 2032
- Figure 120: Asia Pacific Commercial Greenhouse Industry Volume (Kiloton), by Production Analysis 2024 & 2032
- Figure 121: Asia Pacific Commercial Greenhouse Industry Revenue Share (%), by Production Analysis 2024 & 2032
- Figure 122: Asia Pacific Commercial Greenhouse Industry Volume Share (%), by Production Analysis 2024 & 2032
- Figure 123: Asia Pacific Commercial Greenhouse Industry Revenue (Million), by Consumption Analysis 2024 & 2032
- Figure 124: Asia Pacific Commercial Greenhouse Industry Volume (Kiloton), by Consumption Analysis 2024 & 2032
- Figure 125: Asia Pacific Commercial Greenhouse Industry Revenue Share (%), by Consumption Analysis 2024 & 2032
- Figure 126: Asia Pacific Commercial Greenhouse Industry Volume Share (%), by Consumption Analysis 2024 & 2032
- Figure 127: Asia Pacific Commercial Greenhouse Industry Revenue (Million), by Import Market Analysis (Value & Volume) 2024 & 2032
- Figure 128: Asia Pacific Commercial Greenhouse Industry Volume (Kiloton), by Import Market Analysis (Value & Volume) 2024 & 2032
- Figure 129: Asia Pacific Commercial Greenhouse Industry Revenue Share (%), by Import Market Analysis (Value & Volume) 2024 & 2032
- Figure 130: Asia Pacific Commercial Greenhouse Industry Volume Share (%), by Import Market Analysis (Value & Volume) 2024 & 2032
- Figure 131: Asia Pacific Commercial Greenhouse Industry Revenue (Million), by Export Market Analysis (Value & Volume) 2024 & 2032
- Figure 132: Asia Pacific Commercial Greenhouse Industry Volume (Kiloton), by Export Market Analysis (Value & Volume) 2024 & 2032
- Figure 133: Asia Pacific Commercial Greenhouse Industry Revenue Share (%), by Export Market Analysis (Value & Volume) 2024 & 2032
- Figure 134: Asia Pacific Commercial Greenhouse Industry Volume Share (%), by Export Market Analysis (Value & Volume) 2024 & 2032
- Figure 135: Asia Pacific Commercial Greenhouse Industry Revenue (Million), by Price Trend Analysis 2024 & 2032
- Figure 136: Asia Pacific Commercial Greenhouse Industry Volume (Kiloton), by Price Trend Analysis 2024 & 2032
- Figure 137: Asia Pacific Commercial Greenhouse Industry Revenue Share (%), by Price Trend Analysis 2024 & 2032
- Figure 138: Asia Pacific Commercial Greenhouse Industry Volume Share (%), by Price Trend Analysis 2024 & 2032
- Figure 139: Asia Pacific Commercial Greenhouse Industry Revenue (Million), by Country 2024 & 2032
- Figure 140: Asia Pacific Commercial Greenhouse Industry Volume (Kiloton), by Country 2024 & 2032
- Figure 141: Asia Pacific Commercial Greenhouse Industry Revenue Share (%), by Country 2024 & 2032
- Figure 142: Asia Pacific Commercial Greenhouse Industry Volume Share (%), by Country 2024 & 2032
List of Tables
- Table 1: Global Commercial Greenhouse Industry Revenue Million Forecast, by Region 2019 & 2032
- Table 2: Global Commercial Greenhouse Industry Volume Kiloton Forecast, by Region 2019 & 2032
- Table 3: Global Commercial Greenhouse Industry Revenue Million Forecast, by Production Analysis 2019 & 2032
- Table 4: Global Commercial Greenhouse Industry Volume Kiloton Forecast, by Production Analysis 2019 & 2032
- Table 5: Global Commercial Greenhouse Industry Revenue Million Forecast, by Consumption Analysis 2019 & 2032
- Table 6: Global Commercial Greenhouse Industry Volume Kiloton Forecast, by Consumption Analysis 2019 & 2032
- Table 7: Global Commercial Greenhouse Industry Revenue Million Forecast, by Import Market Analysis (Value & Volume) 2019 & 2032
- Table 8: Global Commercial Greenhouse Industry Volume Kiloton Forecast, by Import Market Analysis (Value & Volume) 2019 & 2032
- Table 9: Global Commercial Greenhouse Industry Revenue Million Forecast, by Export Market Analysis (Value & Volume) 2019 & 2032
- Table 10: Global Commercial Greenhouse Industry Volume Kiloton Forecast, by Export Market Analysis (Value & Volume) 2019 & 2032
- Table 11: Global Commercial Greenhouse Industry Revenue Million Forecast, by Price Trend Analysis 2019 & 2032
- Table 12: Global Commercial Greenhouse Industry Volume Kiloton Forecast, by Price Trend Analysis 2019 & 2032
- Table 13: Global Commercial Greenhouse Industry Revenue Million Forecast, by Region 2019 & 2032
- Table 14: Global Commercial Greenhouse Industry Volume Kiloton Forecast, by Region 2019 & 2032
- Table 15: Global Commercial Greenhouse Industry Revenue Million Forecast, by Country 2019 & 2032
- Table 16: Global Commercial Greenhouse Industry Volume Kiloton Forecast, by Country 2019 & 2032
- Table 17: United States Commercial Greenhouse Industry Revenue (Million) Forecast, by Application 2019 & 2032
- Table 18: United States Commercial Greenhouse Industry Volume (Kiloton) Forecast, by Application 2019 & 2032
- Table 19: Canada Commercial Greenhouse Industry Revenue (Million) Forecast, by Application 2019 & 2032
- Table 20: Canada Commercial Greenhouse Industry Volume (Kiloton) Forecast, by Application 2019 & 2032
- Table 21: Mexico Commercial Greenhouse Industry Revenue (Million) Forecast, by Application 2019 & 2032
- Table 22: Mexico Commercial Greenhouse Industry Volume (Kiloton) Forecast, by Application 2019 & 2032
- Table 23: Rest of North America Commercial Greenhouse Industry Revenue (Million) Forecast, by Application 2019 & 2032
- Table 24: Rest of North America Commercial Greenhouse Industry Volume (Kiloton) Forecast, by Application 2019 & 2032
- Table 25: Global Commercial Greenhouse Industry Revenue Million Forecast, by Country 2019 & 2032
- Table 26: Global Commercial Greenhouse Industry Volume Kiloton Forecast, by Country 2019 & 2032
- Table 27: Germany Commercial Greenhouse Industry Revenue (Million) Forecast, by Application 2019 & 2032
- Table 28: Germany Commercial Greenhouse Industry Volume (Kiloton) Forecast, by Application 2019 & 2032
- Table 29: United Kingdom Commercial Greenhouse Industry Revenue (Million) Forecast, by Application 2019 & 2032
- Table 30: United Kingdom Commercial Greenhouse Industry Volume (Kiloton) Forecast, by Application 2019 & 2032
- Table 31: France Commercial Greenhouse Industry Revenue (Million) Forecast, by Application 2019 & 2032
- Table 32: France Commercial Greenhouse Industry Volume (Kiloton) Forecast, by Application 2019 & 2032
- Table 33: Russia Commercial Greenhouse Industry Revenue (Million) Forecast, by Application 2019 & 2032
- Table 34: Russia Commercial Greenhouse Industry Volume (Kiloton) Forecast, by Application 2019 & 2032
- Table 35: Spain Commercial Greenhouse Industry Revenue (Million) Forecast, by Application 2019 & 2032
- Table 36: Spain Commercial Greenhouse Industry Volume (Kiloton) Forecast, by Application 2019 & 2032
- Table 37: Rest of Europe Commercial Greenhouse Industry Revenue (Million) Forecast, by Application 2019 & 2032
- Table 38: Rest of Europe Commercial Greenhouse Industry Volume (Kiloton) Forecast, by Application 2019 & 2032
- Table 39: Global Commercial Greenhouse Industry Revenue Million Forecast, by Country 2019 & 2032
- Table 40: Global Commercial Greenhouse Industry Volume Kiloton Forecast, by Country 2019 & 2032
- Table 41: China Commercial Greenhouse Industry Revenue (Million) Forecast, by Application 2019 & 2032
- Table 42: China Commercial Greenhouse Industry Volume (Kiloton) Forecast, by Application 2019 & 2032
- Table 43: Japan Commercial Greenhouse Industry Revenue (Million) Forecast, by Application 2019 & 2032
- Table 44: Japan Commercial Greenhouse Industry Volume (Kiloton) Forecast, by Application 2019 & 2032
- Table 45: India Commercial Greenhouse Industry Revenue (Million) Forecast, by Application 2019 & 2032
- Table 46: India Commercial Greenhouse Industry Volume (Kiloton) Forecast, by Application 2019 & 2032
- Table 47: South Korea Commercial Greenhouse Industry Revenue (Million) Forecast, by Application 2019 & 2032
- Table 48: South Korea Commercial Greenhouse Industry Volume (Kiloton) Forecast, by Application 2019 & 2032
- Table 49: Rest of Asia Pacific Commercial Greenhouse Industry Revenue (Million) Forecast, by Application 2019 & 2032
- Table 50: Rest of Asia Pacific Commercial Greenhouse Industry Volume (Kiloton) Forecast, by Application 2019 & 2032
- Table 51: Global Commercial Greenhouse Industry Revenue Million Forecast, by Country 2019 & 2032
- Table 52: Global Commercial Greenhouse Industry Volume Kiloton Forecast, by Country 2019 & 2032
- Table 53: Brazil Commercial Greenhouse Industry Revenue (Million) Forecast, by Application 2019 & 2032
- Table 54: Brazil Commercial Greenhouse Industry Volume (Kiloton) Forecast, by Application 2019 & 2032
- Table 55: Argentina Commercial Greenhouse Industry Revenue (Million) Forecast, by Application 2019 & 2032
- Table 56: Argentina Commercial Greenhouse Industry Volume (Kiloton) Forecast, by Application 2019 & 2032
- Table 57: Rest of South America Commercial Greenhouse Industry Revenue (Million) Forecast, by Application 2019 & 2032
- Table 58: Rest of South America Commercial Greenhouse Industry Volume (Kiloton) Forecast, by Application 2019 & 2032
- Table 59: Global Commercial Greenhouse Industry Revenue Million Forecast, by Country 2019 & 2032
- Table 60: Global Commercial Greenhouse Industry Volume Kiloton Forecast, by Country 2019 & 2032
- Table 61: South Africa Commercial Greenhouse Industry Revenue (Million) Forecast, by Application 2019 & 2032
- Table 62: South Africa Commercial Greenhouse Industry Volume (Kiloton) Forecast, by Application 2019 & 2032
- Table 63: Egypt Commercial Greenhouse Industry Revenue (Million) Forecast, by Application 2019 & 2032
- Table 64: Egypt Commercial Greenhouse Industry Volume (Kiloton) Forecast, by Application 2019 & 2032
- Table 65: Rest of Middle East and Africa Commercial Greenhouse Industry Revenue (Million) Forecast, by Application 2019 & 2032
- Table 66: Rest of Middle East and Africa Commercial Greenhouse Industry Volume (Kiloton) Forecast, by Application 2019 & 2032
- Table 67: Global Commercial Greenhouse Industry Revenue Million Forecast, by Production Analysis 2019 & 2032
- Table 68: Global Commercial Greenhouse Industry Volume Kiloton Forecast, by Production Analysis 2019 & 2032
- Table 69: Global Commercial Greenhouse Industry Revenue Million Forecast, by Consumption Analysis 2019 & 2032
- Table 70: Global Commercial Greenhouse Industry Volume Kiloton Forecast, by Consumption Analysis 2019 & 2032
- Table 71: Global Commercial Greenhouse Industry Revenue Million Forecast, by Import Market Analysis (Value & Volume) 2019 & 2032
- Table 72: Global Commercial Greenhouse Industry Volume Kiloton Forecast, by Import Market Analysis (Value & Volume) 2019 & 2032
- Table 73: Global Commercial Greenhouse Industry Revenue Million Forecast, by Export Market Analysis (Value & Volume) 2019 & 2032
- Table 74: Global Commercial Greenhouse Industry Volume Kiloton Forecast, by Export Market Analysis (Value & Volume) 2019 & 2032
- Table 75: Global Commercial Greenhouse Industry Revenue Million Forecast, by Price Trend Analysis 2019 & 2032
- Table 76: Global Commercial Greenhouse Industry Volume Kiloton Forecast, by Price Trend Analysis 2019 & 2032
- Table 77: Global Commercial Greenhouse Industry Revenue Million Forecast, by Country 2019 & 2032
- Table 78: Global Commercial Greenhouse Industry Volume Kiloton Forecast, by Country 2019 & 2032
- Table 79: United States Commercial Greenhouse Industry Revenue (Million) Forecast, by Application 2019 & 2032
- Table 80: United States Commercial Greenhouse Industry Volume (Kiloton) Forecast, by Application 2019 & 2032
- Table 81: Canada Commercial Greenhouse Industry Revenue (Million) Forecast, by Application 2019 & 2032
- Table 82: Canada Commercial Greenhouse Industry Volume (Kiloton) Forecast, by Application 2019 & 2032
- Table 83: Mexico Commercial Greenhouse Industry Revenue (Million) Forecast, by Application 2019 & 2032
- Table 84: Mexico Commercial Greenhouse Industry Volume (Kiloton) Forecast, by Application 2019 & 2032
- Table 85: Global Commercial Greenhouse Industry Revenue Million Forecast, by Production Analysis 2019 & 2032
- Table 86: Global Commercial Greenhouse Industry Volume Kiloton Forecast, by Production Analysis 2019 & 2032
- Table 87: Global Commercial Greenhouse Industry Revenue Million Forecast, by Consumption Analysis 2019 & 2032
- Table 88: Global Commercial Greenhouse Industry Volume Kiloton Forecast, by Consumption Analysis 2019 & 2032
- Table 89: Global Commercial Greenhouse Industry Revenue Million Forecast, by Import Market Analysis (Value & Volume) 2019 & 2032
- Table 90: Global Commercial Greenhouse Industry Volume Kiloton Forecast, by Import Market Analysis (Value & Volume) 2019 & 2032
- Table 91: Global Commercial Greenhouse Industry Revenue Million Forecast, by Export Market Analysis (Value & Volume) 2019 & 2032
- Table 92: Global Commercial Greenhouse Industry Volume Kiloton Forecast, by Export Market Analysis (Value & Volume) 2019 & 2032
- Table 93: Global Commercial Greenhouse Industry Revenue Million Forecast, by Price Trend Analysis 2019 & 2032
- Table 94: Global Commercial Greenhouse Industry Volume Kiloton Forecast, by Price Trend Analysis 2019 & 2032
- Table 95: Global Commercial Greenhouse Industry Revenue Million Forecast, by Country 2019 & 2032
- Table 96: Global Commercial Greenhouse Industry Volume Kiloton Forecast, by Country 2019 & 2032
- Table 97: Brazil Commercial Greenhouse Industry Revenue (Million) Forecast, by Application 2019 & 2032
- Table 98: Brazil Commercial Greenhouse Industry Volume (Kiloton) Forecast, by Application 2019 & 2032
- Table 99: Argentina Commercial Greenhouse Industry Revenue (Million) Forecast, by Application 2019 & 2032
- Table 100: Argentina Commercial Greenhouse Industry Volume (Kiloton) Forecast, by Application 2019 & 2032
- Table 101: Rest of South America Commercial Greenhouse Industry Revenue (Million) Forecast, by Application 2019 & 2032
- Table 102: Rest of South America Commercial Greenhouse Industry Volume (Kiloton) Forecast, by Application 2019 & 2032
- Table 103: Global Commercial Greenhouse Industry Revenue Million Forecast, by Production Analysis 2019 & 2032
- Table 104: Global Commercial Greenhouse Industry Volume Kiloton Forecast, by Production Analysis 2019 & 2032
- Table 105: Global Commercial Greenhouse Industry Revenue Million Forecast, by Consumption Analysis 2019 & 2032
- Table 106: Global Commercial Greenhouse Industry Volume Kiloton Forecast, by Consumption Analysis 2019 & 2032
- Table 107: Global Commercial Greenhouse Industry Revenue Million Forecast, by Import Market Analysis (Value & Volume) 2019 & 2032
- Table 108: Global Commercial Greenhouse Industry Volume Kiloton Forecast, by Import Market Analysis (Value & Volume) 2019 & 2032
- Table 109: Global Commercial Greenhouse Industry Revenue Million Forecast, by Export Market Analysis (Value & Volume) 2019 & 2032
- Table 110: Global Commercial Greenhouse Industry Volume Kiloton Forecast, by Export Market Analysis (Value & Volume) 2019 & 2032
- Table 111: Global Commercial Greenhouse Industry Revenue Million Forecast, by Price Trend Analysis 2019 & 2032
- Table 112: Global Commercial Greenhouse Industry Volume Kiloton Forecast, by Price Trend Analysis 2019 & 2032
- Table 113: Global Commercial Greenhouse Industry Revenue Million Forecast, by Country 2019 & 2032
- Table 114: Global Commercial Greenhouse Industry Volume Kiloton Forecast, by Country 2019 & 2032
- Table 115: United Kingdom Commercial Greenhouse Industry Revenue (Million) Forecast, by Application 2019 & 2032
- Table 116: United Kingdom Commercial Greenhouse Industry Volume (Kiloton) Forecast, by Application 2019 & 2032
- Table 117: Germany Commercial Greenhouse Industry Revenue (Million) Forecast, by Application 2019 & 2032
- Table 118: Germany Commercial Greenhouse Industry Volume (Kiloton) Forecast, by Application 2019 & 2032
- Table 119: France Commercial Greenhouse Industry Revenue (Million) Forecast, by Application 2019 & 2032
- Table 120: France Commercial Greenhouse Industry Volume (Kiloton) Forecast, by Application 2019 & 2032
- Table 121: Italy Commercial Greenhouse Industry Revenue (Million) Forecast, by Application 2019 & 2032
- Table 122: Italy Commercial Greenhouse Industry Volume (Kiloton) Forecast, by Application 2019 & 2032
- Table 123: Spain Commercial Greenhouse Industry Revenue (Million) Forecast, by Application 2019 & 2032
- Table 124: Spain Commercial Greenhouse Industry Volume (Kiloton) Forecast, by Application 2019 & 2032
- Table 125: Russia Commercial Greenhouse Industry Revenue (Million) Forecast, by Application 2019 & 2032
- Table 126: Russia Commercial Greenhouse Industry Volume (Kiloton) Forecast, by Application 2019 & 2032
- Table 127: Benelux Commercial Greenhouse Industry Revenue (Million) Forecast, by Application 2019 & 2032
- Table 128: Benelux Commercial Greenhouse Industry Volume (Kiloton) Forecast, by Application 2019 & 2032
- Table 129: Nordics Commercial Greenhouse Industry Revenue (Million) Forecast, by Application 2019 & 2032
- Table 130: Nordics Commercial Greenhouse Industry Volume (Kiloton) Forecast, by Application 2019 & 2032
- Table 131: Rest of Europe Commercial Greenhouse Industry Revenue (Million) Forecast, by Application 2019 & 2032
- Table 132: Rest of Europe Commercial Greenhouse Industry Volume (Kiloton) Forecast, by Application 2019 & 2032
- Table 133: Global Commercial Greenhouse Industry Revenue Million Forecast, by Production Analysis 2019 & 2032
- Table 134: Global Commercial Greenhouse Industry Volume Kiloton Forecast, by Production Analysis 2019 & 2032
- Table 135: Global Commercial Greenhouse Industry Revenue Million Forecast, by Consumption Analysis 2019 & 2032
- Table 136: Global Commercial Greenhouse Industry Volume Kiloton Forecast, by Consumption Analysis 2019 & 2032
- Table 137: Global Commercial Greenhouse Industry Revenue Million Forecast, by Import Market Analysis (Value & Volume) 2019 & 2032
- Table 138: Global Commercial Greenhouse Industry Volume Kiloton Forecast, by Import Market Analysis (Value & Volume) 2019 & 2032
- Table 139: Global Commercial Greenhouse Industry Revenue Million Forecast, by Export Market Analysis (Value & Volume) 2019 & 2032
- Table 140: Global Commercial Greenhouse Industry Volume Kiloton Forecast, by Export Market Analysis (Value & Volume) 2019 & 2032
- Table 141: Global Commercial Greenhouse Industry Revenue Million Forecast, by Price Trend Analysis 2019 & 2032
- Table 142: Global Commercial Greenhouse Industry Volume Kiloton Forecast, by Price Trend Analysis 2019 & 2032
- Table 143: Global Commercial Greenhouse Industry Revenue Million Forecast, by Country 2019 & 2032
- Table 144: Global Commercial Greenhouse Industry Volume Kiloton Forecast, by Country 2019 & 2032
- Table 145: Turkey Commercial Greenhouse Industry Revenue (Million) Forecast, by Application 2019 & 2032
- Table 146: Turkey Commercial Greenhouse Industry Volume (Kiloton) Forecast, by Application 2019 & 2032
- Table 147: Israel Commercial Greenhouse Industry Revenue (Million) Forecast, by Application 2019 & 2032
- Table 148: Israel Commercial Greenhouse Industry Volume (Kiloton) Forecast, by Application 2019 & 2032
- Table 149: GCC Commercial Greenhouse Industry Revenue (Million) Forecast, by Application 2019 & 2032
- Table 150: GCC Commercial Greenhouse Industry Volume (Kiloton) Forecast, by Application 2019 & 2032
- Table 151: North Africa Commercial Greenhouse Industry Revenue (Million) Forecast, by Application 2019 & 2032
- Table 152: North Africa Commercial Greenhouse Industry Volume (Kiloton) Forecast, by Application 2019 & 2032
- Table 153: South Africa Commercial Greenhouse Industry Revenue (Million) Forecast, by Application 2019 & 2032
- Table 154: South Africa Commercial Greenhouse Industry Volume (Kiloton) Forecast, by Application 2019 & 2032
- Table 155: Rest of Middle East & Africa Commercial Greenhouse Industry Revenue (Million) Forecast, by Application 2019 & 2032
- Table 156: Rest of Middle East & Africa Commercial Greenhouse Industry Volume (Kiloton) Forecast, by Application 2019 & 2032
- Table 157: Global Commercial Greenhouse Industry Revenue Million Forecast, by Production Analysis 2019 & 2032
- Table 158: Global Commercial Greenhouse Industry Volume Kiloton Forecast, by Production Analysis 2019 & 2032
- Table 159: Global Commercial Greenhouse Industry Revenue Million Forecast, by Consumption Analysis 2019 & 2032
- Table 160: Global Commercial Greenhouse Industry Volume Kiloton Forecast, by Consumption Analysis 2019 & 2032
- Table 161: Global Commercial Greenhouse Industry Revenue Million Forecast, by Import Market Analysis (Value & Volume) 2019 & 2032
- Table 162: Global Commercial Greenhouse Industry Volume Kiloton Forecast, by Import Market Analysis (Value & Volume) 2019 & 2032
- Table 163: Global Commercial Greenhouse Industry Revenue Million Forecast, by Export Market Analysis (Value & Volume) 2019 & 2032
- Table 164: Global Commercial Greenhouse Industry Volume Kiloton Forecast, by Export Market Analysis (Value & Volume) 2019 & 2032
- Table 165: Global Commercial Greenhouse Industry Revenue Million Forecast, by Price Trend Analysis 2019 & 2032
- Table 166: Global Commercial Greenhouse Industry Volume Kiloton Forecast, by Price Trend Analysis 2019 & 2032
- Table 167: Global Commercial Greenhouse Industry Revenue Million Forecast, by Country 2019 & 2032
- Table 168: Global Commercial Greenhouse Industry Volume Kiloton Forecast, by Country 2019 & 2032
- Table 169: China Commercial Greenhouse Industry Revenue (Million) Forecast, by Application 2019 & 2032
- Table 170: China Commercial Greenhouse Industry Volume (Kiloton) Forecast, by Application 2019 & 2032
- Table 171: India Commercial Greenhouse Industry Revenue (Million) Forecast, by Application 2019 & 2032
- Table 172: India Commercial Greenhouse Industry Volume (Kiloton) Forecast, by Application 2019 & 2032
- Table 173: Japan Commercial Greenhouse Industry Revenue (Million) Forecast, by Application 2019 & 2032
- Table 174: Japan Commercial Greenhouse Industry Volume (Kiloton) Forecast, by Application 2019 & 2032
- Table 175: South Korea Commercial Greenhouse Industry Revenue (Million) Forecast, by Application 2019 & 2032
- Table 176: South Korea Commercial Greenhouse Industry Volume (Kiloton) Forecast, by Application 2019 & 2032
- Table 177: ASEAN Commercial Greenhouse Industry Revenue (Million) Forecast, by Application 2019 & 2032
- Table 178: ASEAN Commercial Greenhouse Industry Volume (Kiloton) Forecast, by Application 2019 & 2032
- Table 179: Oceania Commercial Greenhouse Industry Revenue (Million) Forecast, by Application 2019 & 2032
- Table 180: Oceania Commercial Greenhouse Industry Volume (Kiloton) Forecast, by Application 2019 & 2032
- Table 181: Rest of Asia Pacific Commercial Greenhouse Industry Revenue (Million) Forecast, by Application 2019 & 2032
- Table 182: Rest of Asia Pacific Commercial Greenhouse Industry Volume (Kiloton) Forecast, by Application 2019 & 2032
Frequently Asked Questions
1. What is the projected Compound Annual Growth Rate (CAGR) of the Commercial Greenhouse Industry?
The projected CAGR is approximately 7.00%.
2. Which companies are prominent players in the Commercial Greenhouse Industry?
Key companies in the market include Lumigrow Inc, Certhon, Heliospectra AB, Richel Group, Argus Control Systems Ltd, Agra Tech Inc *List Not Exhaustive, Rough Brothers Inc, Logiqs BV, International Greenhouse Company, Gibraltar Industries (Nexus Corporation).
3. What are the main segments of the Commercial Greenhouse Industry?
The market segments include Production Analysis, Consumption Analysis, Import Market Analysis (Value & Volume), Export Market Analysis (Value & Volume), Price Trend Analysis.
4. Can you provide details about the market size?
The market size is estimated to be USD 47.76 Million as of 2022.
5. What are some drivers contributing to market growth?
Decreasing Per Capita Arable Land; Increased Demand for Food.
6. What are the notable trends driving market growth?
Horticultural Crops Are In High Demand.
7. Are there any restraints impacting market growth?
High Initial Investments; Requirement of Precision Agriculture.
8. Can you provide examples of recent developments in the market?
September 2023: Richel Group has been in a three-year, exclusive strategic partnership to increase its efficiency in designing, manufacturing, and building high-tech greenhouses in challenging climates and distant regions, including the Middle East and Asia.
9. What pricing options are available for accessing the report?
Pricing options include single-user, multi-user, and enterprise licenses priced at USD 4750, USD 5250, and USD 8750 respectively.
10. Is the market size provided in terms of value or volume?
The market size is provided in terms of value, measured in Million and volume, measured in Kiloton.
11. Are there any specific market keywords associated with the report?
Yes, the market keyword associated with the report is "Commercial Greenhouse Industry," which aids in identifying and referencing the specific market segment covered.
12. How do I determine which pricing option suits my needs best?
The pricing options vary based on user requirements and access needs. Individual users may opt for single-user licenses, while businesses requiring broader access may choose multi-user or enterprise licenses for cost-effective access to the report.
13. Are there any additional resources or data provided in the Commercial Greenhouse Industry report?
While the report offers comprehensive insights, it's advisable to review the specific contents or supplementary materials provided to ascertain if additional resources or data are available.
14. How can I stay updated on further developments or reports in the Commercial Greenhouse Industry?
To stay informed about further developments, trends, and reports in the Commercial Greenhouse Industry, consider subscribing to industry newsletters, following relevant companies and organizations, or regularly checking reputable industry news sources and publications.
Methodology
Step 1 - Identification of Relevant Samples Size from Population Database


Step 2 - Approaches for Defining Global Market Size (Value, Volume* & Price*)

Note*: In applicable scenarios
Step 3 - Data Sources
Primary Research
- Web Analytics
- Survey Reports
- Research Institute
- Latest Research Reports
- Opinion Leaders
Secondary Research
- Annual Reports
- White Paper
- Latest Press Release
- Industry Association
- Paid Database
- Investor Presentations

Step 4 - Data Triangulation
Involves using different sources of information in order to increase the validity of a study
These sources are likely to be stakeholders in a program - participants, other researchers, program staff, other community members, and so on.
Then we put all data in single framework & apply various statistical tools to find out the dynamic on the market.
During the analysis stage, feedback from the stakeholder groups would be compared to determine areas of agreement as well as areas of divergence


