

Key Insights
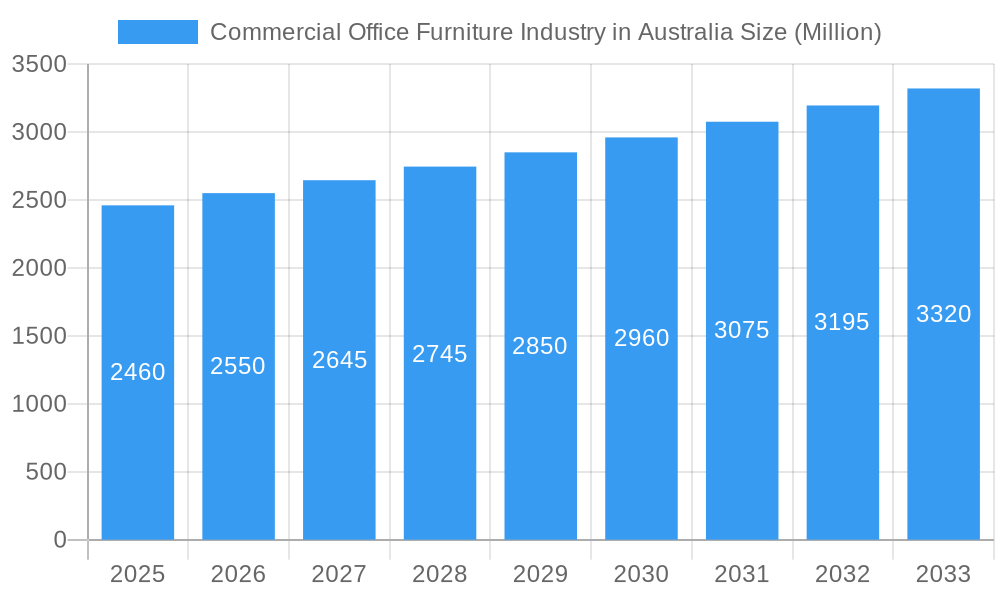
The Australian commercial office furniture market, valued at $2.46 billion in 2025, is projected to experience steady growth, exhibiting a compound annual growth rate (CAGR) of 3.54% from 2025 to 2033. This expansion is driven by several key factors. The increasing number of startups and established businesses necessitate modern and functional office spaces, fueling demand for ergonomic seating, efficient storage solutions, and aesthetically pleasing furniture. Furthermore, a growing emphasis on employee well-being and productivity is pushing companies to invest in high-quality furniture designed to enhance comfort and efficiency. The shift towards hybrid work models also plays a significant role, as companies seek to optimize their office layouts to accommodate both in-office and remote workers. This requires adaptable furniture solutions and ergonomic designs to support diverse work styles. While the market faces potential restraints like fluctuating raw material prices and global economic uncertainty, the overall positive trend is expected to continue, propelled by ongoing urbanization and a focus on creating productive and employee-centric work environments. The market is segmented by material (wood, metal, plastic, others), product type (seating, storage, tables, others), and distribution channel (offline, online). Key players like Advanta, Krost Business Furniture, and Alpha Office Furniture are actively shaping the market landscape through innovation and strategic partnerships.
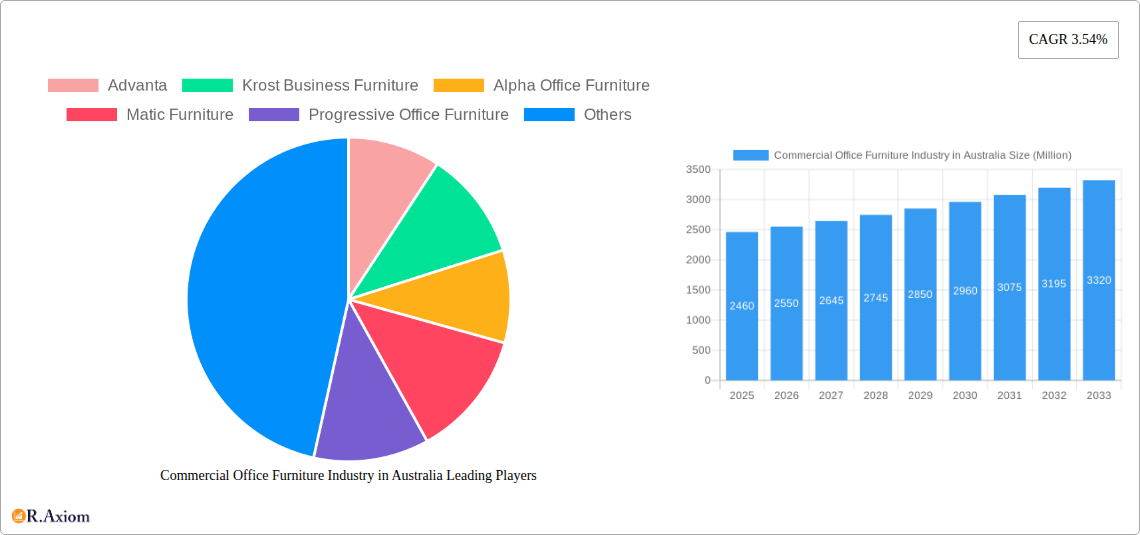
Commercial Office Furniture Industry in Australia Market Size (In Billion)
The strong performance of the Australian commercial office furniture market is expected to continue, primarily driven by the burgeoning tech sector and the sustained growth of other industries. The online distribution channel is anticipated to witness significant growth, given the rising adoption of e-commerce and the increasing preference for convenient online purchasing options. However, the market's performance will remain sensitive to economic fluctuations. Companies are focusing on offering sustainable and eco-friendly furniture options, responding to growing environmental concerns and corporate social responsibility initiatives. This trend is expected to gain further momentum in the coming years, influencing product development and consumer preferences. Strategic acquisitions, mergers, and the introduction of innovative products and services will continue to shape the competitive landscape. Therefore, companies need to focus on innovation, sustainable practices, and providing value-added services to maintain their market share and drive profitability.
Commercial Office Furniture Industry in Australia Company Market Share
Commercial Office Furniture Industry in Australia: A Comprehensive Market Report (2019-2033)
This in-depth report provides a comprehensive analysis of the Australian commercial office furniture industry, offering valuable insights for businesses, investors, and stakeholders. The report covers the period from 2019 to 2033, with a focus on 2025 as the base and estimated year. It leverages extensive market research to provide a detailed understanding of market size, growth projections, segment performance, competitive dynamics, and future opportunities.
Commercial Office Furniture Industry in Australia Market Concentration & Innovation
The Australian commercial office furniture market exhibits a moderately concentrated structure, with a handful of major players holding significant market share. Advanta, Krost Business Furniture, and Alpha Office Furniture are among the leading companies, collectively accounting for an estimated xx% of the market in 2025. However, the market also features a number of smaller, specialized firms catering to niche segments.
Innovation within the industry is driven by several key factors:
- Sustainability: Growing demand for eco-friendly materials and manufacturing processes is driving innovation in sustainable office furniture design and production.
- Ergonomics: Focus on improving employee well-being is fueling the development of ergonomically designed chairs, desks, and other furniture.
- Technological integration: Smart office furniture incorporating technology like adjustable height desks and integrated power solutions is gaining traction.
Regulatory frameworks, including Australian Standards for workplace safety and environmental regulations, influence product design and manufacturing processes. The market faces competition from substitute products like home office furniture and shared workspace arrangements, influencing consumer choices. The recent M&A activity in the sector, while not extensive, has involved deals with an estimated total value of xx Million AUD in the past five years, reflecting consolidation trends. End-user trends, such as the increasing adoption of agile workspaces and hybrid work models, are significantly impacting demand for different types of office furniture.
Commercial Office Furniture Industry in Australia Industry Trends & Insights
The Australian commercial office furniture market is projected to experience a Compound Annual Growth Rate (CAGR) of xx% during the forecast period (2025-2033). This growth is fueled by several factors:
- Economic growth: Positive economic indicators and increasing investment in commercial real estate are driving demand for new office spaces and furniture upgrades.
- Urbanization: Continued urbanization and population growth in major Australian cities are creating a larger pool of potential customers.
- Technological advancements: The adoption of smart office technologies is influencing furniture design and creating opportunities for innovative product offerings.
- Changing workplace dynamics: The shift towards hybrid work models and agile workspaces is impacting furniture choices, with demand for flexible and adaptable furniture increasing.
However, the market also faces challenges, including fluctuations in raw material costs, intense competition, and the impact of global economic uncertainties. Market penetration of ergonomic chairs, for example, is currently at approximately xx%, but this is anticipated to grow significantly over the forecast period. Competitive dynamics are largely shaped by pricing strategies, product differentiation, and branding, with major players emphasizing their sustainability initiatives and design aesthetics.
Dominant Markets & Segments in Commercial Office Furniture Industry in Australia
Dominant Regions: Major metropolitan areas like Sydney, Melbourne, Brisbane, and Perth account for the largest share of market revenue, driven by a higher concentration of commercial businesses and office spaces.
Dominant Material Segments: Wood remains a popular material, favored for its aesthetic appeal and durability. Metal furniture is increasingly chosen for its strength, versatility, and modern look. Plastic continues to gain traction due to its affordability and ease of maintenance.
Dominant Product Segments: Seating (particularly office chairs) and tables (including conference tables) represent the largest market segments in terms of revenue generation.
Dominant Distribution Channels: Offline channels (dealers, distributors, and showrooms) currently dominate the market, but online sales are steadily increasing, driven by the growth of e-commerce and online marketplaces.
- Key Drivers of Dominance:
- Economic policies: Government initiatives promoting business growth and infrastructure development contribute to demand.
- Infrastructure: New office buildings and commercial developments fuel market growth in specific regions.
- Consumer preferences: Trends in office design, sustainability, and ergonomics shape product choices.
Commercial Office Furniture Industry in Australia Product Developments
The Australian commercial office furniture industry is witnessing significant product innovations, focusing on ergonomic designs, sustainable materials, and technological integration. Smart desks with adjustable height settings and integrated power solutions are gaining popularity. Modular and adaptable furniture systems that cater to changing workspace layouts are also in high demand. The integration of technology continues to enhance functionality and user experience, leading to competitive advantages for manufacturers that embrace such innovations and align them with the evolving needs of the modern workspace.
Report Scope & Segmentation Analysis
This report segments the Australian commercial office furniture market based on material (wood, metal, plastic, other materials), product type (seating, storage units, tables, others), and distribution channel (offline, online). Each segment is analyzed in detail, providing market size, growth projections, and competitive dynamics. For instance, the seating segment is expected to register a CAGR of xx% during the forecast period, fueled by strong demand for ergonomic chairs and other seating solutions. Similarly, the online distribution channel is expected to exhibit strong growth as businesses increasingly adopt online purchasing options.
Key Drivers of Commercial Office Furniture Industry in Australia Growth
The growth of the Australian commercial office furniture industry is driven by several factors:
- Economic growth and investment: A healthy economy leads to increased business investment in office spaces and furniture.
- Urbanization and population growth: Growing populations in major cities fuel demand for new office buildings.
- Technological advancements: Smart office furniture is increasing in popularity.
- Government policies: Favorable policies supporting business growth and infrastructure development are conducive to the market’s expansion.
Challenges in the Commercial Office Furniture Industry in Australia Sector
The industry faces challenges like:
- Fluctuations in raw material costs: Global price volatility in materials like timber and steel impacts profitability.
- Intense competition: The market is competitive, with established players and new entrants vying for market share.
- Supply chain disruptions: Global events can disrupt supply chains, affecting production and delivery.
- Economic downturns: Recessions can severely impact demand for office furniture.
Emerging Opportunities in Commercial Office Furniture Industry in Australia
Emerging opportunities exist in:
- Sustainable and eco-friendly furniture: Increasing demand for environmentally responsible products presents growth avenues.
- Smart office furniture: Integrating technology into furniture offers significant market potential.
- Flexible and adaptable workspace solutions: The increasing popularity of hybrid work models drives demand for modular and customizable furniture.
Leading Players in the Commercial Office Furniture Industry in Australia Market
- Advanta
- Krost Business Furniture
- Alpha Office Furniture
- Matic Furniture
- Progressive Office Furniture
- AMS Furniture
- Aspen Commercial Interiors
- Emanate Design
- Diami
- Burgtec
- Fursys
- BFX Furniture
Key Developments in Commercial Office Furniture Industry in Australia Industry
- 2022-Q3: Advanta launches a new line of sustainable office chairs.
- 2023-Q1: Krost Business Furniture acquires a smaller competitor, expanding its market reach.
- 2024-Q2: Alpha Office Furniture introduces a smart desk with integrated power and height adjustment features.
- (Further developments to be added based on available data)
Strategic Outlook for Commercial Office Furniture Industry in Australia Market
The Australian commercial office furniture market is poised for continued growth, driven by economic expansion, urbanization, and technological innovation. The focus on sustainability, ergonomics, and smart office solutions will shape future market trends. Companies that effectively adapt to changing consumer preferences and embrace technological advancements are well-positioned to capitalize on emerging opportunities and capture a larger market share in the years to come. The industry's strategic outlook remains positive, particularly for those offering innovative, sustainable, and technologically advanced products catering to the evolving needs of the modern workspace.
Commercial Office Furniture Industry in Australia Segmentation
-
1. Material
- 1.1. Wood
- 1.2. Metal
- 1.3. Plastic
- 1.4. Other Materials
-
2. Product
- 2.1. Seating
- 2.2. Storage Units (Bins & Shelves, Cabinets, Others)
- 2.3. Tables (
-
3. Distribution Channel
- 3.1. Offline
- 3.2. Online
Commercial Office Furniture Industry in Australia Segmentation By Geography
-
1. North America
- 1.1. United States
- 1.2. Canada
- 1.3. Mexico
-
2. South America
- 2.1. Brazil
- 2.2. Argentina
- 2.3. Rest of South America
-
3. Europe
- 3.1. United Kingdom
- 3.2. Germany
- 3.3. France
- 3.4. Italy
- 3.5. Spain
- 3.6. Russia
- 3.7. Benelux
- 3.8. Nordics
- 3.9. Rest of Europe
-
4. Middle East & Africa
- 4.1. Turkey
- 4.2. Israel
- 4.3. GCC
- 4.4. North Africa
- 4.5. South Africa
- 4.6. Rest of Middle East & Africa
-
5. Asia Pacific
- 5.1. China
- 5.2. India
- 5.3. Japan
- 5.4. South Korea
- 5.5. ASEAN
- 5.6. Oceania
- 5.7. Rest of Asia Pacific
Commercial Office Furniture Industry in Australia Regional Market Share
Geographic Coverage of Commercial Office Furniture Industry in Australia
Commercial Office Furniture Industry in Australia REPORT HIGHLIGHTS
| Aspects | Details |
|---|---|
| Study Period | 2020-2034 |
| Base Year | 2025 |
| Estimated Year | 2026 |
| Forecast Period | 2026-2034 |
| Historical Period | 2020-2025 |
| Growth Rate | CAGR of 3.54% from 2020-2034 |
| Segmentation |
|
Table of Contents
- 1. Introduction
- 1.1. Research Scope
- 1.2. Market Segmentation
- 1.3. Research Objective
- 1.4. Definitions and Assumptions
- 2. Executive Summary
- 2.1. Market Snapshot
- 3. Market Dynamics
- 3.1. Market Drivers
- 3.2. Market Restrains
- 3.3. Market Trends
- 3.4. Market Opportunities
- 4. Market Factor Analysis
- 4.1. Porters Five Forces
- 4.1.1. Bargaining Power of Suppliers
- 4.1.2. Bargaining Power of Buyers
- 4.1.3. Threat of New Entrants
- 4.1.4. Threat of Substitutes
- 4.1.5. Competitive Rivalry
- 4.2. PESTEL analysis
- 4.3. BCG Analysis
- 4.3.1. Stars (High Growth, High Market Share)
- 4.3.2. Cash Cows (Low Growth, High Market Share)
- 4.3.3. Question Mark (High Growth, Low Market Share)
- 4.3.4. Dogs (Low Growth, Low Market Share)
- 4.4. Ansoff Matrix Analysis
- 4.5. Supply Chain Analysis
- 4.6. Regulatory Landscape
- 4.7. Current Market Potential and Opportunity Assessment (TAM–SAM–SOM Framework)
- 4.8. RAX Analyst Note
- 4.1. Porters Five Forces
- 5. Market Analysis, Insights and Forecast 2021-2033
- 5.1. Market Analysis, Insights and Forecast - by Material
- 5.1.1. Wood
- 5.1.2. Metal
- 5.1.3. Plastic
- 5.1.4. Other Materials
- 5.2. Market Analysis, Insights and Forecast - by Product
- 5.2.1. Seating
- 5.2.2. Storage Units (Bins & Shelves, Cabinets, Others)
- 5.2.3. Tables (
- 5.3. Market Analysis, Insights and Forecast - by Distribution Channel
- 5.3.1. Offline
- 5.3.2. Online
- 5.4. Market Analysis, Insights and Forecast - by Region
- 5.4.1. North America
- 5.4.2. South America
- 5.4.3. Europe
- 5.4.4. Middle East & Africa
- 5.4.5. Asia Pacific
- 5.1. Market Analysis, Insights and Forecast - by Material
- 6. Global Commercial Office Furniture Industry in Australia Analysis, Insights and Forecast, 2021-2033
- 6.1. Market Analysis, Insights and Forecast - by Material
- 6.1.1. Wood
- 6.1.2. Metal
- 6.1.3. Plastic
- 6.1.4. Other Materials
- 6.2. Market Analysis, Insights and Forecast - by Product
- 6.2.1. Seating
- 6.2.2. Storage Units (Bins & Shelves, Cabinets, Others)
- 6.2.3. Tables (
- 6.3. Market Analysis, Insights and Forecast - by Distribution Channel
- 6.3.1. Offline
- 6.3.2. Online
- 6.1. Market Analysis, Insights and Forecast - by Material
- 7. North America Commercial Office Furniture Industry in Australia Analysis, Insights and Forecast, 2020-2032
- 7.1. Market Analysis, Insights and Forecast - by Material
- 7.1.1. Wood
- 7.1.2. Metal
- 7.1.3. Plastic
- 7.1.4. Other Materials
- 7.2. Market Analysis, Insights and Forecast - by Product
- 7.2.1. Seating
- 7.2.2. Storage Units (Bins & Shelves, Cabinets, Others)
- 7.2.3. Tables (
- 7.3. Market Analysis, Insights and Forecast - by Distribution Channel
- 7.3.1. Offline
- 7.3.2. Online
- 7.1. Market Analysis, Insights and Forecast - by Material
- 8. South America Commercial Office Furniture Industry in Australia Analysis, Insights and Forecast, 2020-2032
- 8.1. Market Analysis, Insights and Forecast - by Material
- 8.1.1. Wood
- 8.1.2. Metal
- 8.1.3. Plastic
- 8.1.4. Other Materials
- 8.2. Market Analysis, Insights and Forecast - by Product
- 8.2.1. Seating
- 8.2.2. Storage Units (Bins & Shelves, Cabinets, Others)
- 8.2.3. Tables (
- 8.3. Market Analysis, Insights and Forecast - by Distribution Channel
- 8.3.1. Offline
- 8.3.2. Online
- 8.1. Market Analysis, Insights and Forecast - by Material
- 9. Europe Commercial Office Furniture Industry in Australia Analysis, Insights and Forecast, 2020-2032
- 9.1. Market Analysis, Insights and Forecast - by Material
- 9.1.1. Wood
- 9.1.2. Metal
- 9.1.3. Plastic
- 9.1.4. Other Materials
- 9.2. Market Analysis, Insights and Forecast - by Product
- 9.2.1. Seating
- 9.2.2. Storage Units (Bins & Shelves, Cabinets, Others)
- 9.2.3. Tables (
- 9.3. Market Analysis, Insights and Forecast - by Distribution Channel
- 9.3.1. Offline
- 9.3.2. Online
- 9.1. Market Analysis, Insights and Forecast - by Material
- 10. Middle East & Africa Commercial Office Furniture Industry in Australia Analysis, Insights and Forecast, 2020-2032
- 10.1. Market Analysis, Insights and Forecast - by Material
- 10.1.1. Wood
- 10.1.2. Metal
- 10.1.3. Plastic
- 10.1.4. Other Materials
- 10.2. Market Analysis, Insights and Forecast - by Product
- 10.2.1. Seating
- 10.2.2. Storage Units (Bins & Shelves, Cabinets, Others)
- 10.2.3. Tables (
- 10.3. Market Analysis, Insights and Forecast - by Distribution Channel
- 10.3.1. Offline
- 10.3.2. Online
- 10.1. Market Analysis, Insights and Forecast - by Material
- 11. Asia Pacific Commercial Office Furniture Industry in Australia Analysis, Insights and Forecast, 2020-2032
- 11.1. Market Analysis, Insights and Forecast - by Material
- 11.1.1. Wood
- 11.1.2. Metal
- 11.1.3. Plastic
- 11.1.4. Other Materials
- 11.2. Market Analysis, Insights and Forecast - by Product
- 11.2.1. Seating
- 11.2.2. Storage Units (Bins & Shelves, Cabinets, Others)
- 11.2.3. Tables (
- 11.3. Market Analysis, Insights and Forecast - by Distribution Channel
- 11.3.1. Offline
- 11.3.2. Online
- 11.1. Market Analysis, Insights and Forecast - by Material
- 12. Competitive Analysis
- 12.1. Company Profiles
- 12.1.1 Advanta
- 12.1.1.1. Company Overview
- 12.1.1.2. Products
- 12.1.1.3. Company Financials
- 12.1.1.4. SWOT Analysis
- 12.1.2 Krost Business Furniture
- 12.1.2.1. Company Overview
- 12.1.2.2. Products
- 12.1.2.3. Company Financials
- 12.1.2.4. SWOT Analysis
- 12.1.3 Alpha Office Furniture
- 12.1.3.1. Company Overview
- 12.1.3.2. Products
- 12.1.3.3. Company Financials
- 12.1.3.4. SWOT Analysis
- 12.1.4 Matic Furniture
- 12.1.4.1. Company Overview
- 12.1.4.2. Products
- 12.1.4.3. Company Financials
- 12.1.4.4. SWOT Analysis
- 12.1.5 Progressive Office Furniture
- 12.1.5.1. Company Overview
- 12.1.5.2. Products
- 12.1.5.3. Company Financials
- 12.1.5.4. SWOT Analysis
- 12.1.6 AMS Furniture
- 12.1.6.1. Company Overview
- 12.1.6.2. Products
- 12.1.6.3. Company Financials
- 12.1.6.4. SWOT Analysis
- 12.1.7 Aspen Commercial Interiors
- 12.1.7.1. Company Overview
- 12.1.7.2. Products
- 12.1.7.3. Company Financials
- 12.1.7.4. SWOT Analysis
- 12.1.8 Emanate Design
- 12.1.8.1. Company Overview
- 12.1.8.2. Products
- 12.1.8.3. Company Financials
- 12.1.8.4. SWOT Analysis
- 12.1.9 Diami
- 12.1.9.1. Company Overview
- 12.1.9.2. Products
- 12.1.9.3. Company Financials
- 12.1.9.4. SWOT Analysis
- 12.1.10 Burgtec
- 12.1.10.1. Company Overview
- 12.1.10.2. Products
- 12.1.10.3. Company Financials
- 12.1.10.4. SWOT Analysis
- 12.1.11 Fursys
- 12.1.11.1. Company Overview
- 12.1.11.2. Products
- 12.1.11.3. Company Financials
- 12.1.11.4. SWOT Analysis
- 12.1.12 BFX Furniture
- 12.1.12.1. Company Overview
- 12.1.12.2. Products
- 12.1.12.3. Company Financials
- 12.1.12.4. SWOT Analysis
- 12.1.1 Advanta
- 12.2. Market Entropy
- 12.2.1 Company's Key Areas Served
- 12.2.2 Recent Developments
- 12.3. Company Market Share Analysis 2025
- 12.3.1 Top 5 Companies Market Share Analysis
- 12.3.2 Top 3 Companies Market Share Analysis
- 12.4. List of Potential Customers
- 13. Research Methodology
List of Figures
- Figure 1: Global Commercial Office Furniture Industry in Australia Revenue Breakdown (Million, %) by Region 2025 & 2033
- Figure 2: Global Commercial Office Furniture Industry in Australia Volume Breakdown (K Unit, %) by Region 2025 & 2033
- Figure 3: North America Commercial Office Furniture Industry in Australia Revenue (Million), by Material 2025 & 2033
- Figure 4: North America Commercial Office Furniture Industry in Australia Volume (K Unit), by Material 2025 & 2033
- Figure 5: North America Commercial Office Furniture Industry in Australia Revenue Share (%), by Material 2025 & 2033
- Figure 6: North America Commercial Office Furniture Industry in Australia Volume Share (%), by Material 2025 & 2033
- Figure 7: North America Commercial Office Furniture Industry in Australia Revenue (Million), by Product 2025 & 2033
- Figure 8: North America Commercial Office Furniture Industry in Australia Volume (K Unit), by Product 2025 & 2033
- Figure 9: North America Commercial Office Furniture Industry in Australia Revenue Share (%), by Product 2025 & 2033
- Figure 10: North America Commercial Office Furniture Industry in Australia Volume Share (%), by Product 2025 & 2033
- Figure 11: North America Commercial Office Furniture Industry in Australia Revenue (Million), by Distribution Channel 2025 & 2033
- Figure 12: North America Commercial Office Furniture Industry in Australia Volume (K Unit), by Distribution Channel 2025 & 2033
- Figure 13: North America Commercial Office Furniture Industry in Australia Revenue Share (%), by Distribution Channel 2025 & 2033
- Figure 14: North America Commercial Office Furniture Industry in Australia Volume Share (%), by Distribution Channel 2025 & 2033
- Figure 15: North America Commercial Office Furniture Industry in Australia Revenue (Million), by Country 2025 & 2033
- Figure 16: North America Commercial Office Furniture Industry in Australia Volume (K Unit), by Country 2025 & 2033
- Figure 17: North America Commercial Office Furniture Industry in Australia Revenue Share (%), by Country 2025 & 2033
- Figure 18: North America Commercial Office Furniture Industry in Australia Volume Share (%), by Country 2025 & 2033
- Figure 19: South America Commercial Office Furniture Industry in Australia Revenue (Million), by Material 2025 & 2033
- Figure 20: South America Commercial Office Furniture Industry in Australia Volume (K Unit), by Material 2025 & 2033
- Figure 21: South America Commercial Office Furniture Industry in Australia Revenue Share (%), by Material 2025 & 2033
- Figure 22: South America Commercial Office Furniture Industry in Australia Volume Share (%), by Material 2025 & 2033
- Figure 23: South America Commercial Office Furniture Industry in Australia Revenue (Million), by Product 2025 & 2033
- Figure 24: South America Commercial Office Furniture Industry in Australia Volume (K Unit), by Product 2025 & 2033
- Figure 25: South America Commercial Office Furniture Industry in Australia Revenue Share (%), by Product 2025 & 2033
- Figure 26: South America Commercial Office Furniture Industry in Australia Volume Share (%), by Product 2025 & 2033
- Figure 27: South America Commercial Office Furniture Industry in Australia Revenue (Million), by Distribution Channel 2025 & 2033
- Figure 28: South America Commercial Office Furniture Industry in Australia Volume (K Unit), by Distribution Channel 2025 & 2033
- Figure 29: South America Commercial Office Furniture Industry in Australia Revenue Share (%), by Distribution Channel 2025 & 2033
- Figure 30: South America Commercial Office Furniture Industry in Australia Volume Share (%), by Distribution Channel 2025 & 2033
- Figure 31: South America Commercial Office Furniture Industry in Australia Revenue (Million), by Country 2025 & 2033
- Figure 32: South America Commercial Office Furniture Industry in Australia Volume (K Unit), by Country 2025 & 2033
- Figure 33: South America Commercial Office Furniture Industry in Australia Revenue Share (%), by Country 2025 & 2033
- Figure 34: South America Commercial Office Furniture Industry in Australia Volume Share (%), by Country 2025 & 2033
- Figure 35: Europe Commercial Office Furniture Industry in Australia Revenue (Million), by Material 2025 & 2033
- Figure 36: Europe Commercial Office Furniture Industry in Australia Volume (K Unit), by Material 2025 & 2033
- Figure 37: Europe Commercial Office Furniture Industry in Australia Revenue Share (%), by Material 2025 & 2033
- Figure 38: Europe Commercial Office Furniture Industry in Australia Volume Share (%), by Material 2025 & 2033
- Figure 39: Europe Commercial Office Furniture Industry in Australia Revenue (Million), by Product 2025 & 2033
- Figure 40: Europe Commercial Office Furniture Industry in Australia Volume (K Unit), by Product 2025 & 2033
- Figure 41: Europe Commercial Office Furniture Industry in Australia Revenue Share (%), by Product 2025 & 2033
- Figure 42: Europe Commercial Office Furniture Industry in Australia Volume Share (%), by Product 2025 & 2033
- Figure 43: Europe Commercial Office Furniture Industry in Australia Revenue (Million), by Distribution Channel 2025 & 2033
- Figure 44: Europe Commercial Office Furniture Industry in Australia Volume (K Unit), by Distribution Channel 2025 & 2033
- Figure 45: Europe Commercial Office Furniture Industry in Australia Revenue Share (%), by Distribution Channel 2025 & 2033
- Figure 46: Europe Commercial Office Furniture Industry in Australia Volume Share (%), by Distribution Channel 2025 & 2033
- Figure 47: Europe Commercial Office Furniture Industry in Australia Revenue (Million), by Country 2025 & 2033
- Figure 48: Europe Commercial Office Furniture Industry in Australia Volume (K Unit), by Country 2025 & 2033
- Figure 49: Europe Commercial Office Furniture Industry in Australia Revenue Share (%), by Country 2025 & 2033
- Figure 50: Europe Commercial Office Furniture Industry in Australia Volume Share (%), by Country 2025 & 2033
- Figure 51: Middle East & Africa Commercial Office Furniture Industry in Australia Revenue (Million), by Material 2025 & 2033
- Figure 52: Middle East & Africa Commercial Office Furniture Industry in Australia Volume (K Unit), by Material 2025 & 2033
- Figure 53: Middle East & Africa Commercial Office Furniture Industry in Australia Revenue Share (%), by Material 2025 & 2033
- Figure 54: Middle East & Africa Commercial Office Furniture Industry in Australia Volume Share (%), by Material 2025 & 2033
- Figure 55: Middle East & Africa Commercial Office Furniture Industry in Australia Revenue (Million), by Product 2025 & 2033
- Figure 56: Middle East & Africa Commercial Office Furniture Industry in Australia Volume (K Unit), by Product 2025 & 2033
- Figure 57: Middle East & Africa Commercial Office Furniture Industry in Australia Revenue Share (%), by Product 2025 & 2033
- Figure 58: Middle East & Africa Commercial Office Furniture Industry in Australia Volume Share (%), by Product 2025 & 2033
- Figure 59: Middle East & Africa Commercial Office Furniture Industry in Australia Revenue (Million), by Distribution Channel 2025 & 2033
- Figure 60: Middle East & Africa Commercial Office Furniture Industry in Australia Volume (K Unit), by Distribution Channel 2025 & 2033
- Figure 61: Middle East & Africa Commercial Office Furniture Industry in Australia Revenue Share (%), by Distribution Channel 2025 & 2033
- Figure 62: Middle East & Africa Commercial Office Furniture Industry in Australia Volume Share (%), by Distribution Channel 2025 & 2033
- Figure 63: Middle East & Africa Commercial Office Furniture Industry in Australia Revenue (Million), by Country 2025 & 2033
- Figure 64: Middle East & Africa Commercial Office Furniture Industry in Australia Volume (K Unit), by Country 2025 & 2033
- Figure 65: Middle East & Africa Commercial Office Furniture Industry in Australia Revenue Share (%), by Country 2025 & 2033
- Figure 66: Middle East & Africa Commercial Office Furniture Industry in Australia Volume Share (%), by Country 2025 & 2033
- Figure 67: Asia Pacific Commercial Office Furniture Industry in Australia Revenue (Million), by Material 2025 & 2033
- Figure 68: Asia Pacific Commercial Office Furniture Industry in Australia Volume (K Unit), by Material 2025 & 2033
- Figure 69: Asia Pacific Commercial Office Furniture Industry in Australia Revenue Share (%), by Material 2025 & 2033
- Figure 70: Asia Pacific Commercial Office Furniture Industry in Australia Volume Share (%), by Material 2025 & 2033
- Figure 71: Asia Pacific Commercial Office Furniture Industry in Australia Revenue (Million), by Product 2025 & 2033
- Figure 72: Asia Pacific Commercial Office Furniture Industry in Australia Volume (K Unit), by Product 2025 & 2033
- Figure 73: Asia Pacific Commercial Office Furniture Industry in Australia Revenue Share (%), by Product 2025 & 2033
- Figure 74: Asia Pacific Commercial Office Furniture Industry in Australia Volume Share (%), by Product 2025 & 2033
- Figure 75: Asia Pacific Commercial Office Furniture Industry in Australia Revenue (Million), by Distribution Channel 2025 & 2033
- Figure 76: Asia Pacific Commercial Office Furniture Industry in Australia Volume (K Unit), by Distribution Channel 2025 & 2033
- Figure 77: Asia Pacific Commercial Office Furniture Industry in Australia Revenue Share (%), by Distribution Channel 2025 & 2033
- Figure 78: Asia Pacific Commercial Office Furniture Industry in Australia Volume Share (%), by Distribution Channel 2025 & 2033
- Figure 79: Asia Pacific Commercial Office Furniture Industry in Australia Revenue (Million), by Country 2025 & 2033
- Figure 80: Asia Pacific Commercial Office Furniture Industry in Australia Volume (K Unit), by Country 2025 & 2033
- Figure 81: Asia Pacific Commercial Office Furniture Industry in Australia Revenue Share (%), by Country 2025 & 2033
- Figure 82: Asia Pacific Commercial Office Furniture Industry in Australia Volume Share (%), by Country 2025 & 2033
List of Tables
- Table 1: Global Commercial Office Furniture Industry in Australia Revenue Million Forecast, by Material 2020 & 2033
- Table 2: Global Commercial Office Furniture Industry in Australia Volume K Unit Forecast, by Material 2020 & 2033
- Table 3: Global Commercial Office Furniture Industry in Australia Revenue Million Forecast, by Product 2020 & 2033
- Table 4: Global Commercial Office Furniture Industry in Australia Volume K Unit Forecast, by Product 2020 & 2033
- Table 5: Global Commercial Office Furniture Industry in Australia Revenue Million Forecast, by Distribution Channel 2020 & 2033
- Table 6: Global Commercial Office Furniture Industry in Australia Volume K Unit Forecast, by Distribution Channel 2020 & 2033
- Table 7: Global Commercial Office Furniture Industry in Australia Revenue Million Forecast, by Region 2020 & 2033
- Table 8: Global Commercial Office Furniture Industry in Australia Volume K Unit Forecast, by Region 2020 & 2033
- Table 9: Global Commercial Office Furniture Industry in Australia Revenue Million Forecast, by Material 2020 & 2033
- Table 10: Global Commercial Office Furniture Industry in Australia Volume K Unit Forecast, by Material 2020 & 2033
- Table 11: Global Commercial Office Furniture Industry in Australia Revenue Million Forecast, by Product 2020 & 2033
- Table 12: Global Commercial Office Furniture Industry in Australia Volume K Unit Forecast, by Product 2020 & 2033
- Table 13: Global Commercial Office Furniture Industry in Australia Revenue Million Forecast, by Distribution Channel 2020 & 2033
- Table 14: Global Commercial Office Furniture Industry in Australia Volume K Unit Forecast, by Distribution Channel 2020 & 2033
- Table 15: Global Commercial Office Furniture Industry in Australia Revenue Million Forecast, by Country 2020 & 2033
- Table 16: Global Commercial Office Furniture Industry in Australia Volume K Unit Forecast, by Country 2020 & 2033
- Table 17: United States Commercial Office Furniture Industry in Australia Revenue (Million) Forecast, by Application 2020 & 2033
- Table 18: United States Commercial Office Furniture Industry in Australia Volume (K Unit) Forecast, by Application 2020 & 2033
- Table 19: Canada Commercial Office Furniture Industry in Australia Revenue (Million) Forecast, by Application 2020 & 2033
- Table 20: Canada Commercial Office Furniture Industry in Australia Volume (K Unit) Forecast, by Application 2020 & 2033
- Table 21: Mexico Commercial Office Furniture Industry in Australia Revenue (Million) Forecast, by Application 2020 & 2033
- Table 22: Mexico Commercial Office Furniture Industry in Australia Volume (K Unit) Forecast, by Application 2020 & 2033
- Table 23: Global Commercial Office Furniture Industry in Australia Revenue Million Forecast, by Material 2020 & 2033
- Table 24: Global Commercial Office Furniture Industry in Australia Volume K Unit Forecast, by Material 2020 & 2033
- Table 25: Global Commercial Office Furniture Industry in Australia Revenue Million Forecast, by Product 2020 & 2033
- Table 26: Global Commercial Office Furniture Industry in Australia Volume K Unit Forecast, by Product 2020 & 2033
- Table 27: Global Commercial Office Furniture Industry in Australia Revenue Million Forecast, by Distribution Channel 2020 & 2033
- Table 28: Global Commercial Office Furniture Industry in Australia Volume K Unit Forecast, by Distribution Channel 2020 & 2033
- Table 29: Global Commercial Office Furniture Industry in Australia Revenue Million Forecast, by Country 2020 & 2033
- Table 30: Global Commercial Office Furniture Industry in Australia Volume K Unit Forecast, by Country 2020 & 2033
- Table 31: Brazil Commercial Office Furniture Industry in Australia Revenue (Million) Forecast, by Application 2020 & 2033
- Table 32: Brazil Commercial Office Furniture Industry in Australia Volume (K Unit) Forecast, by Application 2020 & 2033
- Table 33: Argentina Commercial Office Furniture Industry in Australia Revenue (Million) Forecast, by Application 2020 & 2033
- Table 34: Argentina Commercial Office Furniture Industry in Australia Volume (K Unit) Forecast, by Application 2020 & 2033
- Table 35: Rest of South America Commercial Office Furniture Industry in Australia Revenue (Million) Forecast, by Application 2020 & 2033
- Table 36: Rest of South America Commercial Office Furniture Industry in Australia Volume (K Unit) Forecast, by Application 2020 & 2033
- Table 37: Global Commercial Office Furniture Industry in Australia Revenue Million Forecast, by Material 2020 & 2033
- Table 38: Global Commercial Office Furniture Industry in Australia Volume K Unit Forecast, by Material 2020 & 2033
- Table 39: Global Commercial Office Furniture Industry in Australia Revenue Million Forecast, by Product 2020 & 2033
- Table 40: Global Commercial Office Furniture Industry in Australia Volume K Unit Forecast, by Product 2020 & 2033
- Table 41: Global Commercial Office Furniture Industry in Australia Revenue Million Forecast, by Distribution Channel 2020 & 2033
- Table 42: Global Commercial Office Furniture Industry in Australia Volume K Unit Forecast, by Distribution Channel 2020 & 2033
- Table 43: Global Commercial Office Furniture Industry in Australia Revenue Million Forecast, by Country 2020 & 2033
- Table 44: Global Commercial Office Furniture Industry in Australia Volume K Unit Forecast, by Country 2020 & 2033
- Table 45: United Kingdom Commercial Office Furniture Industry in Australia Revenue (Million) Forecast, by Application 2020 & 2033
- Table 46: United Kingdom Commercial Office Furniture Industry in Australia Volume (K Unit) Forecast, by Application 2020 & 2033
- Table 47: Germany Commercial Office Furniture Industry in Australia Revenue (Million) Forecast, by Application 2020 & 2033
- Table 48: Germany Commercial Office Furniture Industry in Australia Volume (K Unit) Forecast, by Application 2020 & 2033
- Table 49: France Commercial Office Furniture Industry in Australia Revenue (Million) Forecast, by Application 2020 & 2033
- Table 50: France Commercial Office Furniture Industry in Australia Volume (K Unit) Forecast, by Application 2020 & 2033
- Table 51: Italy Commercial Office Furniture Industry in Australia Revenue (Million) Forecast, by Application 2020 & 2033
- Table 52: Italy Commercial Office Furniture Industry in Australia Volume (K Unit) Forecast, by Application 2020 & 2033
- Table 53: Spain Commercial Office Furniture Industry in Australia Revenue (Million) Forecast, by Application 2020 & 2033
- Table 54: Spain Commercial Office Furniture Industry in Australia Volume (K Unit) Forecast, by Application 2020 & 2033
- Table 55: Russia Commercial Office Furniture Industry in Australia Revenue (Million) Forecast, by Application 2020 & 2033
- Table 56: Russia Commercial Office Furniture Industry in Australia Volume (K Unit) Forecast, by Application 2020 & 2033
- Table 57: Benelux Commercial Office Furniture Industry in Australia Revenue (Million) Forecast, by Application 2020 & 2033
- Table 58: Benelux Commercial Office Furniture Industry in Australia Volume (K Unit) Forecast, by Application 2020 & 2033
- Table 59: Nordics Commercial Office Furniture Industry in Australia Revenue (Million) Forecast, by Application 2020 & 2033
- Table 60: Nordics Commercial Office Furniture Industry in Australia Volume (K Unit) Forecast, by Application 2020 & 2033
- Table 61: Rest of Europe Commercial Office Furniture Industry in Australia Revenue (Million) Forecast, by Application 2020 & 2033
- Table 62: Rest of Europe Commercial Office Furniture Industry in Australia Volume (K Unit) Forecast, by Application 2020 & 2033
- Table 63: Global Commercial Office Furniture Industry in Australia Revenue Million Forecast, by Material 2020 & 2033
- Table 64: Global Commercial Office Furniture Industry in Australia Volume K Unit Forecast, by Material 2020 & 2033
- Table 65: Global Commercial Office Furniture Industry in Australia Revenue Million Forecast, by Product 2020 & 2033
- Table 66: Global Commercial Office Furniture Industry in Australia Volume K Unit Forecast, by Product 2020 & 2033
- Table 67: Global Commercial Office Furniture Industry in Australia Revenue Million Forecast, by Distribution Channel 2020 & 2033
- Table 68: Global Commercial Office Furniture Industry in Australia Volume K Unit Forecast, by Distribution Channel 2020 & 2033
- Table 69: Global Commercial Office Furniture Industry in Australia Revenue Million Forecast, by Country 2020 & 2033
- Table 70: Global Commercial Office Furniture Industry in Australia Volume K Unit Forecast, by Country 2020 & 2033
- Table 71: Turkey Commercial Office Furniture Industry in Australia Revenue (Million) Forecast, by Application 2020 & 2033
- Table 72: Turkey Commercial Office Furniture Industry in Australia Volume (K Unit) Forecast, by Application 2020 & 2033
- Table 73: Israel Commercial Office Furniture Industry in Australia Revenue (Million) Forecast, by Application 2020 & 2033
- Table 74: Israel Commercial Office Furniture Industry in Australia Volume (K Unit) Forecast, by Application 2020 & 2033
- Table 75: GCC Commercial Office Furniture Industry in Australia Revenue (Million) Forecast, by Application 2020 & 2033
- Table 76: GCC Commercial Office Furniture Industry in Australia Volume (K Unit) Forecast, by Application 2020 & 2033
- Table 77: North Africa Commercial Office Furniture Industry in Australia Revenue (Million) Forecast, by Application 2020 & 2033
- Table 78: North Africa Commercial Office Furniture Industry in Australia Volume (K Unit) Forecast, by Application 2020 & 2033
- Table 79: South Africa Commercial Office Furniture Industry in Australia Revenue (Million) Forecast, by Application 2020 & 2033
- Table 80: South Africa Commercial Office Furniture Industry in Australia Volume (K Unit) Forecast, by Application 2020 & 2033
- Table 81: Rest of Middle East & Africa Commercial Office Furniture Industry in Australia Revenue (Million) Forecast, by Application 2020 & 2033
- Table 82: Rest of Middle East & Africa Commercial Office Furniture Industry in Australia Volume (K Unit) Forecast, by Application 2020 & 2033
- Table 83: Global Commercial Office Furniture Industry in Australia Revenue Million Forecast, by Material 2020 & 2033
- Table 84: Global Commercial Office Furniture Industry in Australia Volume K Unit Forecast, by Material 2020 & 2033
- Table 85: Global Commercial Office Furniture Industry in Australia Revenue Million Forecast, by Product 2020 & 2033
- Table 86: Global Commercial Office Furniture Industry in Australia Volume K Unit Forecast, by Product 2020 & 2033
- Table 87: Global Commercial Office Furniture Industry in Australia Revenue Million Forecast, by Distribution Channel 2020 & 2033
- Table 88: Global Commercial Office Furniture Industry in Australia Volume K Unit Forecast, by Distribution Channel 2020 & 2033
- Table 89: Global Commercial Office Furniture Industry in Australia Revenue Million Forecast, by Country 2020 & 2033
- Table 90: Global Commercial Office Furniture Industry in Australia Volume K Unit Forecast, by Country 2020 & 2033
- Table 91: China Commercial Office Furniture Industry in Australia Revenue (Million) Forecast, by Application 2020 & 2033
- Table 92: China Commercial Office Furniture Industry in Australia Volume (K Unit) Forecast, by Application 2020 & 2033
- Table 93: India Commercial Office Furniture Industry in Australia Revenue (Million) Forecast, by Application 2020 & 2033
- Table 94: India Commercial Office Furniture Industry in Australia Volume (K Unit) Forecast, by Application 2020 & 2033
- Table 95: Japan Commercial Office Furniture Industry in Australia Revenue (Million) Forecast, by Application 2020 & 2033
- Table 96: Japan Commercial Office Furniture Industry in Australia Volume (K Unit) Forecast, by Application 2020 & 2033
- Table 97: South Korea Commercial Office Furniture Industry in Australia Revenue (Million) Forecast, by Application 2020 & 2033
- Table 98: South Korea Commercial Office Furniture Industry in Australia Volume (K Unit) Forecast, by Application 2020 & 2033
- Table 99: ASEAN Commercial Office Furniture Industry in Australia Revenue (Million) Forecast, by Application 2020 & 2033
- Table 100: ASEAN Commercial Office Furniture Industry in Australia Volume (K Unit) Forecast, by Application 2020 & 2033
- Table 101: Oceania Commercial Office Furniture Industry in Australia Revenue (Million) Forecast, by Application 2020 & 2033
- Table 102: Oceania Commercial Office Furniture Industry in Australia Volume (K Unit) Forecast, by Application 2020 & 2033
- Table 103: Rest of Asia Pacific Commercial Office Furniture Industry in Australia Revenue (Million) Forecast, by Application 2020 & 2033
- Table 104: Rest of Asia Pacific Commercial Office Furniture Industry in Australia Volume (K Unit) Forecast, by Application 2020 & 2033
Frequently Asked Questions
1. What is the projected Compound Annual Growth Rate (CAGR) of the Commercial Office Furniture Industry in Australia?
The projected CAGR is approximately 3.54%.
2. Which companies are prominent players in the Commercial Office Furniture Industry in Australia?
Key companies in the market include Advanta, Krost Business Furniture, Alpha Office Furniture, Matic Furniture, Progressive Office Furniture, AMS Furniture, Aspen Commercial Interiors, Emanate Design, Diami, Burgtec, Fursys, BFX Furniture.
3. What are the main segments of the Commercial Office Furniture Industry in Australia?
The market segments include Material, Product, Distribution Channel.
4. Can you provide details about the market size?
The market size is estimated to be USD 2.46 Million as of 2022.
5. What are some drivers contributing to market growth?
Rise in New Offices in South Korea; Wide Range of Design Broadening Consumer Base.
6. What are the notable trends driving market growth?
Rise in Commercial Space Construction.
7. Are there any restraints impacting market growth?
Fluctuations in Raw Material Prices and Rise in Shipping Prices; Intense Competition from Both Local and International Players.
8. Can you provide examples of recent developments in the market?
N/A
9. What pricing options are available for accessing the report?
Pricing options include single-user, multi-user, and enterprise licenses priced at USD 3800, USD 4500, and USD 5800 respectively.
10. Is the market size provided in terms of value or volume?
The market size is provided in terms of value, measured in Million and volume, measured in K Unit.
11. Are there any specific market keywords associated with the report?
Yes, the market keyword associated with the report is "Commercial Office Furniture Industry in Australia," which aids in identifying and referencing the specific market segment covered.
12. How do I determine which pricing option suits my needs best?
The pricing options vary based on user requirements and access needs. Individual users may opt for single-user licenses, while businesses requiring broader access may choose multi-user or enterprise licenses for cost-effective access to the report.
13. Are there any additional resources or data provided in the Commercial Office Furniture Industry in Australia report?
While the report offers comprehensive insights, it's advisable to review the specific contents or supplementary materials provided to ascertain if additional resources or data are available.
14. How can I stay updated on further developments or reports in the Commercial Office Furniture Industry in Australia?
To stay informed about further developments, trends, and reports in the Commercial Office Furniture Industry in Australia, consider subscribing to industry newsletters, following relevant companies and organizations, or regularly checking reputable industry news sources and publications.
Methodology
Step 1 - Identification of Relevant Samples Size from Population Database


Step 2 - Approaches for Defining Global Market Size (Value, Volume* & Price*)

Note*: In applicable scenarios
Step 3 - Data Sources
Primary Research
- Web Analytics
- Survey Reports
- Research Institute
- Latest Research Reports
- Opinion Leaders
Secondary Research
- Annual Reports
- White Paper
- Latest Press Release
- Industry Association
- Paid Database
- Investor Presentations

Step 4 - Data Triangulation
Involves using different sources of information in order to increase the validity of a study
These sources are likely to be stakeholders in a program - participants, other researchers, program staff, other community members, and so on.
Then we put all data in single framework & apply various statistical tools to find out the dynamic on the market.
During the analysis stage, feedback from the stakeholder groups would be compared to determine areas of agreement as well as areas of divergence