
Key Insights
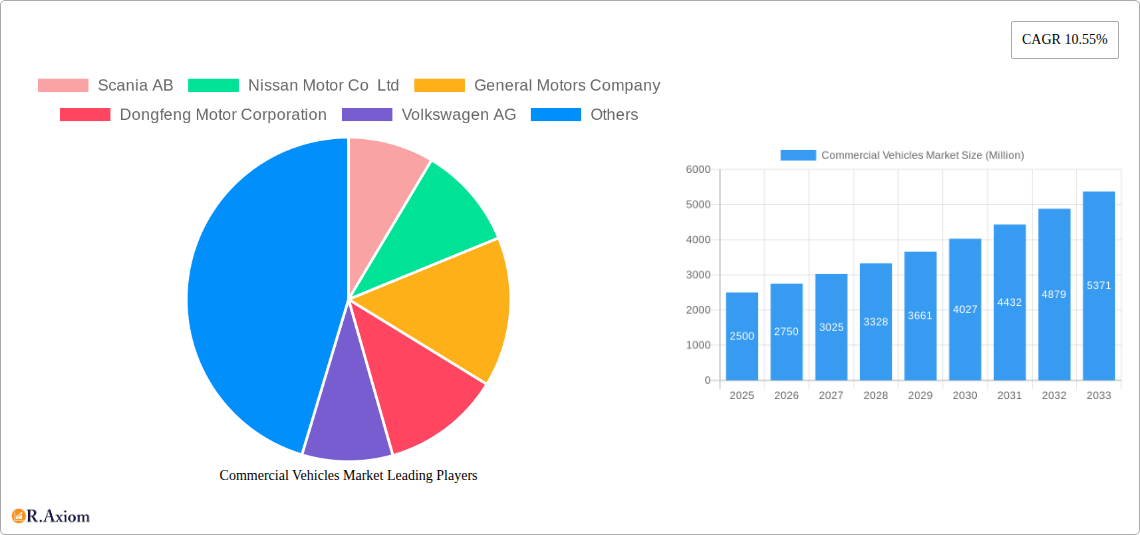
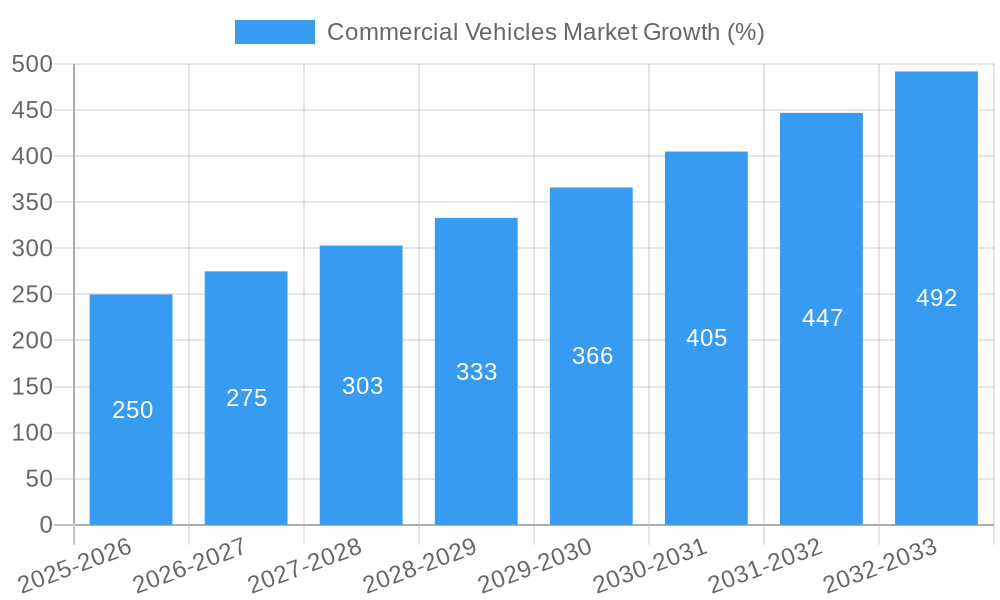
The global commercial vehicle market is experiencing robust growth, driven by increasing urbanization, expanding e-commerce logistics, and a surge in infrastructure development projects worldwide. The market's Compound Annual Growth Rate (CAGR) of 10.55% from 2019 to 2024 suggests a significant upward trajectory, with projections indicating continued expansion through 2033. Key segments driving this growth include Liquefied Petroleum Gas (LPG) powered vehicles, reflecting a focus on cleaner fuel options, and the rapidly expanding adoption of hybrid and electric commercial vehicles, spurred by environmental regulations and sustainability initiatives. The commercial vehicle type segment is dominated by trucks and buses, although specialized vehicles for construction and logistics are also experiencing growth. Major players like Scania, Daimler, Volvo, and BYD are strategically investing in research and development, focusing on technological advancements such as autonomous driving and improved fuel efficiency to maintain their market leadership and cater to evolving customer demands. Competition is intense, with established players facing challenges from emerging electric vehicle manufacturers who are rapidly gaining market share.
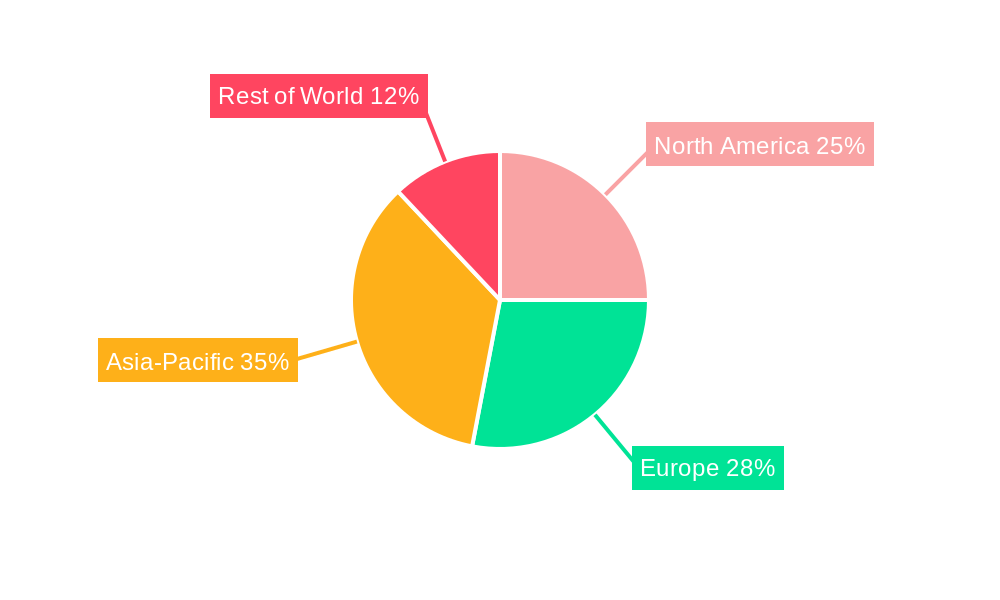
The market's growth is not without its challenges. Rising raw material costs, particularly for battery components in electric vehicles, present a significant restraint. Furthermore, the global chip shortage continues to impact production timelines and supply chain dynamics. Despite these constraints, the long-term outlook for the commercial vehicle market remains positive. Government incentives promoting the adoption of cleaner technologies and the ongoing need for efficient transportation solutions across various industries will continue to fuel market expansion. Regional variations exist, with mature markets in North America and Europe witnessing steady growth alongside the rapid expansion in developing economies of Asia and South America, creating exciting opportunities for both established and emerging players. The market's future will likely be defined by the interplay of technological advancements, sustainable practices, and evolving global economic conditions.
This comprehensive report provides a detailed analysis of the global commercial vehicles market, covering the period from 2019 to 2033. It offers in-depth insights into market dynamics, growth drivers, challenges, and emerging opportunities, enabling stakeholders to make informed strategic decisions. The report segments the market by vehicle type, propulsion type (including hybrid and electric vehicles), and fuel type (including LPG), providing granular data for informed decision-making. Key players such as Scania AB, Nissan Motor Co Ltd, General Motors Company, and others are analyzed, along with their market share and strategic initiatives. The report is essential for investors, manufacturers, suppliers, and anyone interested in the future of the commercial vehicle industry.
Commercial Vehicles Market Market Concentration & Innovation
The global commercial vehicles market exhibits a moderately concentrated structure, with a handful of multinational corporations holding significant market share. However, the market also demonstrates a high degree of innovation, driven by evolving regulatory frameworks, technological advancements, and changing consumer preferences. The market share of the top five players is estimated to be around xx% in 2025, with ongoing consolidation through mergers and acquisitions (M&A) activities further shaping the competitive landscape. Significant M&A deals in the recent past have involved transaction values exceeding xx Million, reflecting the strategic importance of gaining market share and expanding product portfolios.
- Market Concentration: Top 5 players control approximately xx% of the market.
- Innovation Drivers: Stringent emission regulations, demand for fuel efficiency, and technological advancements in autonomous driving and electrification.
- Regulatory Frameworks: Varying emission standards across different regions significantly impact vehicle design and manufacturing.
- Product Substitutes: The emergence of alternative transportation solutions like last-mile delivery services and shared mobility platforms poses a competitive challenge.
- End-User Trends: Growing e-commerce and supply chain complexity fuel the demand for efficient and reliable commercial vehicles.
- M&A Activities: Consolidation through strategic acquisitions to expand geographic reach and gain technological expertise.
Commercial Vehicles Market Industry Trends & Insights
The global commercial vehicles market is experiencing robust growth, driven by a number of factors. The increasing demand for efficient logistics and transportation solutions, coupled with robust infrastructure development in emerging economies, significantly contributes to market expansion. Technological advancements, such as the adoption of electric and hybrid powertrains, are reshaping the industry. The market exhibits a strong preference for fuel-efficient and environmentally friendly vehicles. This transition is accompanied by substantial investments in research and development (R&D) and a shift towards sustainable manufacturing practices. Competitive dynamics are intense, with established players competing through product differentiation, technological innovation, and strategic partnerships. The market is expected to exhibit a compound annual growth rate (CAGR) of xx% during the forecast period (2025-2033), with market penetration for electric and hybrid commercial vehicles steadily increasing.
Dominant Markets & Segments in Commercial Vehicles Market
The Asia-Pacific region is projected to be the dominant market for commercial vehicles throughout the forecast period, owing to rapid economic growth, expanding infrastructure projects, and a burgeoning e-commerce sector. Within this region, China and India are particularly significant markets, displaying high growth potential due to strong governmental support for infrastructure development and the continued expansion of their respective logistics sectors. The hybrid and electric vehicle segment is experiencing rapid growth, primarily driven by stringent emission regulations, government incentives, and increasing consumer awareness of environmental concerns. The LPG segment holds a niche market share and continues to show slow growth, due primarily to the growing preference for cleaner fuel technologies.
- Key Drivers in Asia-Pacific: Rapid economic growth, infrastructure development, and e-commerce expansion.
- Hybrid and Electric Vehicle Growth Drivers: Stringent emission norms, government subsidies, and environmental concerns.
- LPG Segment Challenges: Competition from cleaner fuel alternatives and limited infrastructure.
Commercial Vehicles Market Product Developments
Significant advancements in commercial vehicle technology are revolutionizing the industry, with a strong focus on fuel efficiency, safety, and driver assistance features. Autonomous driving capabilities, advanced telematics, and connected vehicle technology are becoming increasingly prevalent. The integration of lightweight materials and aerodynamic designs aims to improve fuel economy and reduce emissions. This focus on innovation positions the industry for sustainable and cost-effective solutions, addressing the growing need for efficient freight transport while minimizing environmental impact.
Report Scope & Segmentation Analysis
This report comprehensively segments the commercial vehicles market by vehicle type (e.g., trucks, buses, vans), propulsion type (internal combustion engine (ICE), hybrid, electric, fuel cell), and fuel type (diesel, gasoline, LPG, CNG, electric). Each segment is analyzed in detail, providing insights into market size, growth projections, and competitive dynamics. Growth projections vary across segments, with electric and hybrid vehicles demonstrating the highest growth rates driven by environmental concerns and government regulations. Competitive dynamics are influenced by factors such as technological advancements, pricing strategies, and brand recognition.
Key Drivers of Commercial Vehicles Market Growth
Several factors contribute to the growth of the commercial vehicles market. Rising e-commerce activities necessitate efficient last-mile delivery solutions, driving demand for commercial vehicles. Government initiatives promoting infrastructure development and sustainable transportation further boost market growth. Technological advancements, including the adoption of autonomous driving features and alternative fuel technologies, are key catalysts for market expansion. Increasing urbanization and growing industrialization across developing economies contribute significantly to overall market growth.
Challenges in the Commercial Vehicles Market Sector
The commercial vehicle market faces several challenges. Fluctuating fuel prices and supply chain disruptions significantly impact production costs and profitability. Stringent emission regulations require manufacturers to invest heavily in research and development to meet compliance standards. Intense competition and price wars among manufacturers exert pressure on profit margins. Furthermore, the growing adoption of alternative transportation modes like rail and shipping represents a threat to market share.
Emerging Opportunities in Commercial Vehicles Market
The increasing adoption of electric and hybrid commercial vehicles presents significant opportunities. The development of autonomous driving technology promises enhanced efficiency and safety, leading to new market segments. Growing demand for specialized commercial vehicles for niche applications, such as last-mile delivery and urban logistics, creates new revenue streams. Expansion into emerging markets with developing infrastructure offers significant growth potential for manufacturers.
Leading Players in the Commercial Vehicles Market Market
- Scania AB
- Nissan Motor Co Ltd
- General Motors Company
- Dongfeng Motor Corporation
- Volkswagen AG
- Daimler AG (Mercedes-Benz AG)
- Tata Motors Limited
- BAIC Motor Corporation Ltd
- Volvo Group
- Mahindra & Mahindra Limited
- BYD Auto Co Ltd
- Saic General Motors Corporation Limited
- Groupe Renault
- Toyota Motor Corporation
- Rivian Automotive Inc
- Ford Motor Company
Key Developments in Commercial Vehicles Market Industry
- August 2023: General Motors will launch an all-electric Cadillac Escalade in late 2024. This launch signifies GM's commitment to electric vehicle technology in the luxury SUV segment, potentially impacting the competitive landscape.
- August 2023: General Motors doubles down on plans for an electric future in the Middle East. This expansion into a key growth market suggests increasing global demand for electric commercial vehicles.
- August 2023: Toyota Kirloskar Motor launched the all-new MPV Vellfire strong hybrid electric vehicle (SHEV) for a starting price of INR 11.99 Million and going to INR 12.99 Million. This reflects the increasing consumer interest in hybrid vehicles and signals a market shift towards more fuel-efficient options.
Strategic Outlook for Commercial Vehicles Market Market
The future of the commercial vehicles market is promising, driven by technological innovation, growing demand, and supportive government policies. The market is expected to witness sustained growth, propelled by increasing investments in electric and autonomous vehicle technologies. The focus on sustainability and emission reduction will continue to drive the adoption of cleaner fuel options. Emerging markets offer considerable untapped potential for growth, and companies will need to adapt to changing consumer preferences and competitive dynamics to succeed.
Commercial Vehicles Market Segmentation
-
1. Vehicle Type
-
1.1. Commercial Vehicles
- 1.1.1. Heavy-duty Commercial Trucks
- 1.1.2. Light Commercial Pick-up Trucks
- 1.1.3. Light Commercial Vans
- 1.1.4. Medium-duty Commercial Trucks
-
1.1. Commercial Vehicles
-
2. Propulsion Type
-
2.1. Hybrid and Electric Vehicles
-
2.1.1. By Fuel Category
- 2.1.1.1. BEV
- 2.1.1.2. FCEV
- 2.1.1.3. HEV
- 2.1.1.4. PHEV
-
2.1.1. By Fuel Category
-
2.2. ICE
- 2.2.1. CNG
- 2.2.2. Diesel
- 2.2.3. Gasoline
- 2.2.4. LPG
-
2.1. Hybrid and Electric Vehicles
Commercial Vehicles Market Segmentation By Geography
-
1. North America
- 1.1. United States
- 1.2. Canada
- 1.3. Mexico
-
2. South America
- 2.1. Brazil
- 2.2. Argentina
- 2.3. Rest of South America
-
3. Europe
- 3.1. United Kingdom
- 3.2. Germany
- 3.3. France
- 3.4. Italy
- 3.5. Spain
- 3.6. Russia
- 3.7. Benelux
- 3.8. Nordics
- 3.9. Rest of Europe
-
4. Middle East & Africa
- 4.1. Turkey
- 4.2. Israel
- 4.3. GCC
- 4.4. North Africa
- 4.5. South Africa
- 4.6. Rest of Middle East & Africa
-
5. Asia Pacific
- 5.1. China
- 5.2. India
- 5.3. Japan
- 5.4. South Korea
- 5.5. ASEAN
- 5.6. Oceania
- 5.7. Rest of Asia Pacific
Commercial Vehicles Market REPORT HIGHLIGHTS
| Aspects | Details |
|---|---|
| Study Period | 2019-2033 |
| Base Year | 2024 |
| Estimated Year | 2025 |
| Forecast Period | 2025-2033 |
| Historical Period | 2019-2024 |
| Growth Rate | CAGR of 10.55% from 2019-2033 |
| Segmentation |
|
Table of Contents
- 1. Introduction
- 1.1. Research Scope
- 1.2. Market Segmentation
- 1.3. Research Methodology
- 1.4. Definitions and Assumptions
- 2. Executive Summary
- 2.1. Introduction
- 3. Market Dynamics
- 3.1. Introduction
- 3.2. Market Drivers
- 3.2.1. Growing Travel and Tourism Industry is Driving the Car Rental Market
- 3.3. Market Restrains
- 3.3.1. Increasing Popularity of Ride-Sharing Services Pose Challenges for the Conventional Car Rental Market
- 3.4. Market Trends
- 3.4.1. OTHER KEY INDUSTRY TRENDS COVERED IN THE REPORT
- 4. Market Factor Analysis
- 4.1. Porters Five Forces
- 4.2. Supply/Value Chain
- 4.3. PESTEL analysis
- 4.4. Market Entropy
- 4.5. Patent/Trademark Analysis
- 5. Global Commercial Vehicles Market Analysis, Insights and Forecast, 2019-2031
- 5.1. Market Analysis, Insights and Forecast - by Vehicle Type
- 5.1.1. Commercial Vehicles
- 5.1.1.1. Heavy-duty Commercial Trucks
- 5.1.1.2. Light Commercial Pick-up Trucks
- 5.1.1.3. Light Commercial Vans
- 5.1.1.4. Medium-duty Commercial Trucks
- 5.1.1. Commercial Vehicles
- 5.2. Market Analysis, Insights and Forecast - by Propulsion Type
- 5.2.1. Hybrid and Electric Vehicles
- 5.2.1.1. By Fuel Category
- 5.2.1.1.1. BEV
- 5.2.1.1.2. FCEV
- 5.2.1.1.3. HEV
- 5.2.1.1.4. PHEV
- 5.2.1.1. By Fuel Category
- 5.2.2. ICE
- 5.2.2.1. CNG
- 5.2.2.2. Diesel
- 5.2.2.3. Gasoline
- 5.2.2.4. LPG
- 5.2.1. Hybrid and Electric Vehicles
- 5.3. Market Analysis, Insights and Forecast - by Region
- 5.3.1. North America
- 5.3.2. South America
- 5.3.3. Europe
- 5.3.4. Middle East & Africa
- 5.3.5. Asia Pacific
- 5.1. Market Analysis, Insights and Forecast - by Vehicle Type
- 6. North America Commercial Vehicles Market Analysis, Insights and Forecast, 2019-2031
- 6.1. Market Analysis, Insights and Forecast - by Vehicle Type
- 6.1.1. Commercial Vehicles
- 6.1.1.1. Heavy-duty Commercial Trucks
- 6.1.1.2. Light Commercial Pick-up Trucks
- 6.1.1.3. Light Commercial Vans
- 6.1.1.4. Medium-duty Commercial Trucks
- 6.1.1. Commercial Vehicles
- 6.2. Market Analysis, Insights and Forecast - by Propulsion Type
- 6.2.1. Hybrid and Electric Vehicles
- 6.2.1.1. By Fuel Category
- 6.2.1.1.1. BEV
- 6.2.1.1.2. FCEV
- 6.2.1.1.3. HEV
- 6.2.1.1.4. PHEV
- 6.2.1.1. By Fuel Category
- 6.2.2. ICE
- 6.2.2.1. CNG
- 6.2.2.2. Diesel
- 6.2.2.3. Gasoline
- 6.2.2.4. LPG
- 6.2.1. Hybrid and Electric Vehicles
- 6.1. Market Analysis, Insights and Forecast - by Vehicle Type
- 7. South America Commercial Vehicles Market Analysis, Insights and Forecast, 2019-2031
- 7.1. Market Analysis, Insights and Forecast - by Vehicle Type
- 7.1.1. Commercial Vehicles
- 7.1.1.1. Heavy-duty Commercial Trucks
- 7.1.1.2. Light Commercial Pick-up Trucks
- 7.1.1.3. Light Commercial Vans
- 7.1.1.4. Medium-duty Commercial Trucks
- 7.1.1. Commercial Vehicles
- 7.2. Market Analysis, Insights and Forecast - by Propulsion Type
- 7.2.1. Hybrid and Electric Vehicles
- 7.2.1.1. By Fuel Category
- 7.2.1.1.1. BEV
- 7.2.1.1.2. FCEV
- 7.2.1.1.3. HEV
- 7.2.1.1.4. PHEV
- 7.2.1.1. By Fuel Category
- 7.2.2. ICE
- 7.2.2.1. CNG
- 7.2.2.2. Diesel
- 7.2.2.3. Gasoline
- 7.2.2.4. LPG
- 7.2.1. Hybrid and Electric Vehicles
- 7.1. Market Analysis, Insights and Forecast - by Vehicle Type
- 8. Europe Commercial Vehicles Market Analysis, Insights and Forecast, 2019-2031
- 8.1. Market Analysis, Insights and Forecast - by Vehicle Type
- 8.1.1. Commercial Vehicles
- 8.1.1.1. Heavy-duty Commercial Trucks
- 8.1.1.2. Light Commercial Pick-up Trucks
- 8.1.1.3. Light Commercial Vans
- 8.1.1.4. Medium-duty Commercial Trucks
- 8.1.1. Commercial Vehicles
- 8.2. Market Analysis, Insights and Forecast - by Propulsion Type
- 8.2.1. Hybrid and Electric Vehicles
- 8.2.1.1. By Fuel Category
- 8.2.1.1.1. BEV
- 8.2.1.1.2. FCEV
- 8.2.1.1.3. HEV
- 8.2.1.1.4. PHEV
- 8.2.1.1. By Fuel Category
- 8.2.2. ICE
- 8.2.2.1. CNG
- 8.2.2.2. Diesel
- 8.2.2.3. Gasoline
- 8.2.2.4. LPG
- 8.2.1. Hybrid and Electric Vehicles
- 8.1. Market Analysis, Insights and Forecast - by Vehicle Type
- 9. Middle East & Africa Commercial Vehicles Market Analysis, Insights and Forecast, 2019-2031
- 9.1. Market Analysis, Insights and Forecast - by Vehicle Type
- 9.1.1. Commercial Vehicles
- 9.1.1.1. Heavy-duty Commercial Trucks
- 9.1.1.2. Light Commercial Pick-up Trucks
- 9.1.1.3. Light Commercial Vans
- 9.1.1.4. Medium-duty Commercial Trucks
- 9.1.1. Commercial Vehicles
- 9.2. Market Analysis, Insights and Forecast - by Propulsion Type
- 9.2.1. Hybrid and Electric Vehicles
- 9.2.1.1. By Fuel Category
- 9.2.1.1.1. BEV
- 9.2.1.1.2. FCEV
- 9.2.1.1.3. HEV
- 9.2.1.1.4. PHEV
- 9.2.1.1. By Fuel Category
- 9.2.2. ICE
- 9.2.2.1. CNG
- 9.2.2.2. Diesel
- 9.2.2.3. Gasoline
- 9.2.2.4. LPG
- 9.2.1. Hybrid and Electric Vehicles
- 9.1. Market Analysis, Insights and Forecast - by Vehicle Type
- 10. Asia Pacific Commercial Vehicles Market Analysis, Insights and Forecast, 2019-2031
- 10.1. Market Analysis, Insights and Forecast - by Vehicle Type
- 10.1.1. Commercial Vehicles
- 10.1.1.1. Heavy-duty Commercial Trucks
- 10.1.1.2. Light Commercial Pick-up Trucks
- 10.1.1.3. Light Commercial Vans
- 10.1.1.4. Medium-duty Commercial Trucks
- 10.1.1. Commercial Vehicles
- 10.2. Market Analysis, Insights and Forecast - by Propulsion Type
- 10.2.1. Hybrid and Electric Vehicles
- 10.2.1.1. By Fuel Category
- 10.2.1.1.1. BEV
- 10.2.1.1.2. FCEV
- 10.2.1.1.3. HEV
- 10.2.1.1.4. PHEV
- 10.2.1.1. By Fuel Category
- 10.2.2. ICE
- 10.2.2.1. CNG
- 10.2.2.2. Diesel
- 10.2.2.3. Gasoline
- 10.2.2.4. LPG
- 10.2.1. Hybrid and Electric Vehicles
- 10.1. Market Analysis, Insights and Forecast - by Vehicle Type
- 11. Competitive Analysis
- 11.1. Global Market Share Analysis 2024
- 11.2. Company Profiles
- 11.2.1 Scania AB
- 11.2.1.1. Overview
- 11.2.1.2. Products
- 11.2.1.3. SWOT Analysis
- 11.2.1.4. Recent Developments
- 11.2.1.5. Financials (Based on Availability)
- 11.2.2 Nissan Motor Co Ltd
- 11.2.2.1. Overview
- 11.2.2.2. Products
- 11.2.2.3. SWOT Analysis
- 11.2.2.4. Recent Developments
- 11.2.2.5. Financials (Based on Availability)
- 11.2.3 General Motors Company
- 11.2.3.1. Overview
- 11.2.3.2. Products
- 11.2.3.3. SWOT Analysis
- 11.2.3.4. Recent Developments
- 11.2.3.5. Financials (Based on Availability)
- 11.2.4 Dongfeng Motor Corporation
- 11.2.4.1. Overview
- 11.2.4.2. Products
- 11.2.4.3. SWOT Analysis
- 11.2.4.4. Recent Developments
- 11.2.4.5. Financials (Based on Availability)
- 11.2.5 Volkswagen AG
- 11.2.5.1. Overview
- 11.2.5.2. Products
- 11.2.5.3. SWOT Analysis
- 11.2.5.4. Recent Developments
- 11.2.5.5. Financials (Based on Availability)
- 11.2.6 Daimler AG (Mercedes-Benz AG)
- 11.2.6.1. Overview
- 11.2.6.2. Products
- 11.2.6.3. SWOT Analysis
- 11.2.6.4. Recent Developments
- 11.2.6.5. Financials (Based on Availability)
- 11.2.7 Tata Motors Limited
- 11.2.7.1. Overview
- 11.2.7.2. Products
- 11.2.7.3. SWOT Analysis
- 11.2.7.4. Recent Developments
- 11.2.7.5. Financials (Based on Availability)
- 11.2.8 BAIC Motor Corporation Ltd
- 11.2.8.1. Overview
- 11.2.8.2. Products
- 11.2.8.3. SWOT Analysis
- 11.2.8.4. Recent Developments
- 11.2.8.5. Financials (Based on Availability)
- 11.2.9 Volvo Grou
- 11.2.9.1. Overview
- 11.2.9.2. Products
- 11.2.9.3. SWOT Analysis
- 11.2.9.4. Recent Developments
- 11.2.9.5. Financials (Based on Availability)
- 11.2.10 Mahindra & Mahindra Limited
- 11.2.10.1. Overview
- 11.2.10.2. Products
- 11.2.10.3. SWOT Analysis
- 11.2.10.4. Recent Developments
- 11.2.10.5. Financials (Based on Availability)
- 11.2.11 BYD Auto Co Ltd
- 11.2.11.1. Overview
- 11.2.11.2. Products
- 11.2.11.3. SWOT Analysis
- 11.2.11.4. Recent Developments
- 11.2.11.5. Financials (Based on Availability)
- 11.2.12 Saic General Motors Corporation Limited
- 11.2.12.1. Overview
- 11.2.12.2. Products
- 11.2.12.3. SWOT Analysis
- 11.2.12.4. Recent Developments
- 11.2.12.5. Financials (Based on Availability)
- 11.2.13 Groupe Renault
- 11.2.13.1. Overview
- 11.2.13.2. Products
- 11.2.13.3. SWOT Analysis
- 11.2.13.4. Recent Developments
- 11.2.13.5. Financials (Based on Availability)
- 11.2.14 Toyota Motor Corporation
- 11.2.14.1. Overview
- 11.2.14.2. Products
- 11.2.14.3. SWOT Analysis
- 11.2.14.4. Recent Developments
- 11.2.14.5. Financials (Based on Availability)
- 11.2.15 Rivian Automotive Inc
- 11.2.15.1. Overview
- 11.2.15.2. Products
- 11.2.15.3. SWOT Analysis
- 11.2.15.4. Recent Developments
- 11.2.15.5. Financials (Based on Availability)
- 11.2.16 Ford Motor Company
- 11.2.16.1. Overview
- 11.2.16.2. Products
- 11.2.16.3. SWOT Analysis
- 11.2.16.4. Recent Developments
- 11.2.16.5. Financials (Based on Availability)
- 11.2.1 Scania AB
List of Figures
- Figure 1: Global Commercial Vehicles Market Revenue Breakdown (Million, %) by Region 2024 & 2032
- Figure 2: North America Commercial Vehicles Market Revenue (Million), by Vehicle Type 2024 & 2032
- Figure 3: North America Commercial Vehicles Market Revenue Share (%), by Vehicle Type 2024 & 2032
- Figure 4: North America Commercial Vehicles Market Revenue (Million), by Propulsion Type 2024 & 2032
- Figure 5: North America Commercial Vehicles Market Revenue Share (%), by Propulsion Type 2024 & 2032
- Figure 6: North America Commercial Vehicles Market Revenue (Million), by Country 2024 & 2032
- Figure 7: North America Commercial Vehicles Market Revenue Share (%), by Country 2024 & 2032
- Figure 8: South America Commercial Vehicles Market Revenue (Million), by Vehicle Type 2024 & 2032
- Figure 9: South America Commercial Vehicles Market Revenue Share (%), by Vehicle Type 2024 & 2032
- Figure 10: South America Commercial Vehicles Market Revenue (Million), by Propulsion Type 2024 & 2032
- Figure 11: South America Commercial Vehicles Market Revenue Share (%), by Propulsion Type 2024 & 2032
- Figure 12: South America Commercial Vehicles Market Revenue (Million), by Country 2024 & 2032
- Figure 13: South America Commercial Vehicles Market Revenue Share (%), by Country 2024 & 2032
- Figure 14: Europe Commercial Vehicles Market Revenue (Million), by Vehicle Type 2024 & 2032
- Figure 15: Europe Commercial Vehicles Market Revenue Share (%), by Vehicle Type 2024 & 2032
- Figure 16: Europe Commercial Vehicles Market Revenue (Million), by Propulsion Type 2024 & 2032
- Figure 17: Europe Commercial Vehicles Market Revenue Share (%), by Propulsion Type 2024 & 2032
- Figure 18: Europe Commercial Vehicles Market Revenue (Million), by Country 2024 & 2032
- Figure 19: Europe Commercial Vehicles Market Revenue Share (%), by Country 2024 & 2032
- Figure 20: Middle East & Africa Commercial Vehicles Market Revenue (Million), by Vehicle Type 2024 & 2032
- Figure 21: Middle East & Africa Commercial Vehicles Market Revenue Share (%), by Vehicle Type 2024 & 2032
- Figure 22: Middle East & Africa Commercial Vehicles Market Revenue (Million), by Propulsion Type 2024 & 2032
- Figure 23: Middle East & Africa Commercial Vehicles Market Revenue Share (%), by Propulsion Type 2024 & 2032
- Figure 24: Middle East & Africa Commercial Vehicles Market Revenue (Million), by Country 2024 & 2032
- Figure 25: Middle East & Africa Commercial Vehicles Market Revenue Share (%), by Country 2024 & 2032
- Figure 26: Asia Pacific Commercial Vehicles Market Revenue (Million), by Vehicle Type 2024 & 2032
- Figure 27: Asia Pacific Commercial Vehicles Market Revenue Share (%), by Vehicle Type 2024 & 2032
- Figure 28: Asia Pacific Commercial Vehicles Market Revenue (Million), by Propulsion Type 2024 & 2032
- Figure 29: Asia Pacific Commercial Vehicles Market Revenue Share (%), by Propulsion Type 2024 & 2032
- Figure 30: Asia Pacific Commercial Vehicles Market Revenue (Million), by Country 2024 & 2032
- Figure 31: Asia Pacific Commercial Vehicles Market Revenue Share (%), by Country 2024 & 2032
List of Tables
- Table 1: Global Commercial Vehicles Market Revenue Million Forecast, by Region 2019 & 2032
- Table 2: Global Commercial Vehicles Market Revenue Million Forecast, by Vehicle Type 2019 & 2032
- Table 3: Global Commercial Vehicles Market Revenue Million Forecast, by Propulsion Type 2019 & 2032
- Table 4: Global Commercial Vehicles Market Revenue Million Forecast, by Region 2019 & 2032
- Table 5: Global Commercial Vehicles Market Revenue Million Forecast, by Vehicle Type 2019 & 2032
- Table 6: Global Commercial Vehicles Market Revenue Million Forecast, by Propulsion Type 2019 & 2032
- Table 7: Global Commercial Vehicles Market Revenue Million Forecast, by Country 2019 & 2032
- Table 8: United States Commercial Vehicles Market Revenue (Million) Forecast, by Application 2019 & 2032
- Table 9: Canada Commercial Vehicles Market Revenue (Million) Forecast, by Application 2019 & 2032
- Table 10: Mexico Commercial Vehicles Market Revenue (Million) Forecast, by Application 2019 & 2032
- Table 11: Global Commercial Vehicles Market Revenue Million Forecast, by Vehicle Type 2019 & 2032
- Table 12: Global Commercial Vehicles Market Revenue Million Forecast, by Propulsion Type 2019 & 2032
- Table 13: Global Commercial Vehicles Market Revenue Million Forecast, by Country 2019 & 2032
- Table 14: Brazil Commercial Vehicles Market Revenue (Million) Forecast, by Application 2019 & 2032
- Table 15: Argentina Commercial Vehicles Market Revenue (Million) Forecast, by Application 2019 & 2032
- Table 16: Rest of South America Commercial Vehicles Market Revenue (Million) Forecast, by Application 2019 & 2032
- Table 17: Global Commercial Vehicles Market Revenue Million Forecast, by Vehicle Type 2019 & 2032
- Table 18: Global Commercial Vehicles Market Revenue Million Forecast, by Propulsion Type 2019 & 2032
- Table 19: Global Commercial Vehicles Market Revenue Million Forecast, by Country 2019 & 2032
- Table 20: United Kingdom Commercial Vehicles Market Revenue (Million) Forecast, by Application 2019 & 2032
- Table 21: Germany Commercial Vehicles Market Revenue (Million) Forecast, by Application 2019 & 2032
- Table 22: France Commercial Vehicles Market Revenue (Million) Forecast, by Application 2019 & 2032
- Table 23: Italy Commercial Vehicles Market Revenue (Million) Forecast, by Application 2019 & 2032
- Table 24: Spain Commercial Vehicles Market Revenue (Million) Forecast, by Application 2019 & 2032
- Table 25: Russia Commercial Vehicles Market Revenue (Million) Forecast, by Application 2019 & 2032
- Table 26: Benelux Commercial Vehicles Market Revenue (Million) Forecast, by Application 2019 & 2032
- Table 27: Nordics Commercial Vehicles Market Revenue (Million) Forecast, by Application 2019 & 2032
- Table 28: Rest of Europe Commercial Vehicles Market Revenue (Million) Forecast, by Application 2019 & 2032
- Table 29: Global Commercial Vehicles Market Revenue Million Forecast, by Vehicle Type 2019 & 2032
- Table 30: Global Commercial Vehicles Market Revenue Million Forecast, by Propulsion Type 2019 & 2032
- Table 31: Global Commercial Vehicles Market Revenue Million Forecast, by Country 2019 & 2032
- Table 32: Turkey Commercial Vehicles Market Revenue (Million) Forecast, by Application 2019 & 2032
- Table 33: Israel Commercial Vehicles Market Revenue (Million) Forecast, by Application 2019 & 2032
- Table 34: GCC Commercial Vehicles Market Revenue (Million) Forecast, by Application 2019 & 2032
- Table 35: North Africa Commercial Vehicles Market Revenue (Million) Forecast, by Application 2019 & 2032
- Table 36: South Africa Commercial Vehicles Market Revenue (Million) Forecast, by Application 2019 & 2032
- Table 37: Rest of Middle East & Africa Commercial Vehicles Market Revenue (Million) Forecast, by Application 2019 & 2032
- Table 38: Global Commercial Vehicles Market Revenue Million Forecast, by Vehicle Type 2019 & 2032
- Table 39: Global Commercial Vehicles Market Revenue Million Forecast, by Propulsion Type 2019 & 2032
- Table 40: Global Commercial Vehicles Market Revenue Million Forecast, by Country 2019 & 2032
- Table 41: China Commercial Vehicles Market Revenue (Million) Forecast, by Application 2019 & 2032
- Table 42: India Commercial Vehicles Market Revenue (Million) Forecast, by Application 2019 & 2032
- Table 43: Japan Commercial Vehicles Market Revenue (Million) Forecast, by Application 2019 & 2032
- Table 44: South Korea Commercial Vehicles Market Revenue (Million) Forecast, by Application 2019 & 2032
- Table 45: ASEAN Commercial Vehicles Market Revenue (Million) Forecast, by Application 2019 & 2032
- Table 46: Oceania Commercial Vehicles Market Revenue (Million) Forecast, by Application 2019 & 2032
- Table 47: Rest of Asia Pacific Commercial Vehicles Market Revenue (Million) Forecast, by Application 2019 & 2032
Frequently Asked Questions
1. What is the projected Compound Annual Growth Rate (CAGR) of the Commercial Vehicles Market?
The projected CAGR is approximately 10.55%.
2. Which companies are prominent players in the Commercial Vehicles Market?
Key companies in the market include Scania AB, Nissan Motor Co Ltd, General Motors Company, Dongfeng Motor Corporation, Volkswagen AG, Daimler AG (Mercedes-Benz AG), Tata Motors Limited, BAIC Motor Corporation Ltd, Volvo Grou, Mahindra & Mahindra Limited, BYD Auto Co Ltd, Saic General Motors Corporation Limited, Groupe Renault, Toyota Motor Corporation, Rivian Automotive Inc, Ford Motor Company.
3. What are the main segments of the Commercial Vehicles Market?
The market segments include Vehicle Type, Propulsion Type.
4. Can you provide details about the market size?
The market size is estimated to be USD XX Million as of 2022.
5. What are some drivers contributing to market growth?
Growing Travel and Tourism Industry is Driving the Car Rental Market.
6. What are the notable trends driving market growth?
OTHER KEY INDUSTRY TRENDS COVERED IN THE REPORT.
7. Are there any restraints impacting market growth?
Increasing Popularity of Ride-Sharing Services Pose Challenges for the Conventional Car Rental Market.
8. Can you provide examples of recent developments in the market?
August 2023: General Motors will launch an all-electric Cadillac Escalade in late 2024August 2023: General Motors doubles down on plans for an electric future in the Middle East.August 2023: Toyota Kirloskar Motor launched the all-new MPV Vellfire strong hybrid electric vehicle (SHEV) for a starting price of INR 11.99 million and going to INR 12.99 million.
9. What pricing options are available for accessing the report?
Pricing options include single-user, multi-user, and enterprise licenses priced at USD 3800, USD 4500, and USD 5800 respectively.
10. Is the market size provided in terms of value or volume?
The market size is provided in terms of value, measured in Million.
11. Are there any specific market keywords associated with the report?
Yes, the market keyword associated with the report is "Commercial Vehicles Market," which aids in identifying and referencing the specific market segment covered.
12. How do I determine which pricing option suits my needs best?
The pricing options vary based on user requirements and access needs. Individual users may opt for single-user licenses, while businesses requiring broader access may choose multi-user or enterprise licenses for cost-effective access to the report.
13. Are there any additional resources or data provided in the Commercial Vehicles Market report?
While the report offers comprehensive insights, it's advisable to review the specific contents or supplementary materials provided to ascertain if additional resources or data are available.
14. How can I stay updated on further developments or reports in the Commercial Vehicles Market?
To stay informed about further developments, trends, and reports in the Commercial Vehicles Market, consider subscribing to industry newsletters, following relevant companies and organizations, or regularly checking reputable industry news sources and publications.
Methodology
Step 1 - Identification of Relevant Samples Size from Population Database


Step 2 - Approaches for Defining Global Market Size (Value, Volume* & Price*)

Note*: In applicable scenarios
Step 3 - Data Sources
Primary Research
- Web Analytics
- Survey Reports
- Research Institute
- Latest Research Reports
- Opinion Leaders
Secondary Research
- Annual Reports
- White Paper
- Latest Press Release
- Industry Association
- Paid Database
- Investor Presentations

Step 4 - Data Triangulation
Involves using different sources of information in order to increase the validity of a study
These sources are likely to be stakeholders in a program - participants, other researchers, program staff, other community members, and so on.
Then we put all data in single framework & apply various statistical tools to find out the dynamic on the market.
During the analysis stage, feedback from the stakeholder groups would be compared to determine areas of agreement as well as areas of divergence


