
Key Insights
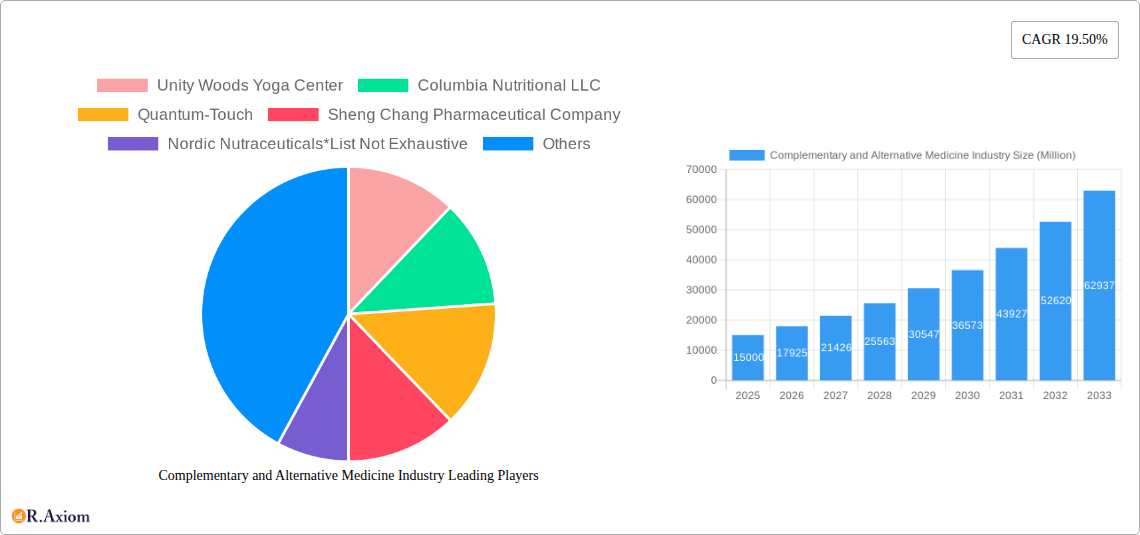
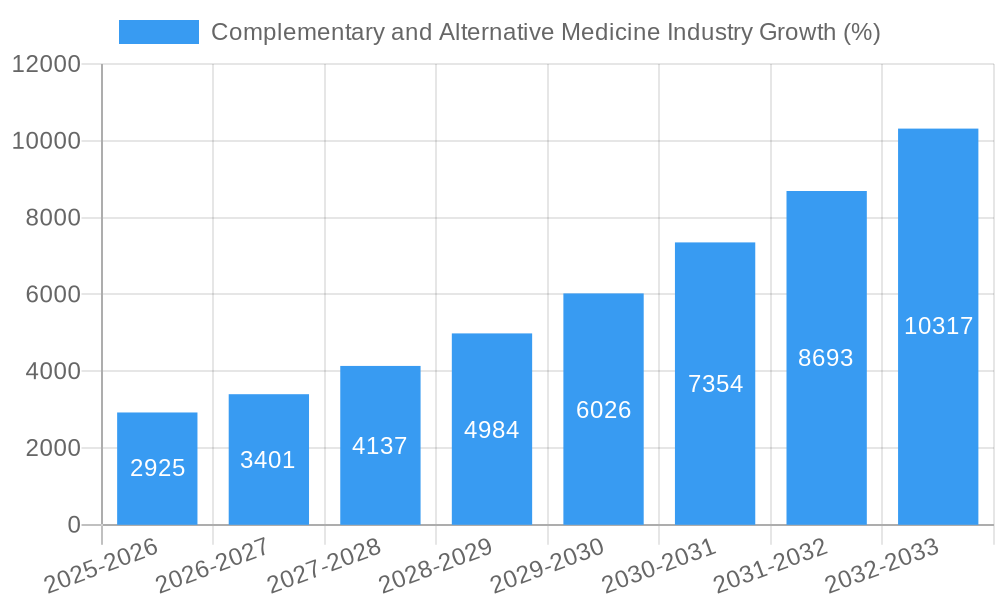
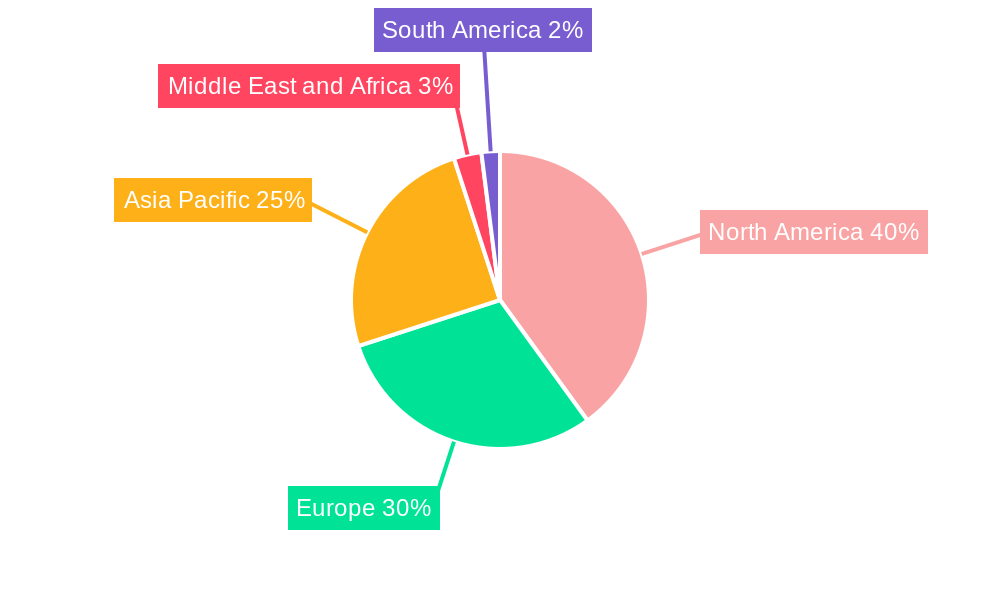
The Complementary and Alternative Medicine (CAM) industry is experiencing robust growth, projected to reach a significant market size by 2033. A Compound Annual Growth Rate (CAGR) of 19.50% from 2025 indicates a rapidly expanding market driven by several key factors. Increasing consumer awareness of the limitations of conventional medicine, a rising prevalence of chronic diseases like arthritis, cancer, and diabetes, and a growing preference for holistic and personalized healthcare solutions are major contributors to this growth. The shift towards preventative healthcare and a greater emphasis on wellness are also fueling demand for CAM therapies such as yoga, acupuncture, and herbal remedies. The diverse range of therapies offered, including body therapies (massage, chiropractic), mind therapies (meditation, mindfulness), and sensory therapies, caters to a wide spectrum of health needs and preferences. Market segmentation reveals significant opportunities across various applications, distribution channels (direct sales showing strong potential alongside the rise of online platforms), and therapy types. North America and Europe currently hold substantial market shares, but the Asia-Pacific region, particularly India and China, is poised for significant growth driven by rising disposable incomes and increasing adoption of CAM practices.
However, the industry also faces certain challenges. Regulatory hurdles and varying levels of acceptance by mainstream healthcare systems present obstacles to wider adoption. Ensuring quality control and standardization across the diverse range of CAM therapies is crucial for maintaining consumer trust and promoting sustainable growth. The industry must also adapt to address the evolving needs of consumers, leveraging technology and data analytics to enhance service delivery and personalize treatment plans. Furthermore, competition from established pharmaceutical companies expanding into complementary therapies and the need for robust clinical evidence to support the efficacy of certain CAM practices remain key considerations for future market development. Despite these challenges, the long-term outlook for the CAM industry remains positive, with continued growth driven by escalating demand for holistic and personalized healthcare solutions.
Complementary and Alternative Medicine Industry: A Comprehensive Market Report (2019-2033)
This in-depth report provides a comprehensive analysis of the Complementary and Alternative Medicine (CAM) industry, offering valuable insights for stakeholders, investors, and industry professionals. The report covers the period 2019-2033, with a focus on the forecast period 2025-2033, utilizing 2025 as the base and estimated year. The report projects a market valued at $xx Million in 2025, experiencing significant growth throughout the forecast period. This detailed analysis covers market concentration, innovation, dominant segments, key players, and emerging trends shaping the future of this dynamic industry.
Complementary and Alternative Medicine Industry Market Concentration & Innovation
The CAM industry exhibits a moderately fragmented landscape, with numerous players competing across various segments. Market share is distributed across large multinational corporations and smaller, specialized businesses. While precise market share data for individual companies requires further analysis, some significant players include Sheng Chang Pharmaceutical Company, Nordic Nutraceuticals, and Pure Encapsulations LLC. The industry witnesses continuous innovation driven by the increasing demand for holistic wellness solutions. Regulatory frameworks vary significantly across geographies, impacting product development and market entry. Several substitute products exist, such as conventional pharmaceuticals, posing a competitive threat. End-user preferences are constantly evolving, driven by factors such as rising healthcare costs, a growing focus on preventative care, and the increasing acceptance of CAM therapies. M&A activity is moderate, with deal values ranging from $xx Million to $xx Million in recent years, indicating industry consolidation and expansion efforts.
- Key Metrics:
- Market Concentration Ratio (CR4): xx% (Estimated)
- Average M&A Deal Value: $xx Million (2022-2024)
- Number of M&A Deals: xx (2022-2024)
Complementary and Alternative Medicine Industry Industry Trends & Insights
The CAM industry is experiencing robust growth, driven by several key factors. The increasing prevalence of chronic diseases, coupled with dissatisfaction with conventional treatments, fuels the demand for complementary therapies. Technological advancements, such as telehealth platforms and digital health tools, are expanding access to CAM services. Consumer preferences are shifting towards personalized and preventative healthcare solutions, aligning well with the holistic approach offered by CAM. Competitive dynamics are shaped by product differentiation, brand reputation, and the increasing integration of CAM practices into mainstream healthcare. The industry’s Compound Annual Growth Rate (CAGR) is estimated at xx% during the forecast period, while market penetration is projected to reach xx% by 2033.
Dominant Markets & Segments in Complementary and Alternative Medicine Industry
The global CAM market is geographically diverse, with significant growth witnessed in North America, Europe, and Asia-Pacific. Within these regions, specific countries exhibit higher adoption rates due to factors such as healthcare infrastructure, economic conditions, and cultural acceptance.
By Application: Arthritis and Cancer treatment segments currently dominate, driven by high prevalence rates and the significant unmet need for effective pain management and supportive care. Diabetes and Cardiovascular disease are also high-growth segments.
By Distribution Channel: Online sales are rapidly expanding, driven by increased internet penetration and the convenience offered by e-commerce platforms. Direct sales remain substantial, particularly for personalized treatments. Distance correspondence also contributes significantly to the market, expanding access to geographically dispersed consumers.
By Type: Traditional Alternative Therapeutics, including herbal remedies and acupuncture, hold the largest market share, owing to their long-standing use and cultural significance. Body therapies, such as massage and chiropractic, are experiencing substantial growth due to the increasing emphasis on wellness and stress reduction. Mind therapies like yoga and meditation are gaining popularity, driven by their positive effects on mental well-being. Sensory therapy is an emerging segment.
Key Drivers:
- Increasing prevalence of chronic diseases
- Rising healthcare costs
- Growing awareness of holistic wellness
- Technological advancements
- Favorable regulatory environments in some regions
Complementary and Alternative Medicine Industry Product Developments
Recent product innovations focus on combining traditional CAM therapies with modern technologies. For example, apps for guided meditation and virtual reality tools are integrating with traditional therapies. Products incorporating smart technology and data analytics are emerging, allowing for personalized treatment plans and improved outcomes. The market witnesses a continuous stream of new herbal remedies, supplements, and therapeutic devices catering to specific conditions and wellness goals. This focus on innovation and technological integration is driving competitive advantages for firms.
Report Scope & Segmentation Analysis
This report provides a detailed segmentation analysis of the CAM market across various categories.
- By Application: Arthritis, Cancer, Diabetes, Cardiovascular, Neurology, Other Applications. Each segment presents unique growth opportunities based on disease prevalence and treatment needs.
- By Distribution Channel: Direct Sales, Online Sales, Distance Correspondence. The online sales segment is showing the fastest growth, driven by e-commerce and digital marketing.
- By Type: Traditional Alternative Therapeutics, Body Therapy, Mind Therapy, Sensory Therapy, Other Types. The Traditional Alternative Therapeutics segment is the largest, but other therapy types are seeing rapid growth due to increased consumer awareness.
Each segment's growth projections, market sizes, and competitive dynamics are analyzed extensively within the report.
Key Drivers of Complementary and Alternative Medicine Industry Growth
Several key factors drive the growth of the CAM industry. Technological advancements, such as telemedicine and digital health platforms, enhance accessibility. Economic factors, including rising disposable incomes and increased healthcare expenditure, support market expansion. Favorable regulatory environments in some regions encourage market entry and growth. Increased consumer awareness of holistic wellness and the limitations of conventional medicine fuel the demand for CAM therapies. The development of new products combining traditional CAM approaches with modern technology further stimulates market expansion.
Challenges in the Complementary and Alternative Medicine Industry Sector
The CAM industry faces several challenges. Regulatory hurdles and varying standards across different countries create complexities for manufacturers and providers. Supply chain disruptions, especially those impacting herbal ingredients, can impact product availability and pricing. Intense competition from existing players and the emergence of new entrants necessitates continuous product innovation and effective marketing strategies. The lack of robust clinical evidence for some CAM therapies affects their acceptance within mainstream healthcare systems. These factors collectively restrain industry growth.
Emerging Opportunities in Complementary and Alternative Medicine Industry
Emerging opportunities abound in the CAM industry. Expanding into new markets, especially in developing countries with growing middle classes, offers significant potential. The development and integration of artificial intelligence (AI) and machine learning (ML) in diagnostic tools and personalized therapies present lucrative opportunities. Meeting growing consumer demand for preventative healthcare and personalized wellness solutions continues to drive innovation. Collaboration with conventional healthcare providers creates new avenues for integration and wider acceptance of CAM therapies.
Leading Players in the Complementary and Alternative Medicine Industry Market
- Unity Woods Yoga Center
- Columbia Nutritional LLC
- Quantum-Touch
- Sheng Chang Pharmaceutical Company
- Nordic Nutraceuticals
- Ramamani Iyengar Memorial Yoga Institute
- Pure encapsulations LLC
- Herb Pharm
- Yoga Tree Studios Inc
- John Schumacher Unity Woods Yoga Centre
- Healing Company Ltd
- Ayush Ayurvedic Pte Ltd
Key Developments in Complementary and Alternative Medicine Industry Industry
- December 2022: Adoratherapy launched its Alkemie Chakra Healing collection, expanding the aromatherapy product range and tapping into the growing interest in holistic wellness. This launch reflects the growing market for sensory-based therapies.
- October 2022: Coworth Park introduced a Hebridean sound treatment, highlighting the increasing popularity of sound therapy for relaxation and stress reduction. This development demonstrates the ongoing innovation within the mind therapy segment.
Strategic Outlook for Complementary and Alternative Medicine Industry Market
The CAM industry exhibits a positive outlook, driven by ongoing technological advancements, increased consumer awareness, and the growing integration of CAM into mainstream healthcare. Expanding product lines, exploring new markets, and strategic partnerships will be key to realizing the industry's full potential. The focus on personalized wellness and preventative healthcare will continue to shape product development and market growth, promising a dynamic and expanding market for the foreseeable future.
Complementary and Alternative Medicine Industry Segmentation
-
1. Type
- 1.1. Traditional Alternative Therapeutics
- 1.2. Body Therapy
- 1.3. Mind Therapy
- 1.4. Sensory Therapy
- 1.5. Other Types
-
2. Application
- 2.1. Arthritis
- 2.2. Cancer
- 2.3. Diabetes
- 2.4. Cardiovascular
- 2.5. Neurlogy
- 2.6. Other Applications
-
3. Distribution Channel
- 3.1. Direct Sales
- 3.2. Online Sales
- 3.3. Distance Correspondance
Complementary and Alternative Medicine Industry Segmentation By Geography
-
1. North America
- 1.1. United States
- 1.2. Canada
- 1.3. Mexico
-
2. Europe
- 2.1. Germany
- 2.2. United Kingdom
- 2.3. France
- 2.4. Italy
- 2.5. Spain
- 2.6. Rest of Europe
-
3. Asia Pacific
- 3.1. China
- 3.2. Japan
- 3.3. India
- 3.4. Australia
- 3.5. South Korea
- 3.6. Rest of Asia Pacific
-
4. Middle East and Africa
- 4.1. GCC
- 4.2. South Africa
- 4.3. Rest of Middle East and Africa
-
5. South America
- 5.1. Brazil
- 5.2. Argentina
- 5.3. Rest of South America
Complementary and Alternative Medicine Industry REPORT HIGHLIGHTS
| Aspects | Details |
|---|---|
| Study Period | 2019-2033 |
| Base Year | 2024 |
| Estimated Year | 2025 |
| Forecast Period | 2025-2033 |
| Historical Period | 2019-2024 |
| Growth Rate | CAGR of 19.50% from 2019-2033 |
| Segmentation |
|
Table of Contents
- 1. Introduction
- 1.1. Research Scope
- 1.2. Market Segmentation
- 1.3. Research Methodology
- 1.4. Definitions and Assumptions
- 2. Executive Summary
- 2.1. Introduction
- 3. Market Dynamics
- 3.1. Introduction
- 3.2. Market Drivers
- 3.2.1. Increasing Awareness About the Benefits of Complementary and Alternative Medicines; Growing Government Initiative and Growing Acceptance
- 3.3. Market Restrains
- 3.3.1. Lack of Proper Scientific Evidence and Less Understanding About Alternative Medicine
- 3.4. Market Trends
- 3.4.1. Cancer Is Expected to Hold a Significant Share Over the Forecast Period
- 4. Market Factor Analysis
- 4.1. Porters Five Forces
- 4.2. Supply/Value Chain
- 4.3. PESTEL analysis
- 4.4. Market Entropy
- 4.5. Patent/Trademark Analysis
- 5. Global Complementary and Alternative Medicine Industry Analysis, Insights and Forecast, 2019-2031
- 5.1. Market Analysis, Insights and Forecast - by Type
- 5.1.1. Traditional Alternative Therapeutics
- 5.1.2. Body Therapy
- 5.1.3. Mind Therapy
- 5.1.4. Sensory Therapy
- 5.1.5. Other Types
- 5.2. Market Analysis, Insights and Forecast - by Application
- 5.2.1. Arthritis
- 5.2.2. Cancer
- 5.2.3. Diabetes
- 5.2.4. Cardiovascular
- 5.2.5. Neurlogy
- 5.2.6. Other Applications
- 5.3. Market Analysis, Insights and Forecast - by Distribution Channel
- 5.3.1. Direct Sales
- 5.3.2. Online Sales
- 5.3.3. Distance Correspondance
- 5.4. Market Analysis, Insights and Forecast - by Region
- 5.4.1. North America
- 5.4.2. Europe
- 5.4.3. Asia Pacific
- 5.4.4. Middle East and Africa
- 5.4.5. South America
- 5.1. Market Analysis, Insights and Forecast - by Type
- 6. North America Complementary and Alternative Medicine Industry Analysis, Insights and Forecast, 2019-2031
- 6.1. Market Analysis, Insights and Forecast - by Type
- 6.1.1. Traditional Alternative Therapeutics
- 6.1.2. Body Therapy
- 6.1.3. Mind Therapy
- 6.1.4. Sensory Therapy
- 6.1.5. Other Types
- 6.2. Market Analysis, Insights and Forecast - by Application
- 6.2.1. Arthritis
- 6.2.2. Cancer
- 6.2.3. Diabetes
- 6.2.4. Cardiovascular
- 6.2.5. Neurlogy
- 6.2.6. Other Applications
- 6.3. Market Analysis, Insights and Forecast - by Distribution Channel
- 6.3.1. Direct Sales
- 6.3.2. Online Sales
- 6.3.3. Distance Correspondance
- 6.1. Market Analysis, Insights and Forecast - by Type
- 7. Europe Complementary and Alternative Medicine Industry Analysis, Insights and Forecast, 2019-2031
- 7.1. Market Analysis, Insights and Forecast - by Type
- 7.1.1. Traditional Alternative Therapeutics
- 7.1.2. Body Therapy
- 7.1.3. Mind Therapy
- 7.1.4. Sensory Therapy
- 7.1.5. Other Types
- 7.2. Market Analysis, Insights and Forecast - by Application
- 7.2.1. Arthritis
- 7.2.2. Cancer
- 7.2.3. Diabetes
- 7.2.4. Cardiovascular
- 7.2.5. Neurlogy
- 7.2.6. Other Applications
- 7.3. Market Analysis, Insights and Forecast - by Distribution Channel
- 7.3.1. Direct Sales
- 7.3.2. Online Sales
- 7.3.3. Distance Correspondance
- 7.1. Market Analysis, Insights and Forecast - by Type
- 8. Asia Pacific Complementary and Alternative Medicine Industry Analysis, Insights and Forecast, 2019-2031
- 8.1. Market Analysis, Insights and Forecast - by Type
- 8.1.1. Traditional Alternative Therapeutics
- 8.1.2. Body Therapy
- 8.1.3. Mind Therapy
- 8.1.4. Sensory Therapy
- 8.1.5. Other Types
- 8.2. Market Analysis, Insights and Forecast - by Application
- 8.2.1. Arthritis
- 8.2.2. Cancer
- 8.2.3. Diabetes
- 8.2.4. Cardiovascular
- 8.2.5. Neurlogy
- 8.2.6. Other Applications
- 8.3. Market Analysis, Insights and Forecast - by Distribution Channel
- 8.3.1. Direct Sales
- 8.3.2. Online Sales
- 8.3.3. Distance Correspondance
- 8.1. Market Analysis, Insights and Forecast - by Type
- 9. Middle East and Africa Complementary and Alternative Medicine Industry Analysis, Insights and Forecast, 2019-2031
- 9.1. Market Analysis, Insights and Forecast - by Type
- 9.1.1. Traditional Alternative Therapeutics
- 9.1.2. Body Therapy
- 9.1.3. Mind Therapy
- 9.1.4. Sensory Therapy
- 9.1.5. Other Types
- 9.2. Market Analysis, Insights and Forecast - by Application
- 9.2.1. Arthritis
- 9.2.2. Cancer
- 9.2.3. Diabetes
- 9.2.4. Cardiovascular
- 9.2.5. Neurlogy
- 9.2.6. Other Applications
- 9.3. Market Analysis, Insights and Forecast - by Distribution Channel
- 9.3.1. Direct Sales
- 9.3.2. Online Sales
- 9.3.3. Distance Correspondance
- 9.1. Market Analysis, Insights and Forecast - by Type
- 10. South America Complementary and Alternative Medicine Industry Analysis, Insights and Forecast, 2019-2031
- 10.1. Market Analysis, Insights and Forecast - by Type
- 10.1.1. Traditional Alternative Therapeutics
- 10.1.2. Body Therapy
- 10.1.3. Mind Therapy
- 10.1.4. Sensory Therapy
- 10.1.5. Other Types
- 10.2. Market Analysis, Insights and Forecast - by Application
- 10.2.1. Arthritis
- 10.2.2. Cancer
- 10.2.3. Diabetes
- 10.2.4. Cardiovascular
- 10.2.5. Neurlogy
- 10.2.6. Other Applications
- 10.3. Market Analysis, Insights and Forecast - by Distribution Channel
- 10.3.1. Direct Sales
- 10.3.2. Online Sales
- 10.3.3. Distance Correspondance
- 10.1. Market Analysis, Insights and Forecast - by Type
- 11. North America Complementary and Alternative Medicine Industry Analysis, Insights and Forecast, 2019-2031
- 11.1. Market Analysis, Insights and Forecast - By Country/Sub-region
- 11.1.1 United States
- 11.1.2 Canada
- 11.1.3 Mexico
- 12. Europe Complementary and Alternative Medicine Industry Analysis, Insights and Forecast, 2019-2031
- 12.1. Market Analysis, Insights and Forecast - By Country/Sub-region
- 12.1.1 Germany
- 12.1.2 United Kingdom
- 12.1.3 France
- 12.1.4 Italy
- 12.1.5 Spain
- 12.1.6 Rest of Europe
- 13. Asia Pacific Complementary and Alternative Medicine Industry Analysis, Insights and Forecast, 2019-2031
- 13.1. Market Analysis, Insights and Forecast - By Country/Sub-region
- 13.1.1 China
- 13.1.2 Japan
- 13.1.3 India
- 13.1.4 Australia
- 13.1.5 South Korea
- 13.1.6 Rest of Asia Pacific
- 14. Middle East and Africa Complementary and Alternative Medicine Industry Analysis, Insights and Forecast, 2019-2031
- 14.1. Market Analysis, Insights and Forecast - By Country/Sub-region
- 14.1.1 GCC
- 14.1.2 South Africa
- 14.1.3 Rest of Middle East and Africa
- 15. South America Complementary and Alternative Medicine Industry Analysis, Insights and Forecast, 2019-2031
- 15.1. Market Analysis, Insights and Forecast - By Country/Sub-region
- 15.1.1 Brazil
- 15.1.2 Argentina
- 15.1.3 Rest of South America
- 16. Competitive Analysis
- 16.1. Global Market Share Analysis 2024
- 16.2. Company Profiles
- 16.2.1 Unity Woods Yoga Center
- 16.2.1.1. Overview
- 16.2.1.2. Products
- 16.2.1.3. SWOT Analysis
- 16.2.1.4. Recent Developments
- 16.2.1.5. Financials (Based on Availability)
- 16.2.2 Columbia Nutritional LLC
- 16.2.2.1. Overview
- 16.2.2.2. Products
- 16.2.2.3. SWOT Analysis
- 16.2.2.4. Recent Developments
- 16.2.2.5. Financials (Based on Availability)
- 16.2.3 Quantum-Touch
- 16.2.3.1. Overview
- 16.2.3.2. Products
- 16.2.3.3. SWOT Analysis
- 16.2.3.4. Recent Developments
- 16.2.3.5. Financials (Based on Availability)
- 16.2.4 Sheng Chang Pharmaceutical Company
- 16.2.4.1. Overview
- 16.2.4.2. Products
- 16.2.4.3. SWOT Analysis
- 16.2.4.4. Recent Developments
- 16.2.4.5. Financials (Based on Availability)
- 16.2.5 Nordic Nutraceuticals*List Not Exhaustive
- 16.2.5.1. Overview
- 16.2.5.2. Products
- 16.2.5.3. SWOT Analysis
- 16.2.5.4. Recent Developments
- 16.2.5.5. Financials (Based on Availability)
- 16.2.6 Ramamani Iyengar Memorial Yoga Institute
- 16.2.6.1. Overview
- 16.2.6.2. Products
- 16.2.6.3. SWOT Analysis
- 16.2.6.4. Recent Developments
- 16.2.6.5. Financials (Based on Availability)
- 16.2.7 Pure encapsulations LLC
- 16.2.7.1. Overview
- 16.2.7.2. Products
- 16.2.7.3. SWOT Analysis
- 16.2.7.4. Recent Developments
- 16.2.7.5. Financials (Based on Availability)
- 16.2.8 Herb Pharm
- 16.2.8.1. Overview
- 16.2.8.2. Products
- 16.2.8.3. SWOT Analysis
- 16.2.8.4. Recent Developments
- 16.2.8.5. Financials (Based on Availability)
- 16.2.9 Yoga Tree Studios Inc
- 16.2.9.1. Overview
- 16.2.9.2. Products
- 16.2.9.3. SWOT Analysis
- 16.2.9.4. Recent Developments
- 16.2.9.5. Financials (Based on Availability)
- 16.2.10 John Schumacher Unity Woods Yoga Centre
- 16.2.10.1. Overview
- 16.2.10.2. Products
- 16.2.10.3. SWOT Analysis
- 16.2.10.4. Recent Developments
- 16.2.10.5. Financials (Based on Availability)
- 16.2.11 Healing Company Ltd
- 16.2.11.1. Overview
- 16.2.11.2. Products
- 16.2.11.3. SWOT Analysis
- 16.2.11.4. Recent Developments
- 16.2.11.5. Financials (Based on Availability)
- 16.2.12 Ayush Ayurvedic Pte Ltd
- 16.2.12.1. Overview
- 16.2.12.2. Products
- 16.2.12.3. SWOT Analysis
- 16.2.12.4. Recent Developments
- 16.2.12.5. Financials (Based on Availability)
- 16.2.1 Unity Woods Yoga Center
List of Figures
- Figure 1: Global Complementary and Alternative Medicine Industry Revenue Breakdown (Million, %) by Region 2024 & 2032
- Figure 2: North America Complementary and Alternative Medicine Industry Revenue (Million), by Country 2024 & 2032
- Figure 3: North America Complementary and Alternative Medicine Industry Revenue Share (%), by Country 2024 & 2032
- Figure 4: Europe Complementary and Alternative Medicine Industry Revenue (Million), by Country 2024 & 2032
- Figure 5: Europe Complementary and Alternative Medicine Industry Revenue Share (%), by Country 2024 & 2032
- Figure 6: Asia Pacific Complementary and Alternative Medicine Industry Revenue (Million), by Country 2024 & 2032
- Figure 7: Asia Pacific Complementary and Alternative Medicine Industry Revenue Share (%), by Country 2024 & 2032
- Figure 8: Middle East and Africa Complementary and Alternative Medicine Industry Revenue (Million), by Country 2024 & 2032
- Figure 9: Middle East and Africa Complementary and Alternative Medicine Industry Revenue Share (%), by Country 2024 & 2032
- Figure 10: South America Complementary and Alternative Medicine Industry Revenue (Million), by Country 2024 & 2032
- Figure 11: South America Complementary and Alternative Medicine Industry Revenue Share (%), by Country 2024 & 2032
- Figure 12: North America Complementary and Alternative Medicine Industry Revenue (Million), by Type 2024 & 2032
- Figure 13: North America Complementary and Alternative Medicine Industry Revenue Share (%), by Type 2024 & 2032
- Figure 14: North America Complementary and Alternative Medicine Industry Revenue (Million), by Application 2024 & 2032
- Figure 15: North America Complementary and Alternative Medicine Industry Revenue Share (%), by Application 2024 & 2032
- Figure 16: North America Complementary and Alternative Medicine Industry Revenue (Million), by Distribution Channel 2024 & 2032
- Figure 17: North America Complementary and Alternative Medicine Industry Revenue Share (%), by Distribution Channel 2024 & 2032
- Figure 18: North America Complementary and Alternative Medicine Industry Revenue (Million), by Country 2024 & 2032
- Figure 19: North America Complementary and Alternative Medicine Industry Revenue Share (%), by Country 2024 & 2032
- Figure 20: Europe Complementary and Alternative Medicine Industry Revenue (Million), by Type 2024 & 2032
- Figure 21: Europe Complementary and Alternative Medicine Industry Revenue Share (%), by Type 2024 & 2032
- Figure 22: Europe Complementary and Alternative Medicine Industry Revenue (Million), by Application 2024 & 2032
- Figure 23: Europe Complementary and Alternative Medicine Industry Revenue Share (%), by Application 2024 & 2032
- Figure 24: Europe Complementary and Alternative Medicine Industry Revenue (Million), by Distribution Channel 2024 & 2032
- Figure 25: Europe Complementary and Alternative Medicine Industry Revenue Share (%), by Distribution Channel 2024 & 2032
- Figure 26: Europe Complementary and Alternative Medicine Industry Revenue (Million), by Country 2024 & 2032
- Figure 27: Europe Complementary and Alternative Medicine Industry Revenue Share (%), by Country 2024 & 2032
- Figure 28: Asia Pacific Complementary and Alternative Medicine Industry Revenue (Million), by Type 2024 & 2032
- Figure 29: Asia Pacific Complementary and Alternative Medicine Industry Revenue Share (%), by Type 2024 & 2032
- Figure 30: Asia Pacific Complementary and Alternative Medicine Industry Revenue (Million), by Application 2024 & 2032
- Figure 31: Asia Pacific Complementary and Alternative Medicine Industry Revenue Share (%), by Application 2024 & 2032
- Figure 32: Asia Pacific Complementary and Alternative Medicine Industry Revenue (Million), by Distribution Channel 2024 & 2032
- Figure 33: Asia Pacific Complementary and Alternative Medicine Industry Revenue Share (%), by Distribution Channel 2024 & 2032
- Figure 34: Asia Pacific Complementary and Alternative Medicine Industry Revenue (Million), by Country 2024 & 2032
- Figure 35: Asia Pacific Complementary and Alternative Medicine Industry Revenue Share (%), by Country 2024 & 2032
- Figure 36: Middle East and Africa Complementary and Alternative Medicine Industry Revenue (Million), by Type 2024 & 2032
- Figure 37: Middle East and Africa Complementary and Alternative Medicine Industry Revenue Share (%), by Type 2024 & 2032
- Figure 38: Middle East and Africa Complementary and Alternative Medicine Industry Revenue (Million), by Application 2024 & 2032
- Figure 39: Middle East and Africa Complementary and Alternative Medicine Industry Revenue Share (%), by Application 2024 & 2032
- Figure 40: Middle East and Africa Complementary and Alternative Medicine Industry Revenue (Million), by Distribution Channel 2024 & 2032
- Figure 41: Middle East and Africa Complementary and Alternative Medicine Industry Revenue Share (%), by Distribution Channel 2024 & 2032
- Figure 42: Middle East and Africa Complementary and Alternative Medicine Industry Revenue (Million), by Country 2024 & 2032
- Figure 43: Middle East and Africa Complementary and Alternative Medicine Industry Revenue Share (%), by Country 2024 & 2032
- Figure 44: South America Complementary and Alternative Medicine Industry Revenue (Million), by Type 2024 & 2032
- Figure 45: South America Complementary and Alternative Medicine Industry Revenue Share (%), by Type 2024 & 2032
- Figure 46: South America Complementary and Alternative Medicine Industry Revenue (Million), by Application 2024 & 2032
- Figure 47: South America Complementary and Alternative Medicine Industry Revenue Share (%), by Application 2024 & 2032
- Figure 48: South America Complementary and Alternative Medicine Industry Revenue (Million), by Distribution Channel 2024 & 2032
- Figure 49: South America Complementary and Alternative Medicine Industry Revenue Share (%), by Distribution Channel 2024 & 2032
- Figure 50: South America Complementary and Alternative Medicine Industry Revenue (Million), by Country 2024 & 2032
- Figure 51: South America Complementary and Alternative Medicine Industry Revenue Share (%), by Country 2024 & 2032
List of Tables
- Table 1: Global Complementary and Alternative Medicine Industry Revenue Million Forecast, by Region 2019 & 2032
- Table 2: Global Complementary and Alternative Medicine Industry Revenue Million Forecast, by Type 2019 & 2032
- Table 3: Global Complementary and Alternative Medicine Industry Revenue Million Forecast, by Application 2019 & 2032
- Table 4: Global Complementary and Alternative Medicine Industry Revenue Million Forecast, by Distribution Channel 2019 & 2032
- Table 5: Global Complementary and Alternative Medicine Industry Revenue Million Forecast, by Region 2019 & 2032
- Table 6: Global Complementary and Alternative Medicine Industry Revenue Million Forecast, by Country 2019 & 2032
- Table 7: United States Complementary and Alternative Medicine Industry Revenue (Million) Forecast, by Application 2019 & 2032
- Table 8: Canada Complementary and Alternative Medicine Industry Revenue (Million) Forecast, by Application 2019 & 2032
- Table 9: Mexico Complementary and Alternative Medicine Industry Revenue (Million) Forecast, by Application 2019 & 2032
- Table 10: Global Complementary and Alternative Medicine Industry Revenue Million Forecast, by Country 2019 & 2032
- Table 11: Germany Complementary and Alternative Medicine Industry Revenue (Million) Forecast, by Application 2019 & 2032
- Table 12: United Kingdom Complementary and Alternative Medicine Industry Revenue (Million) Forecast, by Application 2019 & 2032
- Table 13: France Complementary and Alternative Medicine Industry Revenue (Million) Forecast, by Application 2019 & 2032
- Table 14: Italy Complementary and Alternative Medicine Industry Revenue (Million) Forecast, by Application 2019 & 2032
- Table 15: Spain Complementary and Alternative Medicine Industry Revenue (Million) Forecast, by Application 2019 & 2032
- Table 16: Rest of Europe Complementary and Alternative Medicine Industry Revenue (Million) Forecast, by Application 2019 & 2032
- Table 17: Global Complementary and Alternative Medicine Industry Revenue Million Forecast, by Country 2019 & 2032
- Table 18: China Complementary and Alternative Medicine Industry Revenue (Million) Forecast, by Application 2019 & 2032
- Table 19: Japan Complementary and Alternative Medicine Industry Revenue (Million) Forecast, by Application 2019 & 2032
- Table 20: India Complementary and Alternative Medicine Industry Revenue (Million) Forecast, by Application 2019 & 2032
- Table 21: Australia Complementary and Alternative Medicine Industry Revenue (Million) Forecast, by Application 2019 & 2032
- Table 22: South Korea Complementary and Alternative Medicine Industry Revenue (Million) Forecast, by Application 2019 & 2032
- Table 23: Rest of Asia Pacific Complementary and Alternative Medicine Industry Revenue (Million) Forecast, by Application 2019 & 2032
- Table 24: Global Complementary and Alternative Medicine Industry Revenue Million Forecast, by Country 2019 & 2032
- Table 25: GCC Complementary and Alternative Medicine Industry Revenue (Million) Forecast, by Application 2019 & 2032
- Table 26: South Africa Complementary and Alternative Medicine Industry Revenue (Million) Forecast, by Application 2019 & 2032
- Table 27: Rest of Middle East and Africa Complementary and Alternative Medicine Industry Revenue (Million) Forecast, by Application 2019 & 2032
- Table 28: Global Complementary and Alternative Medicine Industry Revenue Million Forecast, by Country 2019 & 2032
- Table 29: Brazil Complementary and Alternative Medicine Industry Revenue (Million) Forecast, by Application 2019 & 2032
- Table 30: Argentina Complementary and Alternative Medicine Industry Revenue (Million) Forecast, by Application 2019 & 2032
- Table 31: Rest of South America Complementary and Alternative Medicine Industry Revenue (Million) Forecast, by Application 2019 & 2032
- Table 32: Global Complementary and Alternative Medicine Industry Revenue Million Forecast, by Type 2019 & 2032
- Table 33: Global Complementary and Alternative Medicine Industry Revenue Million Forecast, by Application 2019 & 2032
- Table 34: Global Complementary and Alternative Medicine Industry Revenue Million Forecast, by Distribution Channel 2019 & 2032
- Table 35: Global Complementary and Alternative Medicine Industry Revenue Million Forecast, by Country 2019 & 2032
- Table 36: United States Complementary and Alternative Medicine Industry Revenue (Million) Forecast, by Application 2019 & 2032
- Table 37: Canada Complementary and Alternative Medicine Industry Revenue (Million) Forecast, by Application 2019 & 2032
- Table 38: Mexico Complementary and Alternative Medicine Industry Revenue (Million) Forecast, by Application 2019 & 2032
- Table 39: Global Complementary and Alternative Medicine Industry Revenue Million Forecast, by Type 2019 & 2032
- Table 40: Global Complementary and Alternative Medicine Industry Revenue Million Forecast, by Application 2019 & 2032
- Table 41: Global Complementary and Alternative Medicine Industry Revenue Million Forecast, by Distribution Channel 2019 & 2032
- Table 42: Global Complementary and Alternative Medicine Industry Revenue Million Forecast, by Country 2019 & 2032
- Table 43: Germany Complementary and Alternative Medicine Industry Revenue (Million) Forecast, by Application 2019 & 2032
- Table 44: United Kingdom Complementary and Alternative Medicine Industry Revenue (Million) Forecast, by Application 2019 & 2032
- Table 45: France Complementary and Alternative Medicine Industry Revenue (Million) Forecast, by Application 2019 & 2032
- Table 46: Italy Complementary and Alternative Medicine Industry Revenue (Million) Forecast, by Application 2019 & 2032
- Table 47: Spain Complementary and Alternative Medicine Industry Revenue (Million) Forecast, by Application 2019 & 2032
- Table 48: Rest of Europe Complementary and Alternative Medicine Industry Revenue (Million) Forecast, by Application 2019 & 2032
- Table 49: Global Complementary and Alternative Medicine Industry Revenue Million Forecast, by Type 2019 & 2032
- Table 50: Global Complementary and Alternative Medicine Industry Revenue Million Forecast, by Application 2019 & 2032
- Table 51: Global Complementary and Alternative Medicine Industry Revenue Million Forecast, by Distribution Channel 2019 & 2032
- Table 52: Global Complementary and Alternative Medicine Industry Revenue Million Forecast, by Country 2019 & 2032
- Table 53: China Complementary and Alternative Medicine Industry Revenue (Million) Forecast, by Application 2019 & 2032
- Table 54: Japan Complementary and Alternative Medicine Industry Revenue (Million) Forecast, by Application 2019 & 2032
- Table 55: India Complementary and Alternative Medicine Industry Revenue (Million) Forecast, by Application 2019 & 2032
- Table 56: Australia Complementary and Alternative Medicine Industry Revenue (Million) Forecast, by Application 2019 & 2032
- Table 57: South Korea Complementary and Alternative Medicine Industry Revenue (Million) Forecast, by Application 2019 & 2032
- Table 58: Rest of Asia Pacific Complementary and Alternative Medicine Industry Revenue (Million) Forecast, by Application 2019 & 2032
- Table 59: Global Complementary and Alternative Medicine Industry Revenue Million Forecast, by Type 2019 & 2032
- Table 60: Global Complementary and Alternative Medicine Industry Revenue Million Forecast, by Application 2019 & 2032
- Table 61: Global Complementary and Alternative Medicine Industry Revenue Million Forecast, by Distribution Channel 2019 & 2032
- Table 62: Global Complementary and Alternative Medicine Industry Revenue Million Forecast, by Country 2019 & 2032
- Table 63: GCC Complementary and Alternative Medicine Industry Revenue (Million) Forecast, by Application 2019 & 2032
- Table 64: South Africa Complementary and Alternative Medicine Industry Revenue (Million) Forecast, by Application 2019 & 2032
- Table 65: Rest of Middle East and Africa Complementary and Alternative Medicine Industry Revenue (Million) Forecast, by Application 2019 & 2032
- Table 66: Global Complementary and Alternative Medicine Industry Revenue Million Forecast, by Type 2019 & 2032
- Table 67: Global Complementary and Alternative Medicine Industry Revenue Million Forecast, by Application 2019 & 2032
- Table 68: Global Complementary and Alternative Medicine Industry Revenue Million Forecast, by Distribution Channel 2019 & 2032
- Table 69: Global Complementary and Alternative Medicine Industry Revenue Million Forecast, by Country 2019 & 2032
- Table 70: Brazil Complementary and Alternative Medicine Industry Revenue (Million) Forecast, by Application 2019 & 2032
- Table 71: Argentina Complementary and Alternative Medicine Industry Revenue (Million) Forecast, by Application 2019 & 2032
- Table 72: Rest of South America Complementary and Alternative Medicine Industry Revenue (Million) Forecast, by Application 2019 & 2032
Frequently Asked Questions
1. What is the projected Compound Annual Growth Rate (CAGR) of the Complementary and Alternative Medicine Industry?
The projected CAGR is approximately 19.50%.
2. Which companies are prominent players in the Complementary and Alternative Medicine Industry?
Key companies in the market include Unity Woods Yoga Center, Columbia Nutritional LLC, Quantum-Touch, Sheng Chang Pharmaceutical Company, Nordic Nutraceuticals*List Not Exhaustive, Ramamani Iyengar Memorial Yoga Institute, Pure encapsulations LLC, Herb Pharm, Yoga Tree Studios Inc, John Schumacher Unity Woods Yoga Centre, Healing Company Ltd, Ayush Ayurvedic Pte Ltd.
3. What are the main segments of the Complementary and Alternative Medicine Industry?
The market segments include Type, Application, Distribution Channel.
4. Can you provide details about the market size?
The market size is estimated to be USD XX Million as of 2022.
5. What are some drivers contributing to market growth?
Increasing Awareness About the Benefits of Complementary and Alternative Medicines; Growing Government Initiative and Growing Acceptance.
6. What are the notable trends driving market growth?
Cancer Is Expected to Hold a Significant Share Over the Forecast Period.
7. Are there any restraints impacting market growth?
Lack of Proper Scientific Evidence and Less Understanding About Alternative Medicine.
8. Can you provide examples of recent developments in the market?
December 2022: Adoratherapy launched its Alkemie Chakra Healing collection, featuring aroma perfume sprays, dry touch body oils, body lotions, and lotion candles all with the same scents. The scents were formulated to balance and heal using aromatherapy principles, in which essential oils are active ingredients.
9. What pricing options are available for accessing the report?
Pricing options include single-user, multi-user, and enterprise licenses priced at USD 4750, USD 5250, and USD 8750 respectively.
10. Is the market size provided in terms of value or volume?
The market size is provided in terms of value, measured in Million.
11. Are there any specific market keywords associated with the report?
Yes, the market keyword associated with the report is "Complementary and Alternative Medicine Industry," which aids in identifying and referencing the specific market segment covered.
12. How do I determine which pricing option suits my needs best?
The pricing options vary based on user requirements and access needs. Individual users may opt for single-user licenses, while businesses requiring broader access may choose multi-user or enterprise licenses for cost-effective access to the report.
13. Are there any additional resources or data provided in the Complementary and Alternative Medicine Industry report?
While the report offers comprehensive insights, it's advisable to review the specific contents or supplementary materials provided to ascertain if additional resources or data are available.
14. How can I stay updated on further developments or reports in the Complementary and Alternative Medicine Industry?
To stay informed about further developments, trends, and reports in the Complementary and Alternative Medicine Industry, consider subscribing to industry newsletters, following relevant companies and organizations, or regularly checking reputable industry news sources and publications.
Methodology
Step 1 - Identification of Relevant Samples Size from Population Database


Step 2 - Approaches for Defining Global Market Size (Value, Volume* & Price*)

Note*: In applicable scenarios
Step 3 - Data Sources
Primary Research
- Web Analytics
- Survey Reports
- Research Institute
- Latest Research Reports
- Opinion Leaders
Secondary Research
- Annual Reports
- White Paper
- Latest Press Release
- Industry Association
- Paid Database
- Investor Presentations

Step 4 - Data Triangulation
Involves using different sources of information in order to increase the validity of a study
These sources are likely to be stakeholders in a program - participants, other researchers, program staff, other community members, and so on.
Then we put all data in single framework & apply various statistical tools to find out the dynamic on the market.
During the analysis stage, feedback from the stakeholder groups would be compared to determine areas of agreement as well as areas of divergence


