

Key Insights
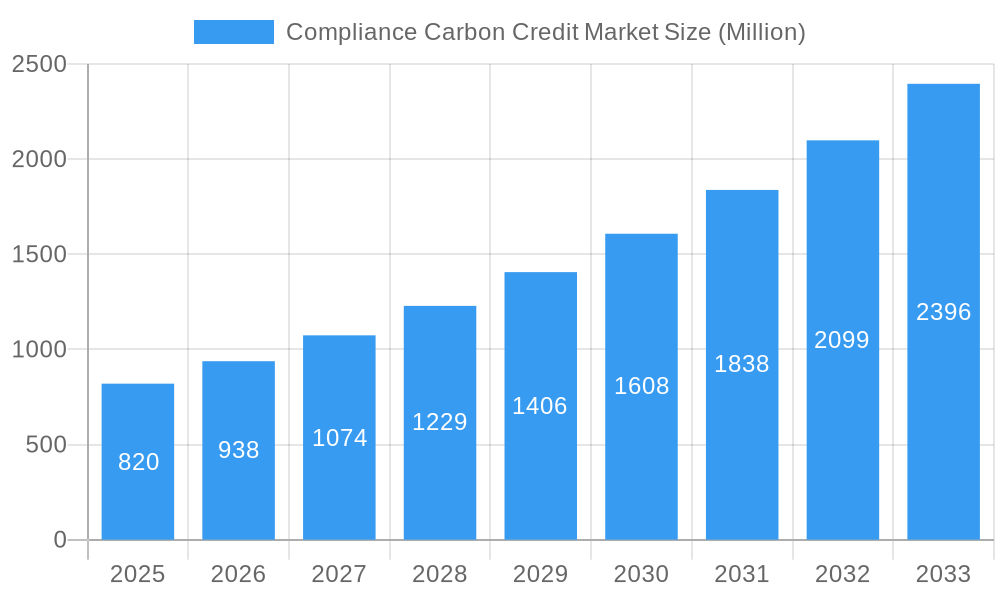
The compliance carbon credit market, valued at $820 million in 2025, is experiencing robust growth, projected to expand at a Compound Annual Growth Rate (CAGR) of 14.81% from 2025 to 2033. This expansion is driven by increasing regulatory pressure on industries to reduce their carbon footprint, particularly within the energy, transportation, and industrial sectors. The growing awareness of climate change and the escalating frequency of extreme weather events are further bolstering demand for compliance carbon credits. Renewable energy projects, energy efficiency improvements, and forestry initiatives are key contributors to the credit supply. While the market faces restraints such as the complexities of verification and auditing processes, and potential inconsistencies in credit quality across different standards and methodologies, these challenges are being actively addressed through technological innovations and standardization efforts. The market's segmentation by credit type and sector allows for targeted investment and policy intervention to optimize emission reductions in the most impactful areas. North America and Europe currently hold significant market shares, but the Asia-Pacific region is expected to witness substantial growth fueled by increasing industrialization and government-led climate initiatives. Key players in the market, such as Shell New Energies, ClimateCare, and Natural Capital Partners, are continuously expanding their operations and developing innovative solutions to meet the rising demand for high-quality carbon credits. The continued development and refinement of carbon offsetting methodologies and market regulations will be pivotal in driving further market growth and ensuring environmental integrity.
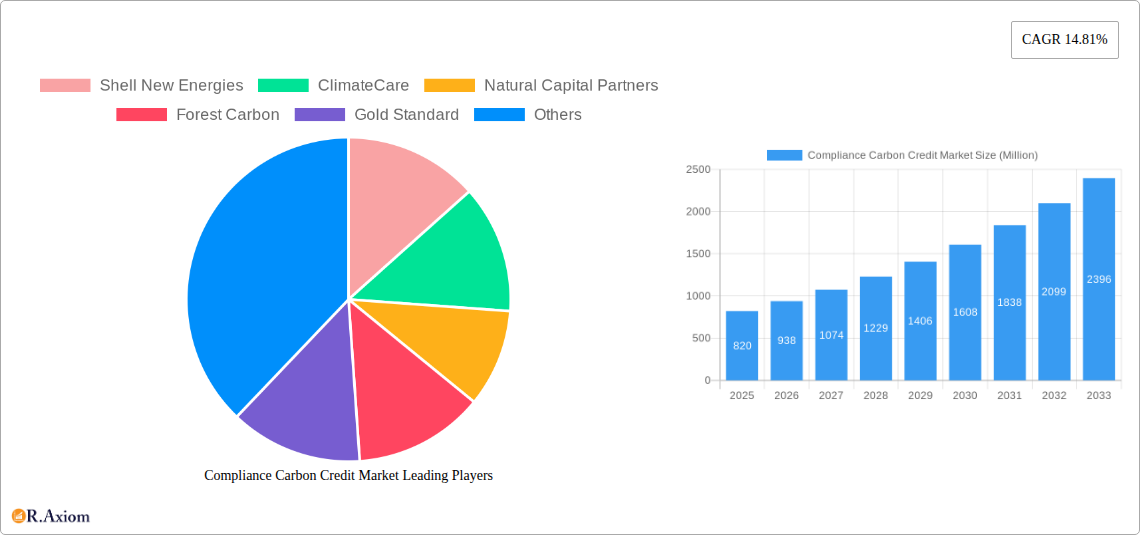
Compliance Carbon Credit Market Market Size (In Million)
The forecast period (2025-2033) promises considerable growth, particularly in regions with strong commitments to emission reduction targets. This includes accelerated adoption of renewable energy technologies and increased investments in sustainable practices across various sectors. While challenges remain regarding the accurate measurement and quantification of carbon emissions, continued technological advancement and collaborative efforts across stakeholders are addressing these issues. The increasing integration of carbon pricing mechanisms and stricter compliance regulations within national and international frameworks is expected to further stimulate the demand for compliance carbon credits. The market's overall trajectory signifies a critical shift towards a more sustainable global economy, underpinned by the growing recognition of the economic and environmental benefits of effective carbon emission reduction strategies.
Compliance Carbon Credit Market Company Market Share
This comprehensive report provides an in-depth analysis of the Compliance Carbon Credit Market, encompassing historical data (2019-2024), current estimations (2025), and future projections (2025-2033). The study covers market size, segmentation, key players, industry trends, and future growth opportunities, offering invaluable insights for industry stakeholders, investors, and policymakers. The total market value is projected to reach xx Million by 2033.
Compliance Carbon Credit Market Market Concentration & Innovation
This section analyzes the level of market concentration, identifying key players and their market shares. We explore the drivers of innovation within the sector, examining technological advancements and regulatory influences. The analysis also includes a review of regulatory frameworks, substitute products, end-user trends, and recent mergers and acquisitions (M&A) activity.
- Market Concentration: The market exhibits a moderately concentrated structure, with a few major players holding significant market share. Shell New Energies, ClimateCare, Natural Capital Partners, and Forest Carbon collectively account for approximately xx% of the market in 2025 (estimated). Smaller players, including 3Degrees, Carbon Trust, South Pole, Atmosfair, and seven other unnamed companies, contribute to the remaining market share. This concentration is expected to evolve as the market matures.
- Innovation Drivers: Technological advancements in carbon monitoring, verification, and trading platforms are driving innovation. Stringent environmental regulations and increasing corporate sustainability initiatives also play significant roles.
- Regulatory Frameworks: Government regulations, such as carbon pricing mechanisms and emission reduction targets, significantly impact market dynamics. Changes in these regulations can directly influence market growth and investment. The proposed guidance from the CFTC on VCC derivatives (January 2024) represents a key regulatory development.
- M&A Activity: The market has seen notable M&A activity in recent years, with deal values reaching xx Million in 2024 (estimated). These activities reflect the increasing consolidation within the industry and efforts to expand market reach and technological capabilities. Further analysis of specific deals and their impact will be included in the full report.
- Product Substitutes: While there are no direct substitutes for compliance carbon credits, alternative strategies such as internal emission reduction programs or investment in renewable energy can indirectly compete with carbon credit purchases.
- End-User Trends: Growing corporate social responsibility (CSR) initiatives and a heightened awareness of environmental, social, and governance (ESG) factors are driving demand for compliance carbon credits among diverse end-user sectors.
Compliance Carbon Credit Market Industry Trends & Insights
This section delves into the key trends shaping the Compliance Carbon Credit Market. We analyze market growth drivers, technological advancements, shifting consumer preferences, and the competitive landscape. Quantitative data, including the Compound Annual Growth Rate (CAGR) and market penetration rates, will be presented to support the qualitative analysis.
The market is experiencing significant growth, driven by increasing global awareness of climate change, stricter environmental regulations, and rising corporate demand for carbon offsetting solutions. Technological advancements in carbon accounting, monitoring, and verification methods are streamlining the carbon credit trading process and enhancing transparency. Furthermore, evolving consumer preferences towards sustainable products and services are creating substantial demand for environmentally responsible businesses, accelerating the adoption of carbon credit programs. The competitive landscape remains dynamic, with existing players continually seeking to innovate and expand their offerings to maintain a competitive edge. The projected CAGR for the period 2025-2033 is estimated to be xx%. Market penetration is anticipated to reach xx% by 2033. The detailed analysis of each influencing factor, including quantitative data, will be found in the full report.
Dominant Markets & Segments in Compliance Carbon Credit Market
This section identifies the leading regions, countries, and market segments within the Compliance Carbon Credit Market, providing a detailed analysis of their dominance. The analysis will cover both “By Type of Credits” and “By Sector”.
By Type of Credits:
- Renewable Energy Projects: This segment is expected to maintain significant dominance due to the increasing deployment of renewable energy sources globally. Key drivers include supportive government policies, decreasing renewable energy costs, and rising demand for clean energy.
- Forestry and Land Use: This segment is growing rapidly, driven by increasing awareness of deforestation's impact on climate change and the development of robust carbon accounting methodologies. Government incentives and international agreements contribute significantly to this growth.
- Energy Efficiency: This segment's growth is linked to initiatives aimed at improving energy efficiency in industries and buildings. Technological advancements and cost savings from energy-efficient technologies boost adoption rates.
- Industrial Process Improvements: This segment's growth is driven by regulations targeting industrial emissions and technological innovations that reduce emissions from industrial processes.
By Sector:
- Energy Sector: The energy sector is a dominant consumer of compliance carbon credits due to its significant contribution to greenhouse gas emissions. Stringent emission reduction targets and the transition to cleaner energy sources are key drivers.
- Transportation: The transportation sector is increasingly utilizing carbon credits to offset emissions from vehicles and transportation infrastructure. Government regulations and technological advancements in electric vehicles influence this sector.
- Industrial Sector: Industrial sectors contribute significantly to greenhouse gas emissions and are adopting carbon credits to meet emission reduction targets and enhance their sustainability profiles.
- Agriculture and Forestry: This sector is emerging as a key player, with forestry and land use projects gaining increasing traction as effective carbon sequestration methods.
Detailed analysis of each segment’s market size, growth projections, and competitive dynamics will be provided in the full report.
Compliance Carbon Credit Market Product Developments
Recent product innovations focus on improving the transparency, traceability, and efficiency of carbon credit trading platforms. The use of blockchain technology is emerging as a key trend, offering enhanced security and verification of carbon credits. These innovations address market needs for robust, verifiable, and transparent carbon credit systems, thereby improving the overall market integrity and attracting wider participation. The development of standardized methodologies for carbon quantification and verification is also crucial for boosting market confidence and facilitating cross-border trading.
Report Scope & Segmentation Analysis
This report provides a comprehensive analysis of the Compliance Carbon Credit Market, segmented by “Type of Credits” (Renewable Energy Projects, Forestry and Land Use, Energy Efficiency, Industrial Process Improvements) and “Sector” (Energy Sector, Transportation, Industrial Sector, Agriculture and Forestry). Each segment's market size, growth projections (2025-2033), and competitive dynamics will be analyzed in detail within the full report. The analysis includes historical data (2019-2024) and forecast data (2025-2033), offering a complete overview of the market's evolution and future trajectory.
Key Drivers of Compliance Carbon Credit Market Growth
The Compliance Carbon Credit Market's growth is primarily driven by several key factors. Firstly, increasing global awareness of climate change and the urgent need for emission reductions is bolstering demand for carbon offsetting solutions. Secondly, stringent government regulations and carbon pricing mechanisms are incentivizing businesses to reduce their carbon footprint and invest in carbon credit projects. Thirdly, technological advancements in carbon accounting, monitoring, and verification are improving market transparency and efficiency, attracting wider participation. Lastly, the growing corporate focus on Environmental, Social, and Governance (ESG) factors is prompting businesses to incorporate carbon offsetting into their sustainability strategies.
Challenges in the Compliance Carbon Credit Market Sector
Several challenges hinder the growth of the Compliance Carbon Credit Market. One major challenge is the lack of standardization and transparency in carbon credit methodologies, raising concerns about the credibility and verifiability of certain projects. Another challenge stems from the complex regulatory landscape across different jurisdictions, potentially leading to fragmented markets and difficulties in cross-border trading. Supply chain issues related to project development and carbon credit verification also contribute to market complexities. Furthermore, ensuring the additionality of projects (ensuring the projects wouldn't have happened without the carbon credits) remains a critical challenge. The estimated impact of these challenges on market growth is projected to be xx Million annually.
Emerging Opportunities in Compliance Carbon Credit Market
Several emerging opportunities are poised to drive future growth in the Compliance Carbon Credit Market. The increasing adoption of blockchain technology to enhance transparency and traceability of carbon credits is a key opportunity. The expansion of carbon credit markets into new geographical regions and sectors, particularly in developing economies, presents significant potential. Furthermore, the growing demand for nature-based solutions, such as afforestation and reforestation projects, is creating new opportunities for carbon credit generation and trading. The development of innovative carbon removal technologies also promises significant future growth.
Leading Players in the Compliance Carbon Credit Market Market
- Shell New Energies
- ClimateCare
- Natural Capital Partners
- Forest Carbon
- Gold Standard
- 3Degrees
- Carbon Trust
- South Pole
- Atmosfair
- 7 unnamed companies
- Sustainable Travel International
Key Developments in Compliance Carbon Credit Market Industry
- April 2024: Regional efforts in the Western United States and Canada to link their carbon markets (California, Quebec, and Washington) are gaining momentum. This could significantly impact trading dynamics and create a larger, more integrated market.
- January 2024: The Commodity Futures Trading Commission (CFTC) proposed guidance on the listing of voluntary carbon credit (VCC) derivatives contracts. This development, pending public comment and finalization, could enhance market liquidity and attract further investment.
Strategic Outlook for Compliance Carbon Credit Market Market
The Compliance Carbon Credit Market is poised for substantial growth over the next decade. Continued growth in corporate sustainability initiatives, stricter environmental regulations, and technological advancements in carbon accounting will drive market expansion. The linking of regional carbon markets and the potential standardization of carbon credit methodologies will further enhance market liquidity and attractiveness. This, coupled with the growing demand for nature-based solutions and innovative carbon removal technologies, will present significant opportunities for market participants. The market is predicted to continue its upward trajectory, with robust growth expected throughout the forecast period (2025-2033).
Compliance Carbon Credit Market Segmentation
-
1. Type of Credits
- 1.1. Renewable Energy Projects
- 1.2. Forestry and Land Use
- 1.3. Energy Efficiency
- 1.4. Industrial Process Improvements
-
2. Sector
- 2.1. Energy Sector
- 2.2. Transportation
- 2.3. Industrial Sector
- 2.4. Agriculture and Forestry
Compliance Carbon Credit Market Segmentation By Geography
-
1. North America
- 1.1. United States
- 1.2. Canada
-
2. Europe
- 2.1. United Kingdom
- 2.2. Germany
- 2.3. France
- 2.4. Rest of Europe
-
3. Asia Pacific
- 3.1. China
- 3.2. Japan
- 3.3. India
- 3.4. South Korea
- 3.5. Rest of Asia Pacific
- 4. Middle East and Africa
- 5. Latin America
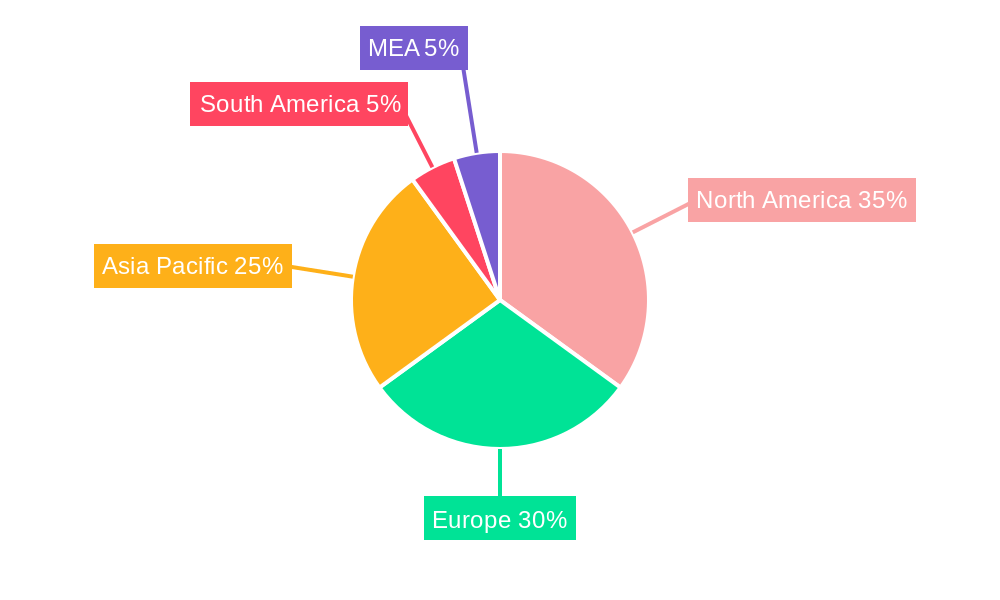
Compliance Carbon Credit Market Regional Market Share
Geographic Coverage of Compliance Carbon Credit Market
Compliance Carbon Credit Market REPORT HIGHLIGHTS
| Aspects | Details |
|---|---|
| Study Period | 2020-2034 |
| Base Year | 2025 |
| Estimated Year | 2026 |
| Forecast Period | 2026-2034 |
| Historical Period | 2020-2025 |
| Growth Rate | CAGR of 14.81% from 2020-2034 |
| Segmentation |
|
Table of Contents
- 1. Introduction
- 1.1. Research Scope
- 1.2. Market Segmentation
- 1.3. Research Objective
- 1.4. Definitions and Assumptions
- 2. Executive Summary
- 2.1. Market Snapshot
- 3. Market Dynamics
- 3.1. Market Drivers
- 3.2. Market Restrains
- 3.3. Market Trends
- 3.4. Market Opportunities
- 4. Market Factor Analysis
- 4.1. Porters Five Forces
- 4.1.1. Bargaining Power of Suppliers
- 4.1.2. Bargaining Power of Buyers
- 4.1.3. Threat of New Entrants
- 4.1.4. Threat of Substitutes
- 4.1.5. Competitive Rivalry
- 4.2. PESTEL analysis
- 4.3. BCG Analysis
- 4.3.1. Stars (High Growth, High Market Share)
- 4.3.2. Cash Cows (Low Growth, High Market Share)
- 4.3.3. Question Mark (High Growth, Low Market Share)
- 4.3.4. Dogs (Low Growth, Low Market Share)
- 4.4. Ansoff Matrix Analysis
- 4.5. Supply Chain Analysis
- 4.6. Regulatory Landscape
- 4.7. Current Market Potential and Opportunity Assessment (TAM–SAM–SOM Framework)
- 4.8. RAX Analyst Note
- 4.1. Porters Five Forces
- 5. Market Analysis, Insights and Forecast 2021-2033
- 5.1. Market Analysis, Insights and Forecast - by Type of Credits
- 5.1.1. Renewable Energy Projects
- 5.1.2. Forestry and Land Use
- 5.1.3. Energy Efficiency
- 5.1.4. Industrial Process Improvements
- 5.2. Market Analysis, Insights and Forecast - by Sector
- 5.2.1. Energy Sector
- 5.2.2. Transportation
- 5.2.3. Industrial Sector
- 5.2.4. Agriculture and Forestry
- 5.3. Market Analysis, Insights and Forecast - by Region
- 5.3.1. North America
- 5.3.2. Europe
- 5.3.3. Asia Pacific
- 5.3.4. Middle East and Africa
- 5.3.5. Latin America
- 5.1. Market Analysis, Insights and Forecast - by Type of Credits
- 6. Global Compliance Carbon Credit Market Analysis, Insights and Forecast, 2021-2033
- 6.1. Market Analysis, Insights and Forecast - by Type of Credits
- 6.1.1. Renewable Energy Projects
- 6.1.2. Forestry and Land Use
- 6.1.3. Energy Efficiency
- 6.1.4. Industrial Process Improvements
- 6.2. Market Analysis, Insights and Forecast - by Sector
- 6.2.1. Energy Sector
- 6.2.2. Transportation
- 6.2.3. Industrial Sector
- 6.2.4. Agriculture and Forestry
- 6.1. Market Analysis, Insights and Forecast - by Type of Credits
- 7. North America Compliance Carbon Credit Market Analysis, Insights and Forecast, 2020-2032
- 7.1. Market Analysis, Insights and Forecast - by Type of Credits
- 7.1.1. Renewable Energy Projects
- 7.1.2. Forestry and Land Use
- 7.1.3. Energy Efficiency
- 7.1.4. Industrial Process Improvements
- 7.2. Market Analysis, Insights and Forecast - by Sector
- 7.2.1. Energy Sector
- 7.2.2. Transportation
- 7.2.3. Industrial Sector
- 7.2.4. Agriculture and Forestry
- 7.1. Market Analysis, Insights and Forecast - by Type of Credits
- 8. Europe Compliance Carbon Credit Market Analysis, Insights and Forecast, 2020-2032
- 8.1. Market Analysis, Insights and Forecast - by Type of Credits
- 8.1.1. Renewable Energy Projects
- 8.1.2. Forestry and Land Use
- 8.1.3. Energy Efficiency
- 8.1.4. Industrial Process Improvements
- 8.2. Market Analysis, Insights and Forecast - by Sector
- 8.2.1. Energy Sector
- 8.2.2. Transportation
- 8.2.3. Industrial Sector
- 8.2.4. Agriculture and Forestry
- 8.1. Market Analysis, Insights and Forecast - by Type of Credits
- 9. Asia Pacific Compliance Carbon Credit Market Analysis, Insights and Forecast, 2020-2032
- 9.1. Market Analysis, Insights and Forecast - by Type of Credits
- 9.1.1. Renewable Energy Projects
- 9.1.2. Forestry and Land Use
- 9.1.3. Energy Efficiency
- 9.1.4. Industrial Process Improvements
- 9.2. Market Analysis, Insights and Forecast - by Sector
- 9.2.1. Energy Sector
- 9.2.2. Transportation
- 9.2.3. Industrial Sector
- 9.2.4. Agriculture and Forestry
- 9.1. Market Analysis, Insights and Forecast - by Type of Credits
- 10. Middle East and Africa Compliance Carbon Credit Market Analysis, Insights and Forecast, 2020-2032
- 10.1. Market Analysis, Insights and Forecast - by Type of Credits
- 10.1.1. Renewable Energy Projects
- 10.1.2. Forestry and Land Use
- 10.1.3. Energy Efficiency
- 10.1.4. Industrial Process Improvements
- 10.2. Market Analysis, Insights and Forecast - by Sector
- 10.2.1. Energy Sector
- 10.2.2. Transportation
- 10.2.3. Industrial Sector
- 10.2.4. Agriculture and Forestry
- 10.1. Market Analysis, Insights and Forecast - by Type of Credits
- 11. Latin America Compliance Carbon Credit Market Analysis, Insights and Forecast, 2020-2032
- 11.1. Market Analysis, Insights and Forecast - by Type of Credits
- 11.1.1. Renewable Energy Projects
- 11.1.2. Forestry and Land Use
- 11.1.3. Energy Efficiency
- 11.1.4. Industrial Process Improvements
- 11.2. Market Analysis, Insights and Forecast - by Sector
- 11.2.1. Energy Sector
- 11.2.2. Transportation
- 11.2.3. Industrial Sector
- 11.2.4. Agriculture and Forestry
- 11.1. Market Analysis, Insights and Forecast - by Type of Credits
- 12. Competitive Analysis
- 12.1. Company Profiles
- 12.1.1 Shell New Energies
- 12.1.1.1. Company Overview
- 12.1.1.2. Products
- 12.1.1.3. Company Financials
- 12.1.1.4. SWOT Analysis
- 12.1.2 ClimateCare
- 12.1.2.1. Company Overview
- 12.1.2.2. Products
- 12.1.2.3. Company Financials
- 12.1.2.4. SWOT Analysis
- 12.1.3 Natural Capital Partners
- 12.1.3.1. Company Overview
- 12.1.3.2. Products
- 12.1.3.3. Company Financials
- 12.1.3.4. SWOT Analysis
- 12.1.4 Forest Carbon
- 12.1.4.1. Company Overview
- 12.1.4.2. Products
- 12.1.4.3. Company Financials
- 12.1.4.4. SWOT Analysis
- 12.1.5 Gold Standard
- 12.1.5.1. Company Overview
- 12.1.5.2. Products
- 12.1.5.3. Company Financials
- 12.1.5.4. SWOT Analysis
- 12.1.6 3Degrees
- 12.1.6.1. Company Overview
- 12.1.6.2. Products
- 12.1.6.3. Company Financials
- 12.1.6.4. SWOT Analysis
- 12.1.7 Carbon Trust
- 12.1.7.1. Company Overview
- 12.1.7.2. Products
- 12.1.7.3. Company Financials
- 12.1.7.4. SWOT Analysis
- 12.1.8 South Pole
- 12.1.8.1. Company Overview
- 12.1.8.2. Products
- 12.1.8.3. Company Financials
- 12.1.8.4. SWOT Analysis
- 12.1.9 Atmosfair**List Not Exhaustive 7 3 Other Companie
- 12.1.9.1. Company Overview
- 12.1.9.2. Products
- 12.1.9.3. Company Financials
- 12.1.9.4. SWOT Analysis
- 12.1.10 Sustainable Travel International
- 12.1.10.1. Company Overview
- 12.1.10.2. Products
- 12.1.10.3. Company Financials
- 12.1.10.4. SWOT Analysis
- 12.1.1 Shell New Energies
- 12.2. Market Entropy
- 12.2.1 Company's Key Areas Served
- 12.2.2 Recent Developments
- 12.3. Company Market Share Analysis 2025
- 12.3.1 Top 5 Companies Market Share Analysis
- 12.3.2 Top 3 Companies Market Share Analysis
- 12.4. List of Potential Customers
- 13. Research Methodology
List of Figures
- Figure 1: Global Compliance Carbon Credit Market Revenue Breakdown (Million, %) by Region 2025 & 2033
- Figure 2: North America Compliance Carbon Credit Market Revenue (Million), by Type of Credits 2025 & 2033
- Figure 3: North America Compliance Carbon Credit Market Revenue Share (%), by Type of Credits 2025 & 2033
- Figure 4: North America Compliance Carbon Credit Market Revenue (Million), by Sector 2025 & 2033
- Figure 5: North America Compliance Carbon Credit Market Revenue Share (%), by Sector 2025 & 2033
- Figure 6: North America Compliance Carbon Credit Market Revenue (Million), by Country 2025 & 2033
- Figure 7: North America Compliance Carbon Credit Market Revenue Share (%), by Country 2025 & 2033
- Figure 8: Europe Compliance Carbon Credit Market Revenue (Million), by Type of Credits 2025 & 2033
- Figure 9: Europe Compliance Carbon Credit Market Revenue Share (%), by Type of Credits 2025 & 2033
- Figure 10: Europe Compliance Carbon Credit Market Revenue (Million), by Sector 2025 & 2033
- Figure 11: Europe Compliance Carbon Credit Market Revenue Share (%), by Sector 2025 & 2033
- Figure 12: Europe Compliance Carbon Credit Market Revenue (Million), by Country 2025 & 2033
- Figure 13: Europe Compliance Carbon Credit Market Revenue Share (%), by Country 2025 & 2033
- Figure 14: Asia Pacific Compliance Carbon Credit Market Revenue (Million), by Type of Credits 2025 & 2033
- Figure 15: Asia Pacific Compliance Carbon Credit Market Revenue Share (%), by Type of Credits 2025 & 2033
- Figure 16: Asia Pacific Compliance Carbon Credit Market Revenue (Million), by Sector 2025 & 2033
- Figure 17: Asia Pacific Compliance Carbon Credit Market Revenue Share (%), by Sector 2025 & 2033
- Figure 18: Asia Pacific Compliance Carbon Credit Market Revenue (Million), by Country 2025 & 2033
- Figure 19: Asia Pacific Compliance Carbon Credit Market Revenue Share (%), by Country 2025 & 2033
- Figure 20: Middle East and Africa Compliance Carbon Credit Market Revenue (Million), by Type of Credits 2025 & 2033
- Figure 21: Middle East and Africa Compliance Carbon Credit Market Revenue Share (%), by Type of Credits 2025 & 2033
- Figure 22: Middle East and Africa Compliance Carbon Credit Market Revenue (Million), by Sector 2025 & 2033
- Figure 23: Middle East and Africa Compliance Carbon Credit Market Revenue Share (%), by Sector 2025 & 2033
- Figure 24: Middle East and Africa Compliance Carbon Credit Market Revenue (Million), by Country 2025 & 2033
- Figure 25: Middle East and Africa Compliance Carbon Credit Market Revenue Share (%), by Country 2025 & 2033
- Figure 26: Latin America Compliance Carbon Credit Market Revenue (Million), by Type of Credits 2025 & 2033
- Figure 27: Latin America Compliance Carbon Credit Market Revenue Share (%), by Type of Credits 2025 & 2033
- Figure 28: Latin America Compliance Carbon Credit Market Revenue (Million), by Sector 2025 & 2033
- Figure 29: Latin America Compliance Carbon Credit Market Revenue Share (%), by Sector 2025 & 2033
- Figure 30: Latin America Compliance Carbon Credit Market Revenue (Million), by Country 2025 & 2033
- Figure 31: Latin America Compliance Carbon Credit Market Revenue Share (%), by Country 2025 & 2033
List of Tables
- Table 1: Global Compliance Carbon Credit Market Revenue Million Forecast, by Type of Credits 2020 & 2033
- Table 2: Global Compliance Carbon Credit Market Revenue Million Forecast, by Sector 2020 & 2033
- Table 3: Global Compliance Carbon Credit Market Revenue Million Forecast, by Region 2020 & 2033
- Table 4: Global Compliance Carbon Credit Market Revenue Million Forecast, by Type of Credits 2020 & 2033
- Table 5: Global Compliance Carbon Credit Market Revenue Million Forecast, by Sector 2020 & 2033
- Table 6: Global Compliance Carbon Credit Market Revenue Million Forecast, by Country 2020 & 2033
- Table 7: United States Compliance Carbon Credit Market Revenue (Million) Forecast, by Application 2020 & 2033
- Table 8: Canada Compliance Carbon Credit Market Revenue (Million) Forecast, by Application 2020 & 2033
- Table 9: Global Compliance Carbon Credit Market Revenue Million Forecast, by Type of Credits 2020 & 2033
- Table 10: Global Compliance Carbon Credit Market Revenue Million Forecast, by Sector 2020 & 2033
- Table 11: Global Compliance Carbon Credit Market Revenue Million Forecast, by Country 2020 & 2033
- Table 12: United Kingdom Compliance Carbon Credit Market Revenue (Million) Forecast, by Application 2020 & 2033
- Table 13: Germany Compliance Carbon Credit Market Revenue (Million) Forecast, by Application 2020 & 2033
- Table 14: France Compliance Carbon Credit Market Revenue (Million) Forecast, by Application 2020 & 2033
- Table 15: Rest of Europe Compliance Carbon Credit Market Revenue (Million) Forecast, by Application 2020 & 2033
- Table 16: Global Compliance Carbon Credit Market Revenue Million Forecast, by Type of Credits 2020 & 2033
- Table 17: Global Compliance Carbon Credit Market Revenue Million Forecast, by Sector 2020 & 2033
- Table 18: Global Compliance Carbon Credit Market Revenue Million Forecast, by Country 2020 & 2033
- Table 19: China Compliance Carbon Credit Market Revenue (Million) Forecast, by Application 2020 & 2033
- Table 20: Japan Compliance Carbon Credit Market Revenue (Million) Forecast, by Application 2020 & 2033
- Table 21: India Compliance Carbon Credit Market Revenue (Million) Forecast, by Application 2020 & 2033
- Table 22: South Korea Compliance Carbon Credit Market Revenue (Million) Forecast, by Application 2020 & 2033
- Table 23: Rest of Asia Pacific Compliance Carbon Credit Market Revenue (Million) Forecast, by Application 2020 & 2033
- Table 24: Global Compliance Carbon Credit Market Revenue Million Forecast, by Type of Credits 2020 & 2033
- Table 25: Global Compliance Carbon Credit Market Revenue Million Forecast, by Sector 2020 & 2033
- Table 26: Global Compliance Carbon Credit Market Revenue Million Forecast, by Country 2020 & 2033
- Table 27: Global Compliance Carbon Credit Market Revenue Million Forecast, by Type of Credits 2020 & 2033
- Table 28: Global Compliance Carbon Credit Market Revenue Million Forecast, by Sector 2020 & 2033
- Table 29: Global Compliance Carbon Credit Market Revenue Million Forecast, by Country 2020 & 2033
Frequently Asked Questions
1. What is the projected Compound Annual Growth Rate (CAGR) of the Compliance Carbon Credit Market?
The projected CAGR is approximately 14.81%.
2. Which companies are prominent players in the Compliance Carbon Credit Market?
Key companies in the market include Shell New Energies, ClimateCare, Natural Capital Partners, Forest Carbon, Gold Standard, 3Degrees, Carbon Trust, South Pole, Atmosfair**List Not Exhaustive 7 3 Other Companie, Sustainable Travel International.
3. What are the main segments of the Compliance Carbon Credit Market?
The market segments include Type of Credits, Sector.
4. Can you provide details about the market size?
The market size is estimated to be USD 0.82 Million as of 2022.
5. What are some drivers contributing to market growth?
Regulatory Mandates and Policies; Growing Corporate Sustainability Initiatives.
6. What are the notable trends driving market growth?
Charting the Course of Carbon Pricing: UK-ETS Post-Brexit.
7. Are there any restraints impacting market growth?
Market Complexity and Uncertainty.
8. Can you provide examples of recent developments in the market?
April 2024: Regional efforts in the Western United States and Canada are gaining momentum as the urgency of combating climate change increases. Plans to link their carbon markets are being drawn up in California, Quebec, and Washington, which could significantly affect trading dynamics. The three authorities intend to work together to create a more extensive carbon credit market as soon as their proposed alliance takes effect.
9. What pricing options are available for accessing the report?
Pricing options include single-user, multi-user, and enterprise licenses priced at USD 4750, USD 5250, and USD 8750 respectively.
10. Is the market size provided in terms of value or volume?
The market size is provided in terms of value, measured in Million.
11. Are there any specific market keywords associated with the report?
Yes, the market keyword associated with the report is "Compliance Carbon Credit Market," which aids in identifying and referencing the specific market segment covered.
12. How do I determine which pricing option suits my needs best?
The pricing options vary based on user requirements and access needs. Individual users may opt for single-user licenses, while businesses requiring broader access may choose multi-user or enterprise licenses for cost-effective access to the report.
13. Are there any additional resources or data provided in the Compliance Carbon Credit Market report?
While the report offers comprehensive insights, it's advisable to review the specific contents or supplementary materials provided to ascertain if additional resources or data are available.
14. How can I stay updated on further developments or reports in the Compliance Carbon Credit Market?
To stay informed about further developments, trends, and reports in the Compliance Carbon Credit Market, consider subscribing to industry newsletters, following relevant companies and organizations, or regularly checking reputable industry news sources and publications.
Methodology
Step 1 - Identification of Relevant Samples Size from Population Database


Step 2 - Approaches for Defining Global Market Size (Value, Volume* & Price*)

Note*: In applicable scenarios
Step 3 - Data Sources
Primary Research
- Web Analytics
- Survey Reports
- Research Institute
- Latest Research Reports
- Opinion Leaders
Secondary Research
- Annual Reports
- White Paper
- Latest Press Release
- Industry Association
- Paid Database
- Investor Presentations

Step 4 - Data Triangulation
Involves using different sources of information in order to increase the validity of a study
These sources are likely to be stakeholders in a program - participants, other researchers, program staff, other community members, and so on.
Then we put all data in single framework & apply various statistical tools to find out the dynamic on the market.
During the analysis stage, feedback from the stakeholder groups would be compared to determine areas of agreement as well as areas of divergence