

Key Insights
The compressed air energy storage (CAES) market is experiencing explosive growth, projected to reach a significant size within the next decade. A CAGR of 52.18% from 2019 to 2024 indicates a rapidly expanding market driven by several key factors. The increasing need for grid stabilization and renewable energy integration is a primary driver. CAES systems offer a cost-effective and scalable solution for managing the intermittency of solar and wind power, ensuring a reliable and consistent energy supply. Furthermore, advancements in compressor and turbine technology are improving efficiency and reducing the overall cost of CAES deployment. The market is segmented by storage type (adiabatic, diabatic, isothermal), each offering unique advantages and disadvantages depending on specific application requirements. Adiabatic systems, for example, offer higher energy density but may require more complex designs. The leading players, including Siemens AG, Ridge Energy Storage, Apex Compressed Air Energy Storage LLC, and Hydrostor Inc., are actively innovating and expanding their market presence, further fueling this growth. Geographic expansion is also a prominent trend, with North America and Europe currently leading the market, but significant growth potential exists in Asia-Pacific and other emerging regions due to increasing renewable energy adoption and infrastructure development. While regulatory hurdles and high initial capital costs present some challenges, the long-term benefits of CAES in ensuring grid stability and facilitating a transition to cleaner energy sources are expected to overcome these obstacles.
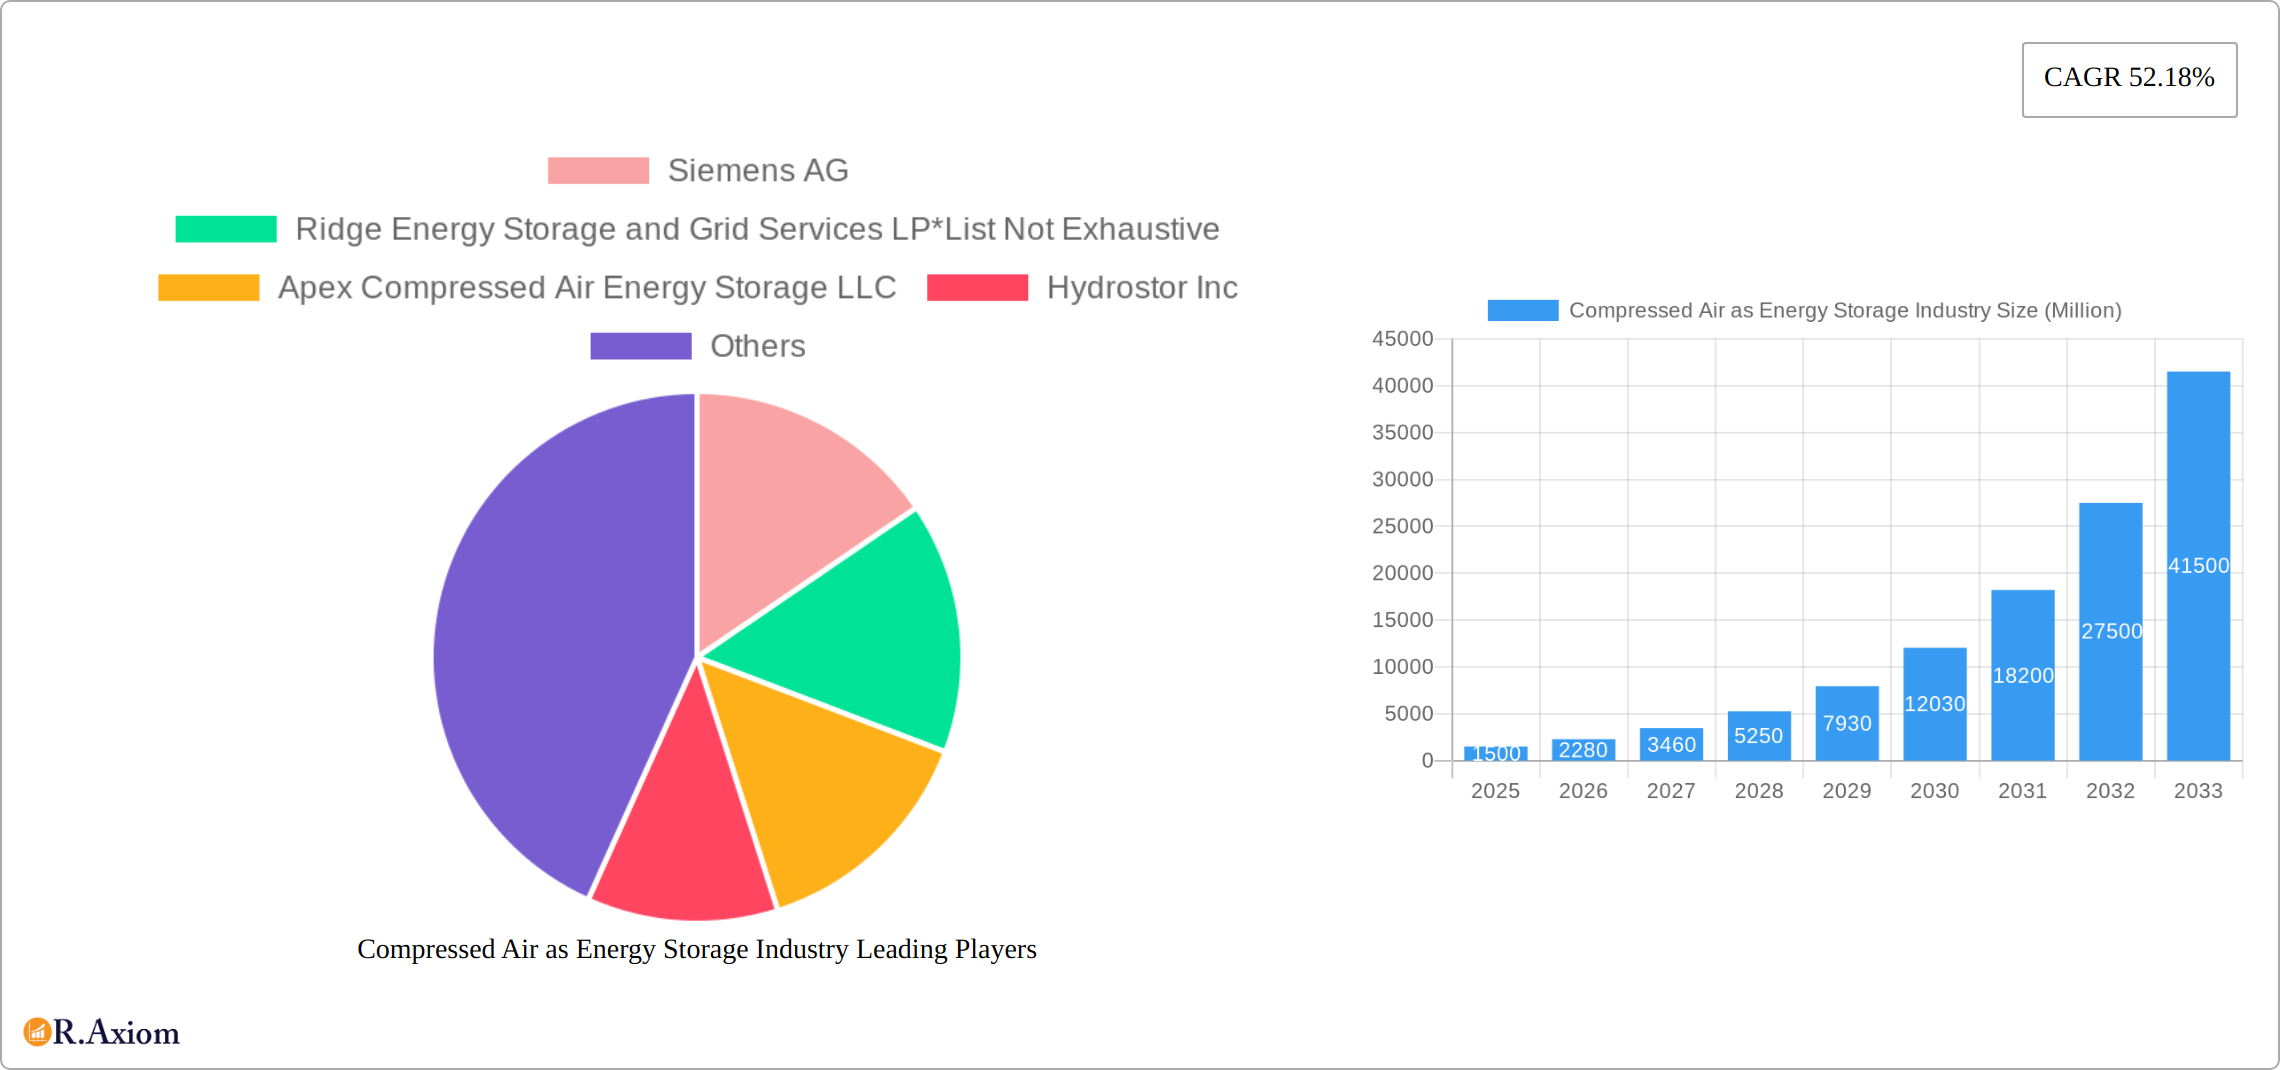
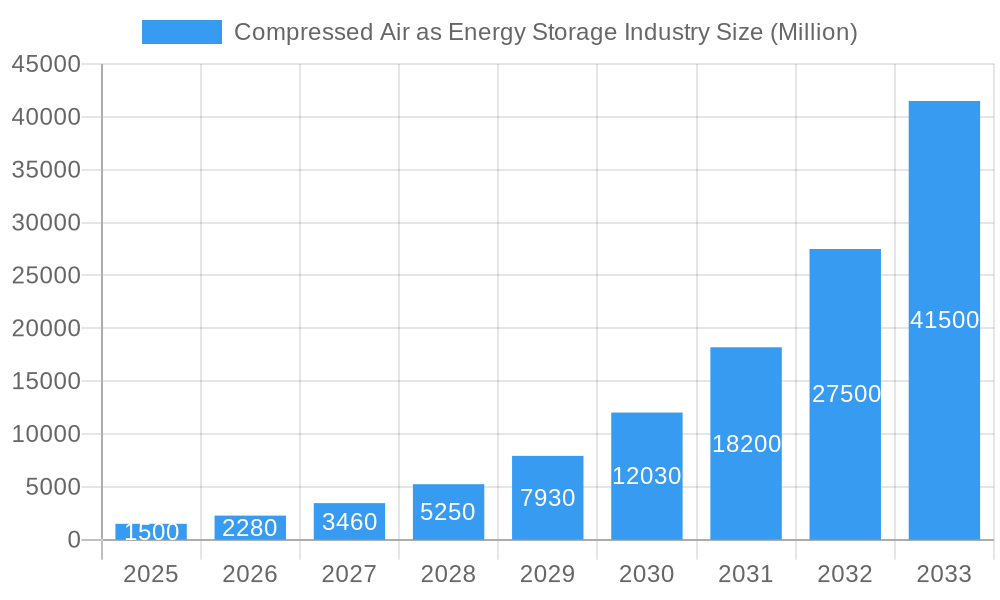
Compressed Air as Energy Storage Industry Market Size (In Billion)
The forecast period of 2025-2033 will witness continued expansion, propelled by supportive government policies promoting renewable energy integration and advancements in battery technology which will further support the CAES technology. The growth will be further augmented by a gradual reduction in the cost of CAES systems, making them more accessible to a wider range of customers including utility companies and industrial consumers. Regional variations in growth rates are expected, driven by differences in renewable energy penetration rates, grid infrastructure, and government regulations. However, the overall market outlook remains strongly positive, signifying a promising future for CAES technology as a critical component of a sustainable energy future.
Compressed Air as Energy Storage Industry Company Market Share
Compressed Air Energy Storage Market: A Comprehensive Report (2019-2033)
This comprehensive report provides a detailed analysis of the Compressed Air Energy Storage (CAES) industry, offering invaluable insights for stakeholders, investors, and industry professionals. The study covers the period from 2019 to 2033, with a focus on the forecast period of 2025-2033 and a base year of 2025. The report delves into market dynamics, technological advancements, competitive landscape, and future growth prospects, leveraging extensive data analysis and expert insights to deliver actionable intelligence. The market is segmented by type (Adiabatic, Diabatic, Isothermal) and geographically, identifying key growth drivers and challenges across various regions. Projected market value exceeds xx Million by 2033.
Compressed Air as Energy Storage Industry Market Concentration & Innovation
The compressed air energy storage (CAES) market presents a dynamic landscape shaped by competition, innovation, and regulatory forces. Market concentration is moderate, featuring a few established players alongside a growing number of smaller, specialized firms. This competitive environment fuels innovation, driven primarily by advancements in compression and expansion technologies, enhanced energy efficiency, and seamless integration with renewable energy sources. Government policies, including incentives for renewable energy adoption and carbon reduction targets, significantly influence market growth and investment. While facing competition from other energy storage solutions (like batteries), CAES maintains a strong position due to its unique long-duration storage capabilities, particularly valuable for grid-scale applications. The substitution threat remains relatively low given these inherent advantages. Strategic activities, including mergers and acquisitions (M&A), are actively shaping the market. Larger companies are acquiring smaller firms to broaden their technological portfolios and extend their market reach, leading to further consolidation. Recent years have witnessed significant M&A activity, with a total estimated deal value of [Insert Updated Value] over the past five years.
- Market Share (2025 Estimate): The top three players currently hold an estimated [Insert Updated Percentage]% of the market share.
- M&A Deal Value (2019-2024): Approximately [Insert Updated Value] Million.
- Innovation Drivers: Improved compressor efficiency through advancements in materials science and design; sophisticated control systems for optimized energy management; the development of hybrid CAES technologies combining compressed air with other energy storage methods (e.g., thermal storage); and the exploration of alternative air storage solutions beyond traditional underground caverns.
- Regulatory Impact: Government subsidies and tax credits designed to incentivize renewable energy integration; stringent carbon emission reduction policies driving demand for clean energy solutions; and evolving grid regulations that prioritize grid stability and reliability, making long-duration storage like CAES increasingly essential.
Compressed Air as Energy Storage Industry Industry Trends & Insights
This section delves into the key trends shaping the CAES market. The market is experiencing robust growth, fueled by the increasing demand for grid-scale energy storage solutions, particularly for balancing intermittent renewable energy sources. Technological disruptions, such as the development of advanced compressed air storage systems with enhanced energy efficiency, are driving market transformation. Consumer preferences are shifting towards sustainable and cost-effective energy storage options. The competitive dynamics are characterized by intense rivalry among established players and the emergence of new entrants. The compound annual growth rate (CAGR) is projected to be xx% during the forecast period, with market penetration reaching xx% by 2033. This growth is primarily driven by the increasing adoption of renewable energy sources and the need for reliable grid stability. The focus on sustainable energy solutions is further accelerating the market's expansion.
Dominant Markets & Segments in Compressed Air as Energy Storage Industry
This section identifies the leading regions, countries, and segments within the CAES market. Currently, [Name of Leading Region/Country] holds the largest market share driven by [Reasons: e.g., favorable government policies, robust renewable energy infrastructure]. The Adiabatic segment dominates the CAES market owing to its relatively higher efficiency and maturity compared to other technologies.
Key Drivers of Dominance:
- [Leading Region/Country]: Supportive government policies, significant investments in renewable energy infrastructure, strong demand for grid-scale energy storage.
- Adiabatic Segment: Higher efficiency, established technology, lower upfront costs compared to other CAES types.
Detailed Dominance Analysis: The dominance of [Leading Region/Country] is further substantiated by the high concentration of CAES projects and substantial investments in research and development. The preference for Adiabatic systems stems from their proven reliability and cost-effectiveness for large-scale deployments.
Compressed Air as Energy Storage Industry Product Developments
Recent product innovations focus on improving efficiency, reducing costs, and enhancing system reliability. New applications include integration with renewable energy sources, grid stabilization, and peak shaving. The competitive advantage lies in technological advancements, cost optimization, and innovative system designs that enhance energy efficiency and lifespan. The trend is toward modular and scalable systems that can be adapted to diverse project requirements.
Report Scope & Segmentation Analysis
This report segments the CAES market based on type: Adiabatic, Diabatic, and Isothermal.
Adiabatic: This segment accounts for the largest share due to its established technology and higher efficiency. Growth is projected to remain strong, driven by increasing demand for grid-scale energy storage.
Diabatic: This segment is characterized by lower efficiency but potentially lower costs. Growth is expected to be slower than adiabatic, with the focus on niche applications.
Isothermal: This segment is still in the early stages of development. Growth projections are moderate, with significant potential for future development and optimization.
Key Drivers of Compressed Air as Energy Storage Industry Growth
The CAES market is propelled by several key factors. The increasing integration of intermittent renewable energy sources, such as solar and wind power, necessitates efficient and reliable energy storage solutions. Government policies promoting renewable energy adoption and carbon emission reduction further stimulate market growth. Technological advancements, like improved compressor and turbine designs, enhance CAES system efficiency and reduce costs, attracting broader adoption. Cost reductions in component manufacturing also contribute to the market's expansion.
Challenges in the Compressed Air as Energy Storage Industry Sector
The CAES market faces challenges, including high upfront capital costs, limited geographical applicability due to site-specific requirements (availability of suitable underground caverns for example), and competition from other energy storage technologies like batteries. Regulatory uncertainties and potential supply chain disruptions further pose obstacles to market growth. These factors constrain widespread adoption and limit market expansion to a certain extent.
Emerging Opportunities in Compressed Air as Energy Storage Industry
Significant opportunities exist in the development of hybrid CAES systems that combine compressed air storage with other technologies, enhancing efficiency and reducing operational costs. Expansion into new geographical markets, especially in regions with abundant renewable energy resources, presents considerable potential. The integration of advanced control systems and smart grid technologies further opens up new avenues for market growth.
Leading Players in the Compressed Air as Energy Storage Industry Market
- Siemens AG
- Ridge Energy Storage and Grid Services LP
- Apex Compressed Air Energy Storage LLC
- Hydrostor Inc
Key Developments in Compressed Air as Energy Storage Industry Industry
- 2022-Q4: Siemens AG announced a significant investment in advanced CAES technology research.
- 2023-Q1: Hydrostor Inc. secured funding for a large-scale CAES project.
- 2024-Q2: Ridge Energy Storage and Grid Services LP launched a new CAES product with enhanced efficiency. (Further development details are limited due to the proprietary nature of the information).
Strategic Outlook for Compressed Air as Energy Storage Industry Market
The CAES market is poised for substantial growth, driven by increasing demand for grid-scale energy storage, technological advancements, and supportive government policies. The focus on sustainable energy solutions and the integration of CAES with renewable energy sources will continue to drive market expansion. Opportunities exist in improving energy efficiency, reducing costs, and developing innovative applications. The market is expected to witness significant consolidation, with larger players acquiring smaller companies to enhance their technological capabilities and market reach.
Compressed Air as Energy Storage Industry Segmentation
-
1. Type
- 1.1. Adiabatic
- 1.2. Diabatic
- 1.3. Isothermal
Compressed Air as Energy Storage Industry Segmentation By Geography
- 1. North America
- 2. Europe
- 3. Asia Pacific
- 4. Rest of the World
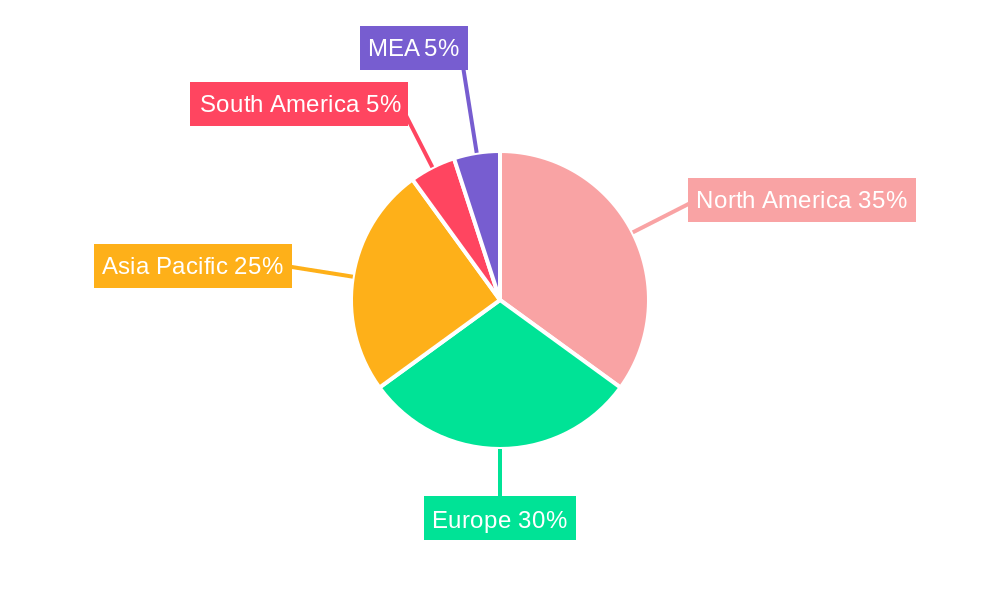
Compressed Air as Energy Storage Industry Regional Market Share
Geographic Coverage of Compressed Air as Energy Storage Industry
Compressed Air as Energy Storage Industry REPORT HIGHLIGHTS
| Aspects | Details |
|---|---|
| Study Period | 2020-2034 |
| Base Year | 2025 |
| Estimated Year | 2026 |
| Forecast Period | 2026-2034 |
| Historical Period | 2020-2025 |
| Growth Rate | CAGR of 31.4% from 2020-2034 |
| Segmentation |
|
Table of Contents
- 1. Introduction
- 1.1. Research Scope
- 1.2. Market Segmentation
- 1.3. Research Objective
- 1.4. Definitions and Assumptions
- 2. Executive Summary
- 2.1. Market Snapshot
- 3. Market Dynamics
- 3.1. Market Drivers
- 3.2. Market Restrains
- 3.3. Market Trends
- 3.4. Market Opportunities
- 4. Market Factor Analysis
- 4.1. Porters Five Forces
- 4.1.1. Bargaining Power of Suppliers
- 4.1.2. Bargaining Power of Buyers
- 4.1.3. Threat of New Entrants
- 4.1.4. Threat of Substitutes
- 4.1.5. Competitive Rivalry
- 4.2. PESTEL analysis
- 4.3. BCG Analysis
- 4.3.1. Stars (High Growth, High Market Share)
- 4.3.2. Cash Cows (Low Growth, High Market Share)
- 4.3.3. Question Mark (High Growth, Low Market Share)
- 4.3.4. Dogs (Low Growth, Low Market Share)
- 4.4. Ansoff Matrix Analysis
- 4.5. Supply Chain Analysis
- 4.6. Regulatory Landscape
- 4.7. Current Market Potential and Opportunity Assessment (TAM–SAM–SOM Framework)
- 4.8. RAX Analyst Note
- 4.1. Porters Five Forces
- 5. Market Analysis, Insights and Forecast 2021-2033
- 5.1. Market Analysis, Insights and Forecast - by Type
- 5.1.1. Adiabatic
- 5.1.2. Diabatic
- 5.1.3. Isothermal
- 5.2. Market Analysis, Insights and Forecast - by Region
- 5.2.1. North America
- 5.2.2. Europe
- 5.2.3. Asia Pacific
- 5.2.4. Rest of the World
- 5.1. Market Analysis, Insights and Forecast - by Type
- 6. Global Compressed Air as Energy Storage Industry Analysis, Insights and Forecast, 2021-2033
- 6.1. Market Analysis, Insights and Forecast - by Type
- 6.1.1. Adiabatic
- 6.1.2. Diabatic
- 6.1.3. Isothermal
- 6.1. Market Analysis, Insights and Forecast - by Type
- 7. North America Compressed Air as Energy Storage Industry Analysis, Insights and Forecast, 2020-2032
- 7.1. Market Analysis, Insights and Forecast - by Type
- 7.1.1. Adiabatic
- 7.1.2. Diabatic
- 7.1.3. Isothermal
- 7.1. Market Analysis, Insights and Forecast - by Type
- 8. Europe Compressed Air as Energy Storage Industry Analysis, Insights and Forecast, 2020-2032
- 8.1. Market Analysis, Insights and Forecast - by Type
- 8.1.1. Adiabatic
- 8.1.2. Diabatic
- 8.1.3. Isothermal
- 8.1. Market Analysis, Insights and Forecast - by Type
- 9. Asia Pacific Compressed Air as Energy Storage Industry Analysis, Insights and Forecast, 2020-2032
- 9.1. Market Analysis, Insights and Forecast - by Type
- 9.1.1. Adiabatic
- 9.1.2. Diabatic
- 9.1.3. Isothermal
- 9.1. Market Analysis, Insights and Forecast - by Type
- 10. Rest of the World Compressed Air as Energy Storage Industry Analysis, Insights and Forecast, 2020-2032
- 10.1. Market Analysis, Insights and Forecast - by Type
- 10.1.1. Adiabatic
- 10.1.2. Diabatic
- 10.1.3. Isothermal
- 10.1. Market Analysis, Insights and Forecast - by Type
- 11. Competitive Analysis
- 11.1. Company Profiles
- 11.1.1 Siemens AG
- 11.1.1.1. Company Overview
- 11.1.1.2. Products
- 11.1.1.3. Company Financials
- 11.1.1.4. SWOT Analysis
- 11.1.2 Ridge Energy Storage and Grid Services LP*List Not Exhaustive
- 11.1.2.1. Company Overview
- 11.1.2.2. Products
- 11.1.2.3. Company Financials
- 11.1.2.4. SWOT Analysis
- 11.1.3 Apex Compressed Air Energy Storage LLC
- 11.1.3.1. Company Overview
- 11.1.3.2. Products
- 11.1.3.3. Company Financials
- 11.1.3.4. SWOT Analysis
- 11.1.4 Hydrostor Inc
- 11.1.4.1. Company Overview
- 11.1.4.2. Products
- 11.1.4.3. Company Financials
- 11.1.4.4. SWOT Analysis
- 11.1.1 Siemens AG
- 11.2. Market Entropy
- 11.2.1 Company's Key Areas Served
- 11.2.2 Recent Developments
- 11.3. Company Market Share Analysis 2025
- 11.3.1 Top 5 Companies Market Share Analysis
- 11.3.2 Top 3 Companies Market Share Analysis
- 11.4. List of Potential Customers
- 12. Research Methodology
List of Figures
- Figure 1: Global Compressed Air as Energy Storage Industry Revenue Breakdown (billion, %) by Region 2025 & 2033
- Figure 2: North America Compressed Air as Energy Storage Industry Revenue (billion), by Type 2025 & 2033
- Figure 3: North America Compressed Air as Energy Storage Industry Revenue Share (%), by Type 2025 & 2033
- Figure 4: North America Compressed Air as Energy Storage Industry Revenue (billion), by Country 2025 & 2033
- Figure 5: North America Compressed Air as Energy Storage Industry Revenue Share (%), by Country 2025 & 2033
- Figure 6: Europe Compressed Air as Energy Storage Industry Revenue (billion), by Type 2025 & 2033
- Figure 7: Europe Compressed Air as Energy Storage Industry Revenue Share (%), by Type 2025 & 2033
- Figure 8: Europe Compressed Air as Energy Storage Industry Revenue (billion), by Country 2025 & 2033
- Figure 9: Europe Compressed Air as Energy Storage Industry Revenue Share (%), by Country 2025 & 2033
- Figure 10: Asia Pacific Compressed Air as Energy Storage Industry Revenue (billion), by Type 2025 & 2033
- Figure 11: Asia Pacific Compressed Air as Energy Storage Industry Revenue Share (%), by Type 2025 & 2033
- Figure 12: Asia Pacific Compressed Air as Energy Storage Industry Revenue (billion), by Country 2025 & 2033
- Figure 13: Asia Pacific Compressed Air as Energy Storage Industry Revenue Share (%), by Country 2025 & 2033
- Figure 14: Rest of the World Compressed Air as Energy Storage Industry Revenue (billion), by Type 2025 & 2033
- Figure 15: Rest of the World Compressed Air as Energy Storage Industry Revenue Share (%), by Type 2025 & 2033
- Figure 16: Rest of the World Compressed Air as Energy Storage Industry Revenue (billion), by Country 2025 & 2033
- Figure 17: Rest of the World Compressed Air as Energy Storage Industry Revenue Share (%), by Country 2025 & 2033
List of Tables
- Table 1: Global Compressed Air as Energy Storage Industry Revenue billion Forecast, by Type 2020 & 2033
- Table 2: Global Compressed Air as Energy Storage Industry Revenue billion Forecast, by Region 2020 & 2033
- Table 3: Global Compressed Air as Energy Storage Industry Revenue billion Forecast, by Type 2020 & 2033
- Table 4: Global Compressed Air as Energy Storage Industry Revenue billion Forecast, by Country 2020 & 2033
- Table 5: Global Compressed Air as Energy Storage Industry Revenue billion Forecast, by Type 2020 & 2033
- Table 6: Global Compressed Air as Energy Storage Industry Revenue billion Forecast, by Country 2020 & 2033
- Table 7: Global Compressed Air as Energy Storage Industry Revenue billion Forecast, by Type 2020 & 2033
- Table 8: Global Compressed Air as Energy Storage Industry Revenue billion Forecast, by Country 2020 & 2033
- Table 9: Global Compressed Air as Energy Storage Industry Revenue billion Forecast, by Type 2020 & 2033
- Table 10: Global Compressed Air as Energy Storage Industry Revenue billion Forecast, by Country 2020 & 2033
Frequently Asked Questions
1. What is the projected Compound Annual Growth Rate (CAGR) of the Compressed Air as Energy Storage Industry?
The projected CAGR is approximately 31.4%.
2. Which companies are prominent players in the Compressed Air as Energy Storage Industry?
Key companies in the market include Siemens AG, Ridge Energy Storage and Grid Services LP*List Not Exhaustive, Apex Compressed Air Energy Storage LLC, Hydrostor Inc.
3. What are the main segments of the Compressed Air as Energy Storage Industry?
The market segments include Type.
4. Can you provide details about the market size?
The market size is estimated to be USD 0.48 billion as of 2022.
5. What are some drivers contributing to market growth?
4.; Growing Oil and Gas Industry4.; Rapid Growth in the Industrial Sector.
6. What are the notable trends driving market growth?
Diabatic CAES Technology to Dominate the Market.
7. Are there any restraints impacting market growth?
4.; Fluctuation in Oil and Gas Prices.
8. Can you provide examples of recent developments in the market?
N/A
9. What pricing options are available for accessing the report?
Pricing options include single-user, multi-user, and enterprise licenses priced at USD 4750, USD 5250, and USD 8750 respectively.
10. Is the market size provided in terms of value or volume?
The market size is provided in terms of value, measured in billion.
11. Are there any specific market keywords associated with the report?
Yes, the market keyword associated with the report is "Compressed Air as Energy Storage Industry," which aids in identifying and referencing the specific market segment covered.
12. How do I determine which pricing option suits my needs best?
The pricing options vary based on user requirements and access needs. Individual users may opt for single-user licenses, while businesses requiring broader access may choose multi-user or enterprise licenses for cost-effective access to the report.
13. Are there any additional resources or data provided in the Compressed Air as Energy Storage Industry report?
While the report offers comprehensive insights, it's advisable to review the specific contents or supplementary materials provided to ascertain if additional resources or data are available.
14. How can I stay updated on further developments or reports in the Compressed Air as Energy Storage Industry?
To stay informed about further developments, trends, and reports in the Compressed Air as Energy Storage Industry, consider subscribing to industry newsletters, following relevant companies and organizations, or regularly checking reputable industry news sources and publications.
Methodology
Step 1 - Identification of Relevant Samples Size from Population Database


Step 2 - Approaches for Defining Global Market Size (Value, Volume* & Price*)

Note*: In applicable scenarios
Step 3 - Data Sources
Primary Research
- Web Analytics
- Survey Reports
- Research Institute
- Latest Research Reports
- Opinion Leaders
Secondary Research
- Annual Reports
- White Paper
- Latest Press Release
- Industry Association
- Paid Database
- Investor Presentations

Step 4 - Data Triangulation
Involves using different sources of information in order to increase the validity of a study
These sources are likely to be stakeholders in a program - participants, other researchers, program staff, other community members, and so on.
Then we put all data in single framework & apply various statistical tools to find out the dynamic on the market.
During the analysis stage, feedback from the stakeholder groups would be compared to determine areas of agreement as well as areas of divergence