

Key Insights
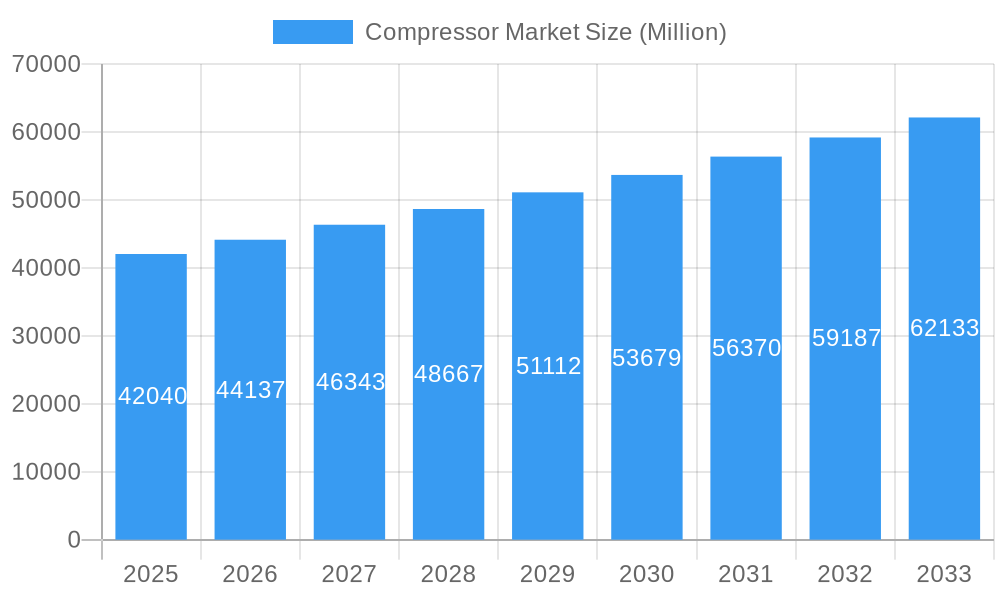
The global compressor market, valued at $42.04 billion in 2025, is projected to experience robust growth, driven by increasing industrialization, rising energy demands, and expanding infrastructure projects across diverse sectors. A compound annual growth rate (CAGR) of 4.81% from 2025 to 2033 indicates a significant market expansion. Key drivers include the burgeoning oil and gas industry, the transition to renewable energy sources (requiring compressors for various applications), and the growth of manufacturing and chemical processing sectors. The positive displacement compressor segment currently holds a significant market share, owing to its reliability and suitability for high-pressure applications. However, the dynamic compressor segment is expected to witness faster growth due to its energy efficiency advantages and suitability for certain applications. Regional growth is expected to be diverse, with North America and Asia-Pacific leading the charge, fueled by robust economic activity and industrial expansion in these regions. Emerging economies in Asia-Pacific, particularly India and Southeast Asia, present significant growth opportunities due to rapid industrialization and infrastructure development. While potential restraints like volatile raw material prices and stringent environmental regulations exist, technological advancements focused on improving energy efficiency and reducing emissions are mitigating these challenges, shaping the future of the compressor market.
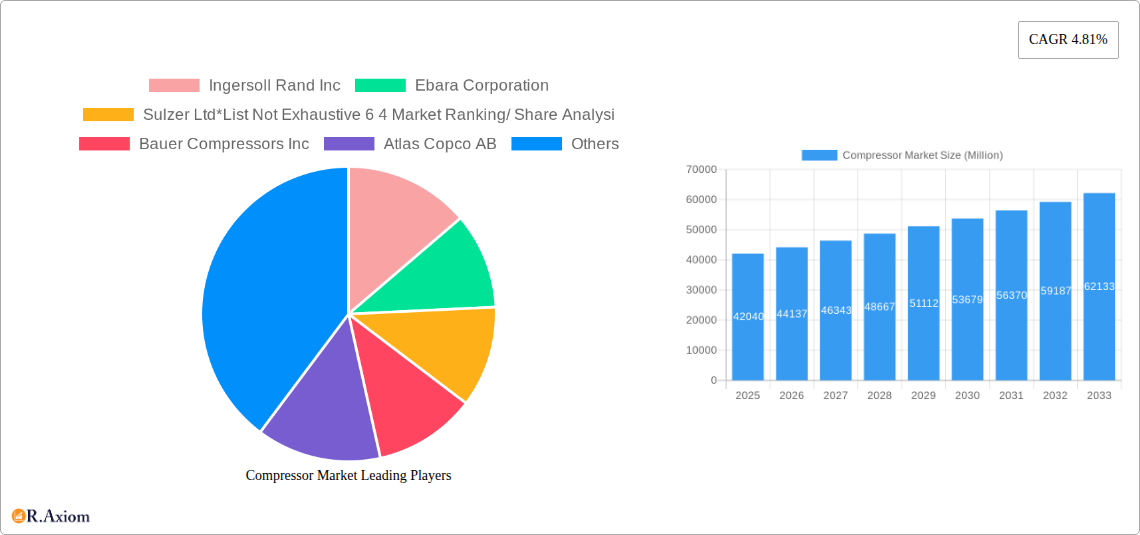
Compressor Market Market Size (In Billion)
The competitive landscape is characterized by a mix of established players and emerging companies. Key players such as Ingersoll Rand, Atlas Copco, and Siemens Energy hold significant market share through their diverse product portfolios and global reach. However, the market also features several smaller, specialized companies that cater to niche segments. Ongoing technological innovations, such as the development of more efficient and environmentally friendly compressor technologies, and strategic mergers and acquisitions are reshaping the competitive dynamics. The forecast period (2025-2033) anticipates continued market expansion, driven by the sustained demand for compressors across various industries and regions, although the exact growth trajectory will depend on several macroeconomic factors, including global economic conditions and government policies relating to energy and industrial development.
Compressor Market Company Market Share
This detailed report provides a comprehensive analysis of the global compressor market, offering invaluable insights for industry stakeholders, investors, and strategic decision-makers. The study covers the period from 2019 to 2033, with 2025 serving as the base year and estimations extending to 2033. This report leverages extensive research and data analysis to provide a nuanced understanding of market trends, competitive dynamics, and future growth potential.
Compressor Market Concentration & Innovation
The global compressor market exhibits a moderately consolidated structure, with a handful of major players holding significant market share. The top 10 companies—including Ingersoll Rand Inc, Ebara Corporation, Sulzer Ltd, Bauer Compressors Inc, Atlas Copco AB, Baker Hughes Co, Ariel Corporation, Aerzener Maschinenfabrik GmbH, Burckhardt Compression Holding AG, and Siemens Energy AG—account for approximately xx% of the overall market in 2025. Market share analysis reveals a dynamic landscape with ongoing competition and strategic maneuvering.
Innovation is a key driver within the compressor market, spurred by the increasing demand for energy efficiency, improved reliability, and reduced environmental impact. Major advancements include the development of variable-speed drives, improved lubrication systems, and the adoption of advanced materials. Regulatory frameworks, particularly those focused on emissions reduction and energy conservation, are significantly influencing innovation and product development. The market also witnesses active M&A activity, with deal values reaching xx Million in 2024, driving consolidation and technological integration. Substitute technologies, such as vacuum pumps and other fluid-handling systems, pose some level of competitive pressure, though the inherent advantages of compressors often outweigh the alternatives. End-user trends toward automation and digitalization are further fueling innovation in areas such as smart compressors and predictive maintenance.
- Market Share: Top 10 companies hold approximately xx% of the market (2025).
- M&A Activity: Deal values totaled xx Million in 2024.
- Innovation Drivers: Energy efficiency, reliability, environmental regulations, automation.
- Key Competitors: Ingersoll Rand Inc, Ebara Corporation, Sulzer Ltd, Bauer Compressors Inc, Atlas Copco AB.
Compressor Market Industry Trends & Insights
The global compressor market is poised for robust growth during the forecast period (2025-2033), driven by several key factors. The expanding oil and gas industry, particularly in developing economies, is a major catalyst, demanding high-capacity compressors for extraction and processing. Growth in the power sector, with its reliance on compressed air for various applications, fuels further demand. The manufacturing and chemical industries also represent significant growth segments, requiring compressors for diverse processes such as pneumatic tools, material handling, and chemical reactions. Technological advancements, particularly in energy-efficient designs and smart controls, are enhancing the appeal of compressors across various industries. Consumer preferences are shifting towards eco-friendly and high-performance solutions, leading to increased adoption of compressors with advanced features. Competitive dynamics are intense, with leading players focusing on innovation, strategic partnerships, and expansion into new markets to maintain a competitive edge. The Compound Annual Growth Rate (CAGR) for the global compressor market is projected at xx% from 2025 to 2033. Market penetration in emerging economies is expected to significantly increase during this period.
Dominant Markets & Segments in Compressor Market
The Oil and Gas Industry and the Power Sector represent the largest segments of the compressor market globally, with strong growth projected across both sectors.
By End-User:
- Oil and Gas Industry: Dominated by positive displacement compressors; driven by exploration and production activities, particularly in developing regions with substantial hydrocarbon reserves. Key drivers include rising energy demand and investments in upstream infrastructure.
- Power Sector: Significant demand for both positive displacement and dynamic compressors in power generation plants; driven by increasing power generation capacity and upgrades to existing facilities. Government policies promoting renewable energy sources and energy efficiency influence growth.
- Manufacturing Sector: Moderate growth, with diverse applications across various manufacturing sub-sectors; influenced by industrial automation and the adoption of compressed air-based technologies.
- Chemicals and Petrochemical Industry: Significant demand for specialized compressors to handle corrosive and high-pressure applications; driven by growth in the chemical industry and the production of petrochemical products.
- Other End-Users: Includes a variety of sectors, such as healthcare and food processing, with modest growth potential.
By Type:
- Positive Displacement: Larger market share, preferred for high-pressure applications and specific process needs; technological advancements leading to higher efficiency and durability.
- Dynamic: Growing segment, particularly in applications requiring high flow rates and less stringent pressure requirements; advancements in centrifugal and axial compressor technologies are enhancing their market appeal.
Compressor Market Product Developments
Recent product innovations in the compressor market focus on energy efficiency, improved reliability, and reduced environmental impact. Manufacturers are incorporating advanced materials, variable-speed drives, and intelligent control systems to enhance performance and reduce operational costs. These advancements cater to the increasing demand for sustainable and high-performance compressors in diverse applications, improving market fit and creating a competitive advantage.
Report Scope & Segmentation Analysis
This report segments the compressor market by end-user (Oil and Gas Industry, Power Sector, Manufacturing Sector, Chemicals and Petrochemical Industry, Other End-Users) and by type (Positive Displacement, Dynamic). Each segment is analyzed in detail, providing insights into market size, growth projections, and competitive dynamics. For instance, the Oil and Gas segment demonstrates significant growth driven by rising global energy demand, while the positive displacement type holds a larger market share due to its suitability for high-pressure applications. Growth projections vary across segments, reflecting differing industry dynamics and technological advancements.
Key Drivers of Compressor Market Growth
Key drivers fueling the compressor market's growth include:
- Rising Energy Demand: Global energy consumption continues to increase, driving demand for compressors in oil and gas extraction, power generation, and industrial processes.
- Industrialization and Infrastructure Development: Expanding industrial activities and infrastructure projects in developing economies boost demand for compressors across diverse sectors.
- Technological Advancements: Innovations in compressor design, materials, and control systems enhance efficiency and performance, leading to increased adoption.
Challenges in the Compressor Market Sector
Challenges facing the compressor market include:
- Stringent Environmental Regulations: Regulations aimed at reducing emissions and improving energy efficiency can increase production costs and affect profitability.
- Supply Chain Disruptions: Global supply chain volatility can impact the availability of raw materials and components, affecting production and delivery timelines.
- Intense Competition: The market is characterized by intense competition, with manufacturers constantly striving for innovation and cost optimization.
Emerging Opportunities in Compressor Market
Emerging opportunities in the compressor market include:
- Growth in Renewable Energy: The increasing adoption of renewable energy sources, such as wind and solar power, creates opportunities for compressors in energy storage and grid management.
- Advancements in Smart Technologies: The integration of smart technologies, such as IoT and AI, offers opportunities for enhanced compressor monitoring, predictive maintenance, and optimized operation.
- Expansion into Emerging Markets: Developing economies present significant growth potential for compressor manufacturers seeking to expand their market reach.
Leading Players in the Compressor Market Market
- Ingersoll Rand Inc
- Ebara Corporation
- Sulzer Ltd
- Bauer Compressors Inc
- Atlas Copco AB
- Baker Hughes Co
- Ariel Corporation
- Aerzener Maschinenfabrik GmbH
- Burckhardt Compression Holding AG
- Siemens Energy AG
Key Developments in Compressor Market Industry
- April 2024: The Srikail gas field in Cumilla, Bangladesh, signed a contract for three wellhead compressors (10 Million cubic feet per day capacity), highlighting the significant investments in the oil and gas sector.
- March 2023: Sapphire Gas Solutions and Bauer Compressors Inc. formed a national partnership, strengthening Bauer's market presence and service capabilities across North America.
Strategic Outlook for Compressor Market Market
The compressor market is projected to experience sustained growth driven by increasing industrialization, rising energy demand, and technological advancements. The focus on energy efficiency, sustainability, and smart technologies will further shape the market landscape. Opportunities exist for manufacturers to capitalize on expanding markets in developing economies and integrate innovative solutions to meet evolving industry needs. The market’s future potential is substantial, offering attractive prospects for growth and investment.
Compressor Market Segmentation
-
1. End-User
- 1.1. Oil and Gas Industry
- 1.2. Power Sector
- 1.3. Manufacturing Sector
- 1.4. Chemicals and Petrochemical Industry
- 1.5. Other End-Users
-
2. Type
- 2.1. Positive Displacement
- 2.2. Dynamic
Compressor Market Segmentation By Geography
-
1. North America
- 1.1. United States
- 1.2. Canada
- 1.3. Rest of North America
-
2. Europe
- 2.1. Germany
- 2.2. France
- 2.3. United Kingdom
- 2.4. Spain
- 2.5. Norway
- 2.6. Turkey
- 2.7. Russia
- 2.8. NORDIC
- 2.9. Rest of Europe
-
3. Asia Pacific
- 3.1. China
- 3.2. India
- 3.3. Malaysia
- 3.4. Thailand
- 3.5. Australia
- 3.6. Indonesia
- 3.7. Vietnam
- 4. Rest of Asia Pacific
-
5. South America
- 5.1. Brazil
- 5.2. Argentina
- 5.3. Colombia
- 5.4. Rest of South America
-
6. Middle East and Africa
- 6.1. Saudi Arabia
- 6.2. United Arab Emirates
- 6.3. South Africa
- 6.4. Nigeria
- 6.5. Qatar
- 7. Egypt
- 8. Rest of Middle East and Africa
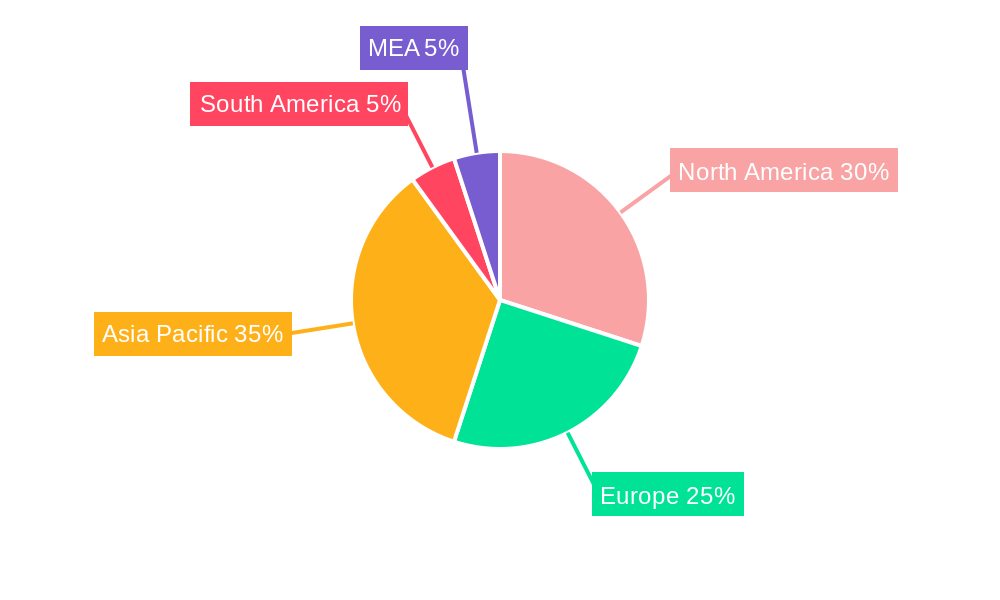
Compressor Market Regional Market Share
Geographic Coverage of Compressor Market
Compressor Market REPORT HIGHLIGHTS
| Aspects | Details |
|---|---|
| Study Period | 2020-2034 |
| Base Year | 2025 |
| Estimated Year | 2026 |
| Forecast Period | 2026-2034 |
| Historical Period | 2020-2025 |
| Growth Rate | CAGR of 4.81% from 2020-2034 |
| Segmentation |
|
Table of Contents
- 1. Introduction
- 1.1. Research Scope
- 1.2. Market Segmentation
- 1.3. Research Objective
- 1.4. Definitions and Assumptions
- 2. Executive Summary
- 2.1. Market Snapshot
- 3. Market Dynamics
- 3.1. Market Drivers
- 3.2. Market Restrains
- 3.3. Market Trends
- 3.4. Market Opportunities
- 4. Market Factor Analysis
- 4.1. Porters Five Forces
- 4.1.1. Bargaining Power of Suppliers
- 4.1.2. Bargaining Power of Buyers
- 4.1.3. Threat of New Entrants
- 4.1.4. Threat of Substitutes
- 4.1.5. Competitive Rivalry
- 4.2. PESTEL analysis
- 4.3. BCG Analysis
- 4.3.1. Stars (High Growth, High Market Share)
- 4.3.2. Cash Cows (Low Growth, High Market Share)
- 4.3.3. Question Mark (High Growth, Low Market Share)
- 4.3.4. Dogs (Low Growth, Low Market Share)
- 4.4. Ansoff Matrix Analysis
- 4.5. Supply Chain Analysis
- 4.6. Regulatory Landscape
- 4.7. Current Market Potential and Opportunity Assessment (TAM–SAM–SOM Framework)
- 4.8. RAX Analyst Note
- 4.1. Porters Five Forces
- 5. Market Analysis, Insights and Forecast 2021-2033
- 5.1. Market Analysis, Insights and Forecast - by End-User
- 5.1.1. Oil and Gas Industry
- 5.1.2. Power Sector
- 5.1.3. Manufacturing Sector
- 5.1.4. Chemicals and Petrochemical Industry
- 5.1.5. Other End-Users
- 5.2. Market Analysis, Insights and Forecast - by Type
- 5.2.1. Positive Displacement
- 5.2.2. Dynamic
- 5.3. Market Analysis, Insights and Forecast - by Region
- 5.3.1. North America
- 5.3.2. Europe
- 5.3.3. Asia Pacific
- 5.3.4. Rest of Asia Pacific
- 5.3.5. South America
- 5.3.6. Middle East and Africa
- 5.3.7. Egypt
- 5.3.8. Rest of Middle East and Africa
- 5.1. Market Analysis, Insights and Forecast - by End-User
- 6. Global Compressor Market Analysis, Insights and Forecast, 2021-2033
- 6.1. Market Analysis, Insights and Forecast - by End-User
- 6.1.1. Oil and Gas Industry
- 6.1.2. Power Sector
- 6.1.3. Manufacturing Sector
- 6.1.4. Chemicals and Petrochemical Industry
- 6.1.5. Other End-Users
- 6.2. Market Analysis, Insights and Forecast - by Type
- 6.2.1. Positive Displacement
- 6.2.2. Dynamic
- 6.1. Market Analysis, Insights and Forecast - by End-User
- 7. North America Compressor Market Analysis, Insights and Forecast, 2020-2032
- 7.1. Market Analysis, Insights and Forecast - by End-User
- 7.1.1. Oil and Gas Industry
- 7.1.2. Power Sector
- 7.1.3. Manufacturing Sector
- 7.1.4. Chemicals and Petrochemical Industry
- 7.1.5. Other End-Users
- 7.2. Market Analysis, Insights and Forecast - by Type
- 7.2.1. Positive Displacement
- 7.2.2. Dynamic
- 7.1. Market Analysis, Insights and Forecast - by End-User
- 8. Europe Compressor Market Analysis, Insights and Forecast, 2020-2032
- 8.1. Market Analysis, Insights and Forecast - by End-User
- 8.1.1. Oil and Gas Industry
- 8.1.2. Power Sector
- 8.1.3. Manufacturing Sector
- 8.1.4. Chemicals and Petrochemical Industry
- 8.1.5. Other End-Users
- 8.2. Market Analysis, Insights and Forecast - by Type
- 8.2.1. Positive Displacement
- 8.2.2. Dynamic
- 8.1. Market Analysis, Insights and Forecast - by End-User
- 9. Asia Pacific Compressor Market Analysis, Insights and Forecast, 2020-2032
- 9.1. Market Analysis, Insights and Forecast - by End-User
- 9.1.1. Oil and Gas Industry
- 9.1.2. Power Sector
- 9.1.3. Manufacturing Sector
- 9.1.4. Chemicals and Petrochemical Industry
- 9.1.5. Other End-Users
- 9.2. Market Analysis, Insights and Forecast - by Type
- 9.2.1. Positive Displacement
- 9.2.2. Dynamic
- 9.1. Market Analysis, Insights and Forecast - by End-User
- 10. Rest of Asia Pacific Compressor Market Analysis, Insights and Forecast, 2020-2032
- 10.1. Market Analysis, Insights and Forecast - by End-User
- 10.1.1. Oil and Gas Industry
- 10.1.2. Power Sector
- 10.1.3. Manufacturing Sector
- 10.1.4. Chemicals and Petrochemical Industry
- 10.1.5. Other End-Users
- 10.2. Market Analysis, Insights and Forecast - by Type
- 10.2.1. Positive Displacement
- 10.2.2. Dynamic
- 10.1. Market Analysis, Insights and Forecast - by End-User
- 11. South America Compressor Market Analysis, Insights and Forecast, 2020-2032
- 11.1. Market Analysis, Insights and Forecast - by End-User
- 11.1.1. Oil and Gas Industry
- 11.1.2. Power Sector
- 11.1.3. Manufacturing Sector
- 11.1.4. Chemicals and Petrochemical Industry
- 11.1.5. Other End-Users
- 11.2. Market Analysis, Insights and Forecast - by Type
- 11.2.1. Positive Displacement
- 11.2.2. Dynamic
- 11.1. Market Analysis, Insights and Forecast - by End-User
- 12. Middle East and Africa Compressor Market Analysis, Insights and Forecast, 2020-2032
- 12.1. Market Analysis, Insights and Forecast - by End-User
- 12.1.1. Oil and Gas Industry
- 12.1.2. Power Sector
- 12.1.3. Manufacturing Sector
- 12.1.4. Chemicals and Petrochemical Industry
- 12.1.5. Other End-Users
- 12.2. Market Analysis, Insights and Forecast - by Type
- 12.2.1. Positive Displacement
- 12.2.2. Dynamic
- 12.1. Market Analysis, Insights and Forecast - by End-User
- 13. Egypt Compressor Market Analysis, Insights and Forecast, 2020-2032
- 13.1. Market Analysis, Insights and Forecast - by End-User
- 13.1.1. Oil and Gas Industry
- 13.1.2. Power Sector
- 13.1.3. Manufacturing Sector
- 13.1.4. Chemicals and Petrochemical Industry
- 13.1.5. Other End-Users
- 13.2. Market Analysis, Insights and Forecast - by Type
- 13.2.1. Positive Displacement
- 13.2.2. Dynamic
- 13.1. Market Analysis, Insights and Forecast - by End-User
- 14. Rest of Middle East and Africa Compressor Market Analysis, Insights and Forecast, 2020-2032
- 14.1. Market Analysis, Insights and Forecast - by End-User
- 14.1.1. Oil and Gas Industry
- 14.1.2. Power Sector
- 14.1.3. Manufacturing Sector
- 14.1.4. Chemicals and Petrochemical Industry
- 14.1.5. Other End-Users
- 14.2. Market Analysis, Insights and Forecast - by Type
- 14.2.1. Positive Displacement
- 14.2.2. Dynamic
- 14.1. Market Analysis, Insights and Forecast - by End-User
- 15. Competitive Analysis
- 15.1. Company Profiles
- 15.1.1 Ingersoll Rand Inc
- 15.1.1.1. Company Overview
- 15.1.1.2. Products
- 15.1.1.3. Company Financials
- 15.1.1.4. SWOT Analysis
- 15.1.2 Ebara Corporation
- 15.1.2.1. Company Overview
- 15.1.2.2. Products
- 15.1.2.3. Company Financials
- 15.1.2.4. SWOT Analysis
- 15.1.3 Sulzer Ltd*List Not Exhaustive 6 4 Market Ranking/ Share Analysi
- 15.1.3.1. Company Overview
- 15.1.3.2. Products
- 15.1.3.3. Company Financials
- 15.1.3.4. SWOT Analysis
- 15.1.4 Bauer Compressors Inc
- 15.1.4.1. Company Overview
- 15.1.4.2. Products
- 15.1.4.3. Company Financials
- 15.1.4.4. SWOT Analysis
- 15.1.5 Atlas Copco AB
- 15.1.5.1. Company Overview
- 15.1.5.2. Products
- 15.1.5.3. Company Financials
- 15.1.5.4. SWOT Analysis
- 15.1.6 Baker Hughes Co
- 15.1.6.1. Company Overview
- 15.1.6.2. Products
- 15.1.6.3. Company Financials
- 15.1.6.4. SWOT Analysis
- 15.1.7 Ariel Corporation
- 15.1.7.1. Company Overview
- 15.1.7.2. Products
- 15.1.7.3. Company Financials
- 15.1.7.4. SWOT Analysis
- 15.1.8 Aerzener Maschinenfabrik GmbH
- 15.1.8.1. Company Overview
- 15.1.8.2. Products
- 15.1.8.3. Company Financials
- 15.1.8.4. SWOT Analysis
- 15.1.9 Burckhardt Compression Holding AG
- 15.1.9.1. Company Overview
- 15.1.9.2. Products
- 15.1.9.3. Company Financials
- 15.1.9.4. SWOT Analysis
- 15.1.10 Siemens Energy AG
- 15.1.10.1. Company Overview
- 15.1.10.2. Products
- 15.1.10.3. Company Financials
- 15.1.10.4. SWOT Analysis
- 15.1.1 Ingersoll Rand Inc
- 15.2. Market Entropy
- 15.2.1 Company's Key Areas Served
- 15.2.2 Recent Developments
- 15.3. Company Market Share Analysis 2025
- 15.3.1 Top 5 Companies Market Share Analysis
- 15.3.2 Top 3 Companies Market Share Analysis
- 15.4. List of Potential Customers
- 16. Research Methodology
List of Figures
- Figure 1: Global Compressor Market Revenue Breakdown (Million, %) by Region 2025 & 2033
- Figure 2: North America Compressor Market Revenue (Million), by End-User 2025 & 2033
- Figure 3: North America Compressor Market Revenue Share (%), by End-User 2025 & 2033
- Figure 4: North America Compressor Market Revenue (Million), by Type 2025 & 2033
- Figure 5: North America Compressor Market Revenue Share (%), by Type 2025 & 2033
- Figure 6: North America Compressor Market Revenue (Million), by Country 2025 & 2033
- Figure 7: North America Compressor Market Revenue Share (%), by Country 2025 & 2033
- Figure 8: Europe Compressor Market Revenue (Million), by End-User 2025 & 2033
- Figure 9: Europe Compressor Market Revenue Share (%), by End-User 2025 & 2033
- Figure 10: Europe Compressor Market Revenue (Million), by Type 2025 & 2033
- Figure 11: Europe Compressor Market Revenue Share (%), by Type 2025 & 2033
- Figure 12: Europe Compressor Market Revenue (Million), by Country 2025 & 2033
- Figure 13: Europe Compressor Market Revenue Share (%), by Country 2025 & 2033
- Figure 14: Asia Pacific Compressor Market Revenue (Million), by End-User 2025 & 2033
- Figure 15: Asia Pacific Compressor Market Revenue Share (%), by End-User 2025 & 2033
- Figure 16: Asia Pacific Compressor Market Revenue (Million), by Type 2025 & 2033
- Figure 17: Asia Pacific Compressor Market Revenue Share (%), by Type 2025 & 2033
- Figure 18: Asia Pacific Compressor Market Revenue (Million), by Country 2025 & 2033
- Figure 19: Asia Pacific Compressor Market Revenue Share (%), by Country 2025 & 2033
- Figure 20: Rest of Asia Pacific Compressor Market Revenue (Million), by End-User 2025 & 2033
- Figure 21: Rest of Asia Pacific Compressor Market Revenue Share (%), by End-User 2025 & 2033
- Figure 22: Rest of Asia Pacific Compressor Market Revenue (Million), by Type 2025 & 2033
- Figure 23: Rest of Asia Pacific Compressor Market Revenue Share (%), by Type 2025 & 2033
- Figure 24: Rest of Asia Pacific Compressor Market Revenue (Million), by Country 2025 & 2033
- Figure 25: Rest of Asia Pacific Compressor Market Revenue Share (%), by Country 2025 & 2033
- Figure 26: South America Compressor Market Revenue (Million), by End-User 2025 & 2033
- Figure 27: South America Compressor Market Revenue Share (%), by End-User 2025 & 2033
- Figure 28: South America Compressor Market Revenue (Million), by Type 2025 & 2033
- Figure 29: South America Compressor Market Revenue Share (%), by Type 2025 & 2033
- Figure 30: South America Compressor Market Revenue (Million), by Country 2025 & 2033
- Figure 31: South America Compressor Market Revenue Share (%), by Country 2025 & 2033
- Figure 32: Middle East and Africa Compressor Market Revenue (Million), by End-User 2025 & 2033
- Figure 33: Middle East and Africa Compressor Market Revenue Share (%), by End-User 2025 & 2033
- Figure 34: Middle East and Africa Compressor Market Revenue (Million), by Type 2025 & 2033
- Figure 35: Middle East and Africa Compressor Market Revenue Share (%), by Type 2025 & 2033
- Figure 36: Middle East and Africa Compressor Market Revenue (Million), by Country 2025 & 2033
- Figure 37: Middle East and Africa Compressor Market Revenue Share (%), by Country 2025 & 2033
- Figure 38: Egypt Compressor Market Revenue (Million), by End-User 2025 & 2033
- Figure 39: Egypt Compressor Market Revenue Share (%), by End-User 2025 & 2033
- Figure 40: Egypt Compressor Market Revenue (Million), by Type 2025 & 2033
- Figure 41: Egypt Compressor Market Revenue Share (%), by Type 2025 & 2033
- Figure 42: Egypt Compressor Market Revenue (Million), by Country 2025 & 2033
- Figure 43: Egypt Compressor Market Revenue Share (%), by Country 2025 & 2033
- Figure 44: Rest of Middle East and Africa Compressor Market Revenue (Million), by End-User 2025 & 2033
- Figure 45: Rest of Middle East and Africa Compressor Market Revenue Share (%), by End-User 2025 & 2033
- Figure 46: Rest of Middle East and Africa Compressor Market Revenue (Million), by Type 2025 & 2033
- Figure 47: Rest of Middle East and Africa Compressor Market Revenue Share (%), by Type 2025 & 2033
- Figure 48: Rest of Middle East and Africa Compressor Market Revenue (Million), by Country 2025 & 2033
- Figure 49: Rest of Middle East and Africa Compressor Market Revenue Share (%), by Country 2025 & 2033
List of Tables
- Table 1: Global Compressor Market Revenue Million Forecast, by End-User 2020 & 2033
- Table 2: Global Compressor Market Revenue Million Forecast, by Type 2020 & 2033
- Table 3: Global Compressor Market Revenue Million Forecast, by Region 2020 & 2033
- Table 4: Global Compressor Market Revenue Million Forecast, by End-User 2020 & 2033
- Table 5: Global Compressor Market Revenue Million Forecast, by Type 2020 & 2033
- Table 6: Global Compressor Market Revenue Million Forecast, by Country 2020 & 2033
- Table 7: United States Compressor Market Revenue (Million) Forecast, by Application 2020 & 2033
- Table 8: Canada Compressor Market Revenue (Million) Forecast, by Application 2020 & 2033
- Table 9: Rest of North America Compressor Market Revenue (Million) Forecast, by Application 2020 & 2033
- Table 10: Global Compressor Market Revenue Million Forecast, by End-User 2020 & 2033
- Table 11: Global Compressor Market Revenue Million Forecast, by Type 2020 & 2033
- Table 12: Global Compressor Market Revenue Million Forecast, by Country 2020 & 2033
- Table 13: Germany Compressor Market Revenue (Million) Forecast, by Application 2020 & 2033
- Table 14: France Compressor Market Revenue (Million) Forecast, by Application 2020 & 2033
- Table 15: United Kingdom Compressor Market Revenue (Million) Forecast, by Application 2020 & 2033
- Table 16: Spain Compressor Market Revenue (Million) Forecast, by Application 2020 & 2033
- Table 17: Norway Compressor Market Revenue (Million) Forecast, by Application 2020 & 2033
- Table 18: Turkey Compressor Market Revenue (Million) Forecast, by Application 2020 & 2033
- Table 19: Russia Compressor Market Revenue (Million) Forecast, by Application 2020 & 2033
- Table 20: NORDIC Compressor Market Revenue (Million) Forecast, by Application 2020 & 2033
- Table 21: Rest of Europe Compressor Market Revenue (Million) Forecast, by Application 2020 & 2033
- Table 22: Global Compressor Market Revenue Million Forecast, by End-User 2020 & 2033
- Table 23: Global Compressor Market Revenue Million Forecast, by Type 2020 & 2033
- Table 24: Global Compressor Market Revenue Million Forecast, by Country 2020 & 2033
- Table 25: China Compressor Market Revenue (Million) Forecast, by Application 2020 & 2033
- Table 26: India Compressor Market Revenue (Million) Forecast, by Application 2020 & 2033
- Table 27: Malaysia Compressor Market Revenue (Million) Forecast, by Application 2020 & 2033
- Table 28: Thailand Compressor Market Revenue (Million) Forecast, by Application 2020 & 2033
- Table 29: Australia Compressor Market Revenue (Million) Forecast, by Application 2020 & 2033
- Table 30: Indonesia Compressor Market Revenue (Million) Forecast, by Application 2020 & 2033
- Table 31: Vietnam Compressor Market Revenue (Million) Forecast, by Application 2020 & 2033
- Table 32: Global Compressor Market Revenue Million Forecast, by End-User 2020 & 2033
- Table 33: Global Compressor Market Revenue Million Forecast, by Type 2020 & 2033
- Table 34: Global Compressor Market Revenue Million Forecast, by Country 2020 & 2033
- Table 35: Global Compressor Market Revenue Million Forecast, by End-User 2020 & 2033
- Table 36: Global Compressor Market Revenue Million Forecast, by Type 2020 & 2033
- Table 37: Global Compressor Market Revenue Million Forecast, by Country 2020 & 2033
- Table 38: Brazil Compressor Market Revenue (Million) Forecast, by Application 2020 & 2033
- Table 39: Argentina Compressor Market Revenue (Million) Forecast, by Application 2020 & 2033
- Table 40: Colombia Compressor Market Revenue (Million) Forecast, by Application 2020 & 2033
- Table 41: Rest of South America Compressor Market Revenue (Million) Forecast, by Application 2020 & 2033
- Table 42: Global Compressor Market Revenue Million Forecast, by End-User 2020 & 2033
- Table 43: Global Compressor Market Revenue Million Forecast, by Type 2020 & 2033
- Table 44: Global Compressor Market Revenue Million Forecast, by Country 2020 & 2033
- Table 45: Saudi Arabia Compressor Market Revenue (Million) Forecast, by Application 2020 & 2033
- Table 46: United Arab Emirates Compressor Market Revenue (Million) Forecast, by Application 2020 & 2033
- Table 47: South Africa Compressor Market Revenue (Million) Forecast, by Application 2020 & 2033
- Table 48: Nigeria Compressor Market Revenue (Million) Forecast, by Application 2020 & 2033
- Table 49: Qatar Compressor Market Revenue (Million) Forecast, by Application 2020 & 2033
- Table 50: Global Compressor Market Revenue Million Forecast, by End-User 2020 & 2033
- Table 51: Global Compressor Market Revenue Million Forecast, by Type 2020 & 2033
- Table 52: Global Compressor Market Revenue Million Forecast, by Country 2020 & 2033
- Table 53: Global Compressor Market Revenue Million Forecast, by End-User 2020 & 2033
- Table 54: Global Compressor Market Revenue Million Forecast, by Type 2020 & 2033
- Table 55: Global Compressor Market Revenue Million Forecast, by Country 2020 & 2033
Frequently Asked Questions
1. What is the projected Compound Annual Growth Rate (CAGR) of the Compressor Market?
The projected CAGR is approximately 4.81%.
2. Which companies are prominent players in the Compressor Market?
Key companies in the market include Ingersoll Rand Inc, Ebara Corporation, Sulzer Ltd*List Not Exhaustive 6 4 Market Ranking/ Share Analysi, Bauer Compressors Inc, Atlas Copco AB, Baker Hughes Co, Ariel Corporation, Aerzener Maschinenfabrik GmbH, Burckhardt Compression Holding AG, Siemens Energy AG.
3. What are the main segments of the Compressor Market?
The market segments include End-User, Type.
4. Can you provide details about the market size?
The market size is estimated to be USD 42.04 Million as of 2022.
5. What are some drivers contributing to market growth?
4.; The Growing Demand for Natural Gas4.; Rising Pipeline Infrastructure across Globe.
6. What are the notable trends driving market growth?
Oil and Gas Segment Expected to Dominate the Market.
7. Are there any restraints impacting market growth?
4.; Increasing Adoption of Solar and Wind Energies.
8. Can you provide examples of recent developments in the market?
April 2024: The Srikail gas field in Cumilla signed a contract to receive three wellhead compressors with a capacity of 10 million cubic feet per day, along with related infrastructure, owing to a deal inked by Bangladesh Petroleum Exploration and Production Company Ltd and SC Euro Gas Systems SRL, Romania.
9. What pricing options are available for accessing the report?
Pricing options include single-user, multi-user, and enterprise licenses priced at USD 4750, USD 5250, and USD 8750 respectively.
10. Is the market size provided in terms of value or volume?
The market size is provided in terms of value, measured in Million.
11. Are there any specific market keywords associated with the report?
Yes, the market keyword associated with the report is "Compressor Market," which aids in identifying and referencing the specific market segment covered.
12. How do I determine which pricing option suits my needs best?
The pricing options vary based on user requirements and access needs. Individual users may opt for single-user licenses, while businesses requiring broader access may choose multi-user or enterprise licenses for cost-effective access to the report.
13. Are there any additional resources or data provided in the Compressor Market report?
While the report offers comprehensive insights, it's advisable to review the specific contents or supplementary materials provided to ascertain if additional resources or data are available.
14. How can I stay updated on further developments or reports in the Compressor Market?
To stay informed about further developments, trends, and reports in the Compressor Market, consider subscribing to industry newsletters, following relevant companies and organizations, or regularly checking reputable industry news sources and publications.
Methodology
Step 1 - Identification of Relevant Samples Size from Population Database


Step 2 - Approaches for Defining Global Market Size (Value, Volume* & Price*)

Note*: In applicable scenarios
Step 3 - Data Sources
Primary Research
- Web Analytics
- Survey Reports
- Research Institute
- Latest Research Reports
- Opinion Leaders
Secondary Research
- Annual Reports
- White Paper
- Latest Press Release
- Industry Association
- Paid Database
- Investor Presentations

Step 4 - Data Triangulation
Involves using different sources of information in order to increase the validity of a study
These sources are likely to be stakeholders in a program - participants, other researchers, program staff, other community members, and so on.
Then we put all data in single framework & apply various statistical tools to find out the dynamic on the market.
During the analysis stage, feedback from the stakeholder groups would be compared to determine areas of agreement as well as areas of divergence