
Key Insights
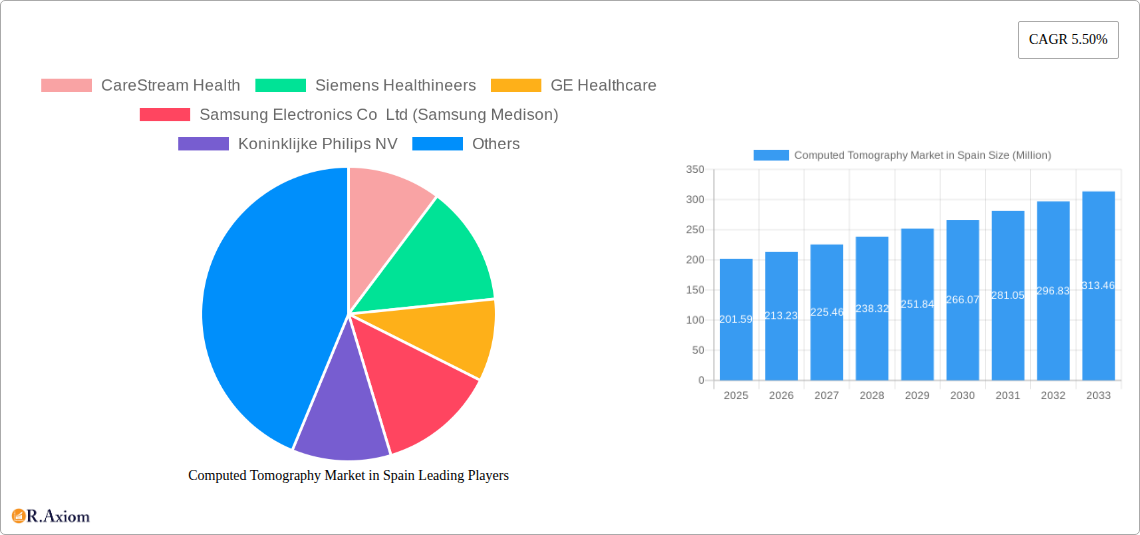
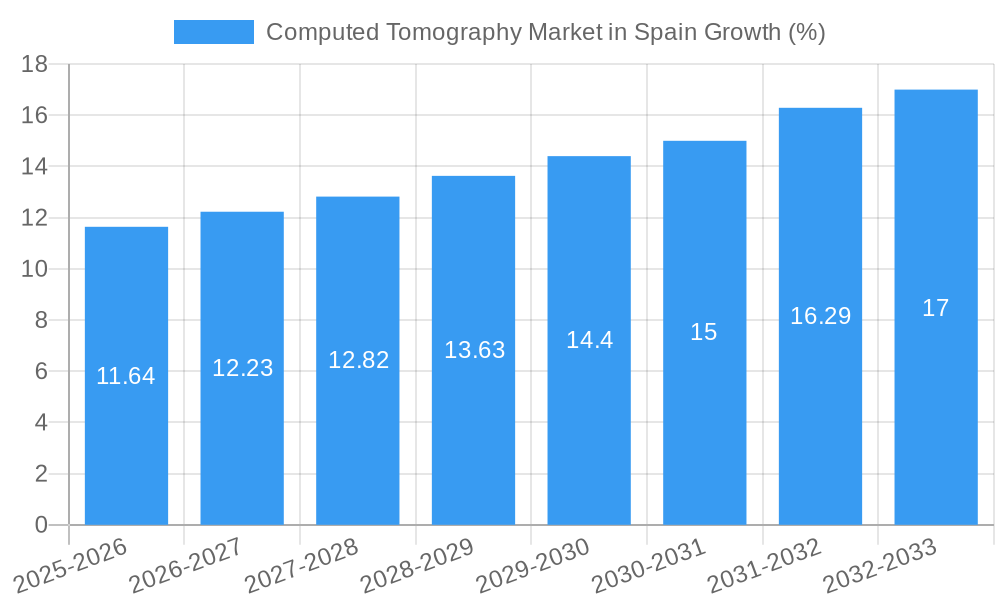
The Spanish Computed Tomography (CT) market, valued at €201.59 million in 2025, is projected to experience robust growth, driven by factors such as an aging population, rising prevalence of chronic diseases necessitating advanced diagnostic imaging, and increasing healthcare expenditure. The market's Compound Annual Growth Rate (CAGR) of 5.50% from 2025 to 2033 indicates a consistent expansion. Technological advancements, including the introduction of multi-slice CT scanners with improved image quality and faster scan times, are further fueling market growth. The increasing adoption of CT scans in various applications, particularly oncology, neurology, and cardiology, contributes significantly to the market's expansion. While the high cost of CT scanners and procedures might present a restraint, the increasing demand for accurate and timely diagnoses is expected to outweigh this factor. Segmentation analysis reveals a diversified market, with high-slice CT scanners likely holding the largest share due to their superior imaging capabilities. Hospitals and diagnostic centers are the primary end-users, reflecting the crucial role of CT in routine clinical practice and specialized medical centers.
The competitive landscape is characterized by the presence of major global players like Siemens Healthineers, GE Healthcare, and Philips, alongside other significant regional players. These companies are focusing on strategic partnerships, technological innovations, and service expansions to maintain their market position. Future growth will be influenced by the government's healthcare policies promoting advanced medical technologies, the continuous development of AI-driven image analysis tools for improved diagnostic accuracy, and the potential integration of CT with other imaging modalities to provide comprehensive patient care. The forecast period, 2025-2033, offers substantial opportunities for market expansion, particularly through the adoption of cutting-edge CT technologies and the expansion of services to underserved areas within Spain. The historical period (2019-2024) provides a solid foundation for projecting future market trends, indicating consistent growth and market maturation.
Computed Tomography (CT) Market in Spain: A Comprehensive Market Report (2019-2033)
This detailed report provides a comprehensive analysis of the Computed Tomography (CT) market in Spain, covering the period from 2019 to 2033. It offers valuable insights into market dynamics, segmentation, key players, and future growth prospects, equipping stakeholders with actionable intelligence for strategic decision-making. The report utilizes robust data and detailed analysis to offer a granular understanding of this critical sector within the Spanish healthcare landscape.
Computed Tomography Market in Spain Market Concentration & Innovation
The Spanish CT market exhibits a moderately concentrated landscape, with a few major multinational players holding significant market share. Market concentration is further influenced by the consolidation of healthcare providers and the increasing adoption of advanced imaging technologies. Key metrics such as market share and M&A activity within the period are analyzed. The report quantifies the market share of leading players such as Siemens Healthineers, GE Healthcare, and Philips, revealing their dominance. Innovation in the CT market is driven by technological advancements, regulatory changes, and increasing demand for advanced imaging solutions. The report examines the role of photon-counting CT technology, AI integration for image analysis, and the impact of these innovations on market growth. The regulatory framework in Spain plays a significant role in shaping the market, influencing both innovation and adoption rates. Product substitution, primarily from other medical imaging modalities, poses a competitive challenge. M&A activities in the sector are evaluated, examining their influence on market consolidation and the introduction of new technologies. Deal values are analyzed and their impact assessed. The report also explores end-user trends, such as the shift towards private healthcare, and analyzes their effect on market dynamics. Specific examples of significant M&A deals are included, with the estimated value of each transaction. The report utilizes a combination of secondary data and proprietary analysis to provide a comprehensive view of the market dynamics.
Computed Tomography Market in Spain Industry Trends & Insights
The Spanish CT market is experiencing substantial growth, driven by factors such as an aging population, rising prevalence of chronic diseases, and increasing government healthcare spending. The Compound Annual Growth Rate (CAGR) for the forecast period (2025-2033) is estimated at xx%, reflecting robust growth. Market penetration of CT scanners in hospitals and diagnostic centers is also analyzed. Technological disruptions, such as the introduction of photon-counting CT and AI-powered image analysis, are reshaping the competitive landscape and driving higher adoption rates. Consumer preferences are shifting toward faster, higher-resolution, and less radiation-intensive scanning technologies. The report delves into these trends, quantifying their impact on market growth. The competitive dynamics are analyzed through Porter's Five Forces framework, assessing factors such as the bargaining power of buyers (hospitals and diagnostic centers) and the threat of new entrants. The report explores factors impacting pricing strategies and market positioning of major players. Furthermore, a detailed analysis of the impact of changing healthcare policies and reimbursement models on the industry is included. Overall market size and growth projections are provided for each segment and sub-segment analyzed.
Dominant Markets & Segments in Computed Tomography Market in Spain
While data on specific regional dominance isn't readily available, this report analyzes the leading segments within the Spanish CT market. The analysis reveals the dominance of specific application areas and end-users.
Dominant Application Segment: Oncology is likely the dominant application segment, driven by the increasing incidence of cancer and the crucial role of CT in diagnosis and treatment planning. Cardiovascular applications are also significant due to their importance in diagnosis and management of heart disease.
Dominant End-User Segment: Hospitals are the primary end-users of CT scanners in Spain, reflecting their role in providing comprehensive diagnostic services. However, the growth of private diagnostic centers is impacting market share and influencing the competitive landscape.
Dominant CT Type Segment: High-slice CT scanners are expected to dominate due to their superior image quality and faster scan times. However, the affordability and accessibility of medium-slice CT scanners could lead to increased adoption in specific segments.
Key Drivers of Segment Dominance:
- Oncology: High prevalence of cancer, increasing demand for advanced diagnostic imaging.
- Hospitals: Central role in providing comprehensive healthcare services, higher investment capacity.
- High-Slice CT: Superior image quality, faster scan times, improved diagnostic accuracy.
The report provides a detailed breakdown of market size and growth projections for each segment, alongside an analysis of the factors driving their dominance.
Computed Tomography Market in Spain Product Developments
Recent advancements in CT technology, such as the introduction of photon-counting detectors and AI-powered image reconstruction, have significantly improved image quality, reduced radiation dose, and enhanced diagnostic capabilities. These innovations offer competitive advantages by enabling faster, more accurate diagnoses and improved patient outcomes. The market's focus is on developing systems with higher resolution, reduced scan times, and enhanced workflow integration. The integration of AI and machine learning into CT systems allows for automated image analysis and interpretation, accelerating the diagnostic process and improving efficiency. These technological trends are driving market growth and influencing competitive dynamics within the industry.
Report Scope & Segmentation Analysis
This report segments the Spanish CT market across various parameters:
By Type: Low Slice, Medium Slice, High Slice. Each segment's market size, growth projections, and competitive dynamics are analyzed, providing insights into specific opportunities and challenges.
By Application: Oncology, Neurology, Cardiovascular, Musculoskeletal, Other Applications. The report provides a detailed analysis of each application area, highlighting their growth drivers, market size, and competitive landscape.
By End-User: Hospitals, Diagnostic Centers, Other End Users. The report examines the distinct characteristics of each end-user segment, including their specific needs, purchasing patterns, and influence on market growth.
Growth projections, market sizes, and competitive dynamics are included for each segment.
Key Drivers of Computed Tomography Market in Spain Growth
The growth of the Spanish CT market is primarily driven by several factors: the increasing prevalence of chronic diseases necessitating advanced diagnostic tools; technological advancements leading to improved image quality and reduced radiation dose; rising government investments in healthcare infrastructure; and the growing adoption of private healthcare, stimulating demand for advanced imaging services. The ongoing expansion of healthcare facilities and the increasing affordability of CT technology further accelerate market growth.
Challenges in the Computed Tomography Market in Spain Sector
Challenges faced by the Spanish CT market include high initial investment costs associated with purchasing and maintaining CT scanners; the need for skilled technicians and radiologists to operate and interpret the images; budgetary constraints faced by some healthcare providers; and stringent regulatory requirements influencing the adoption of new technologies. These factors can impact the market's growth trajectory and profitability. The availability and pricing of essential components and spare parts for CT scanners can also create supply chain challenges that potentially affect the ongoing operation of existing machines.
Emerging Opportunities in Computed Tomography Market in Spain
Emerging opportunities lie in the increasing adoption of AI-powered image analysis to improve diagnostic accuracy and efficiency; the expansion of mobile and portable CT systems to improve accessibility; and the growing demand for advanced imaging solutions in specialized medical applications. These trends present growth potential for innovative players and companies adapting to changing technological advances. Furthermore, focusing on cost-effective and efficient service models can offer substantial opportunities for expansion.
Leading Players in the Computed Tomography Market in Spain Market
- CareStream Health
- Siemens Healthineers Siemens Healthineers
- GE Healthcare GE Healthcare
- Samsung Electronics Co Ltd (Samsung Medison)
- Koninklijke Philips NV Koninklijke Philips NV
- Canon Medical Systems Corporation Canon Medical Systems Corporation
- Planmed Oy
- Fujifilm Holdings Corporation Fujifilm Holdings Corporation
Key Developments in Computed Tomography Market in Spain Industry
- November 2021: Siemens Healthineers launched the NAEOTOM Alpha, the world's first photon-counting CT scanner, impacting market competitiveness through technological leadership.
- May 2021: Philips secured a contract with Viamed, a leading private hospital group in Spain, for the installation of advanced diagnostic imaging solutions, increasing market penetration.
Strategic Outlook for Computed Tomography Market in Spain Market
The Spanish CT market is poised for continued growth, driven by ongoing technological innovation, increasing healthcare expenditure, and a rising prevalence of chronic diseases. Strategic opportunities exist for companies focusing on developing advanced features like AI-powered image analysis, mobile CT systems, and cost-effective service models. Focus on addressing regulatory hurdles and fostering collaboration with healthcare providers will be crucial for success. The integration of data analytics and telehealth solutions will play an increasingly significant role in future growth.
Computed Tomography Market in Spain Segmentation
-
1. Type
- 1.1. Low Slice
- 1.2. Medium Slice
- 1.3. High Slice
-
2. Application
- 2.1. Oncology
- 2.2. Neurology
- 2.3. Cardiovascular
- 2.4. Musculoskeletal
- 2.5. Other Applications
-
3. End User
- 3.1. Hospitals
- 3.2. Diagnostic Centers
- 3.3. Other End Users
Computed Tomography Market in Spain Segmentation By Geography
-
1. North America
- 1.1. United States
- 1.2. Canada
- 1.3. Mexico
-
2. South America
- 2.1. Brazil
- 2.2. Argentina
- 2.3. Rest of South America
-
3. Europe
- 3.1. United Kingdom
- 3.2. Germany
- 3.3. France
- 3.4. Italy
- 3.5. Spain
- 3.6. Russia
- 3.7. Benelux
- 3.8. Nordics
- 3.9. Rest of Europe
-
4. Middle East & Africa
- 4.1. Turkey
- 4.2. Israel
- 4.3. GCC
- 4.4. North Africa
- 4.5. South Africa
- 4.6. Rest of Middle East & Africa
-
5. Asia Pacific
- 5.1. China
- 5.2. India
- 5.3. Japan
- 5.4. South Korea
- 5.5. ASEAN
- 5.6. Oceania
- 5.7. Rest of Asia Pacific
Computed Tomography Market in Spain REPORT HIGHLIGHTS
| Aspects | Details |
|---|---|
| Study Period | 2019-2033 |
| Base Year | 2024 |
| Estimated Year | 2025 |
| Forecast Period | 2025-2033 |
| Historical Period | 2019-2024 |
| Growth Rate | CAGR of 5.50% from 2019-2033 |
| Segmentation |
|
Table of Contents
- 1. Introduction
- 1.1. Research Scope
- 1.2. Market Segmentation
- 1.3. Research Methodology
- 1.4. Definitions and Assumptions
- 2. Executive Summary
- 2.1. Introduction
- 3. Market Dynamics
- 3.1. Introduction
- 3.2. Market Drivers
- 3.2.1. Increasing Geriatric Population and Chronic Disease Burden; Technological Advancements in Computed Tomography
- 3.3. Market Restrains
- 3.3.1. High Cost Associated With CT Scan Procedure and Equipment
- 3.4. Market Trends
- 3.4.1. Oncology is Expected to Dominate the Application Segment
- 4. Market Factor Analysis
- 4.1. Porters Five Forces
- 4.2. Supply/Value Chain
- 4.3. PESTEL analysis
- 4.4. Market Entropy
- 4.5. Patent/Trademark Analysis
- 5. Global Computed Tomography Market in Spain Analysis, Insights and Forecast, 2019-2031
- 5.1. Market Analysis, Insights and Forecast - by Type
- 5.1.1. Low Slice
- 5.1.2. Medium Slice
- 5.1.3. High Slice
- 5.2. Market Analysis, Insights and Forecast - by Application
- 5.2.1. Oncology
- 5.2.2. Neurology
- 5.2.3. Cardiovascular
- 5.2.4. Musculoskeletal
- 5.2.5. Other Applications
- 5.3. Market Analysis, Insights and Forecast - by End User
- 5.3.1. Hospitals
- 5.3.2. Diagnostic Centers
- 5.3.3. Other End Users
- 5.4. Market Analysis, Insights and Forecast - by Region
- 5.4.1. North America
- 5.4.2. South America
- 5.4.3. Europe
- 5.4.4. Middle East & Africa
- 5.4.5. Asia Pacific
- 5.1. Market Analysis, Insights and Forecast - by Type
- 6. North America Computed Tomography Market in Spain Analysis, Insights and Forecast, 2019-2031
- 6.1. Market Analysis, Insights and Forecast - by Type
- 6.1.1. Low Slice
- 6.1.2. Medium Slice
- 6.1.3. High Slice
- 6.2. Market Analysis, Insights and Forecast - by Application
- 6.2.1. Oncology
- 6.2.2. Neurology
- 6.2.3. Cardiovascular
- 6.2.4. Musculoskeletal
- 6.2.5. Other Applications
- 6.3. Market Analysis, Insights and Forecast - by End User
- 6.3.1. Hospitals
- 6.3.2. Diagnostic Centers
- 6.3.3. Other End Users
- 6.1. Market Analysis, Insights and Forecast - by Type
- 7. South America Computed Tomography Market in Spain Analysis, Insights and Forecast, 2019-2031
- 7.1. Market Analysis, Insights and Forecast - by Type
- 7.1.1. Low Slice
- 7.1.2. Medium Slice
- 7.1.3. High Slice
- 7.2. Market Analysis, Insights and Forecast - by Application
- 7.2.1. Oncology
- 7.2.2. Neurology
- 7.2.3. Cardiovascular
- 7.2.4. Musculoskeletal
- 7.2.5. Other Applications
- 7.3. Market Analysis, Insights and Forecast - by End User
- 7.3.1. Hospitals
- 7.3.2. Diagnostic Centers
- 7.3.3. Other End Users
- 7.1. Market Analysis, Insights and Forecast - by Type
- 8. Europe Computed Tomography Market in Spain Analysis, Insights and Forecast, 2019-2031
- 8.1. Market Analysis, Insights and Forecast - by Type
- 8.1.1. Low Slice
- 8.1.2. Medium Slice
- 8.1.3. High Slice
- 8.2. Market Analysis, Insights and Forecast - by Application
- 8.2.1. Oncology
- 8.2.2. Neurology
- 8.2.3. Cardiovascular
- 8.2.4. Musculoskeletal
- 8.2.5. Other Applications
- 8.3. Market Analysis, Insights and Forecast - by End User
- 8.3.1. Hospitals
- 8.3.2. Diagnostic Centers
- 8.3.3. Other End Users
- 8.1. Market Analysis, Insights and Forecast - by Type
- 9. Middle East & Africa Computed Tomography Market in Spain Analysis, Insights and Forecast, 2019-2031
- 9.1. Market Analysis, Insights and Forecast - by Type
- 9.1.1. Low Slice
- 9.1.2. Medium Slice
- 9.1.3. High Slice
- 9.2. Market Analysis, Insights and Forecast - by Application
- 9.2.1. Oncology
- 9.2.2. Neurology
- 9.2.3. Cardiovascular
- 9.2.4. Musculoskeletal
- 9.2.5. Other Applications
- 9.3. Market Analysis, Insights and Forecast - by End User
- 9.3.1. Hospitals
- 9.3.2. Diagnostic Centers
- 9.3.3. Other End Users
- 9.1. Market Analysis, Insights and Forecast - by Type
- 10. Asia Pacific Computed Tomography Market in Spain Analysis, Insights and Forecast, 2019-2031
- 10.1. Market Analysis, Insights and Forecast - by Type
- 10.1.1. Low Slice
- 10.1.2. Medium Slice
- 10.1.3. High Slice
- 10.2. Market Analysis, Insights and Forecast - by Application
- 10.2.1. Oncology
- 10.2.2. Neurology
- 10.2.3. Cardiovascular
- 10.2.4. Musculoskeletal
- 10.2.5. Other Applications
- 10.3. Market Analysis, Insights and Forecast - by End User
- 10.3.1. Hospitals
- 10.3.2. Diagnostic Centers
- 10.3.3. Other End Users
- 10.1. Market Analysis, Insights and Forecast - by Type
- 11. Competitive Analysis
- 11.1. Global Market Share Analysis 2024
- 11.2. Company Profiles
- 11.2.1 CareStream Health
- 11.2.1.1. Overview
- 11.2.1.2. Products
- 11.2.1.3. SWOT Analysis
- 11.2.1.4. Recent Developments
- 11.2.1.5. Financials (Based on Availability)
- 11.2.2 Siemens Healthineers
- 11.2.2.1. Overview
- 11.2.2.2. Products
- 11.2.2.3. SWOT Analysis
- 11.2.2.4. Recent Developments
- 11.2.2.5. Financials (Based on Availability)
- 11.2.3 GE Healthcare
- 11.2.3.1. Overview
- 11.2.3.2. Products
- 11.2.3.3. SWOT Analysis
- 11.2.3.4. Recent Developments
- 11.2.3.5. Financials (Based on Availability)
- 11.2.4 Samsung Electronics Co Ltd (Samsung Medison)
- 11.2.4.1. Overview
- 11.2.4.2. Products
- 11.2.4.3. SWOT Analysis
- 11.2.4.4. Recent Developments
- 11.2.4.5. Financials (Based on Availability)
- 11.2.5 Koninklijke Philips NV
- 11.2.5.1. Overview
- 11.2.5.2. Products
- 11.2.5.3. SWOT Analysis
- 11.2.5.4. Recent Developments
- 11.2.5.5. Financials (Based on Availability)
- 11.2.6 Canon Medical Systems Corporation
- 11.2.6.1. Overview
- 11.2.6.2. Products
- 11.2.6.3. SWOT Analysis
- 11.2.6.4. Recent Developments
- 11.2.6.5. Financials (Based on Availability)
- 11.2.7 Planmed Oy
- 11.2.7.1. Overview
- 11.2.7.2. Products
- 11.2.7.3. SWOT Analysis
- 11.2.7.4. Recent Developments
- 11.2.7.5. Financials (Based on Availability)
- 11.2.8 Fujifilm Holdings Corporation
- 11.2.8.1. Overview
- 11.2.8.2. Products
- 11.2.8.3. SWOT Analysis
- 11.2.8.4. Recent Developments
- 11.2.8.5. Financials (Based on Availability)
- 11.2.1 CareStream Health
List of Figures
- Figure 1: Global Computed Tomography Market in Spain Revenue Breakdown (Million, %) by Region 2024 & 2032
- Figure 2: Spain Computed Tomography Market in Spain Revenue (Million), by Country 2024 & 2032
- Figure 3: Spain Computed Tomography Market in Spain Revenue Share (%), by Country 2024 & 2032
- Figure 4: North America Computed Tomography Market in Spain Revenue (Million), by Type 2024 & 2032
- Figure 5: North America Computed Tomography Market in Spain Revenue Share (%), by Type 2024 & 2032
- Figure 6: North America Computed Tomography Market in Spain Revenue (Million), by Application 2024 & 2032
- Figure 7: North America Computed Tomography Market in Spain Revenue Share (%), by Application 2024 & 2032
- Figure 8: North America Computed Tomography Market in Spain Revenue (Million), by End User 2024 & 2032
- Figure 9: North America Computed Tomography Market in Spain Revenue Share (%), by End User 2024 & 2032
- Figure 10: North America Computed Tomography Market in Spain Revenue (Million), by Country 2024 & 2032
- Figure 11: North America Computed Tomography Market in Spain Revenue Share (%), by Country 2024 & 2032
- Figure 12: South America Computed Tomography Market in Spain Revenue (Million), by Type 2024 & 2032
- Figure 13: South America Computed Tomography Market in Spain Revenue Share (%), by Type 2024 & 2032
- Figure 14: South America Computed Tomography Market in Spain Revenue (Million), by Application 2024 & 2032
- Figure 15: South America Computed Tomography Market in Spain Revenue Share (%), by Application 2024 & 2032
- Figure 16: South America Computed Tomography Market in Spain Revenue (Million), by End User 2024 & 2032
- Figure 17: South America Computed Tomography Market in Spain Revenue Share (%), by End User 2024 & 2032
- Figure 18: South America Computed Tomography Market in Spain Revenue (Million), by Country 2024 & 2032
- Figure 19: South America Computed Tomography Market in Spain Revenue Share (%), by Country 2024 & 2032
- Figure 20: Europe Computed Tomography Market in Spain Revenue (Million), by Type 2024 & 2032
- Figure 21: Europe Computed Tomography Market in Spain Revenue Share (%), by Type 2024 & 2032
- Figure 22: Europe Computed Tomography Market in Spain Revenue (Million), by Application 2024 & 2032
- Figure 23: Europe Computed Tomography Market in Spain Revenue Share (%), by Application 2024 & 2032
- Figure 24: Europe Computed Tomography Market in Spain Revenue (Million), by End User 2024 & 2032
- Figure 25: Europe Computed Tomography Market in Spain Revenue Share (%), by End User 2024 & 2032
- Figure 26: Europe Computed Tomography Market in Spain Revenue (Million), by Country 2024 & 2032
- Figure 27: Europe Computed Tomography Market in Spain Revenue Share (%), by Country 2024 & 2032
- Figure 28: Middle East & Africa Computed Tomography Market in Spain Revenue (Million), by Type 2024 & 2032
- Figure 29: Middle East & Africa Computed Tomography Market in Spain Revenue Share (%), by Type 2024 & 2032
- Figure 30: Middle East & Africa Computed Tomography Market in Spain Revenue (Million), by Application 2024 & 2032
- Figure 31: Middle East & Africa Computed Tomography Market in Spain Revenue Share (%), by Application 2024 & 2032
- Figure 32: Middle East & Africa Computed Tomography Market in Spain Revenue (Million), by End User 2024 & 2032
- Figure 33: Middle East & Africa Computed Tomography Market in Spain Revenue Share (%), by End User 2024 & 2032
- Figure 34: Middle East & Africa Computed Tomography Market in Spain Revenue (Million), by Country 2024 & 2032
- Figure 35: Middle East & Africa Computed Tomography Market in Spain Revenue Share (%), by Country 2024 & 2032
- Figure 36: Asia Pacific Computed Tomography Market in Spain Revenue (Million), by Type 2024 & 2032
- Figure 37: Asia Pacific Computed Tomography Market in Spain Revenue Share (%), by Type 2024 & 2032
- Figure 38: Asia Pacific Computed Tomography Market in Spain Revenue (Million), by Application 2024 & 2032
- Figure 39: Asia Pacific Computed Tomography Market in Spain Revenue Share (%), by Application 2024 & 2032
- Figure 40: Asia Pacific Computed Tomography Market in Spain Revenue (Million), by End User 2024 & 2032
- Figure 41: Asia Pacific Computed Tomography Market in Spain Revenue Share (%), by End User 2024 & 2032
- Figure 42: Asia Pacific Computed Tomography Market in Spain Revenue (Million), by Country 2024 & 2032
- Figure 43: Asia Pacific Computed Tomography Market in Spain Revenue Share (%), by Country 2024 & 2032
List of Tables
- Table 1: Global Computed Tomography Market in Spain Revenue Million Forecast, by Region 2019 & 2032
- Table 2: Global Computed Tomography Market in Spain Revenue Million Forecast, by Type 2019 & 2032
- Table 3: Global Computed Tomography Market in Spain Revenue Million Forecast, by Application 2019 & 2032
- Table 4: Global Computed Tomography Market in Spain Revenue Million Forecast, by End User 2019 & 2032
- Table 5: Global Computed Tomography Market in Spain Revenue Million Forecast, by Region 2019 & 2032
- Table 6: Global Computed Tomography Market in Spain Revenue Million Forecast, by Country 2019 & 2032
- Table 7: Global Computed Tomography Market in Spain Revenue Million Forecast, by Type 2019 & 2032
- Table 8: Global Computed Tomography Market in Spain Revenue Million Forecast, by Application 2019 & 2032
- Table 9: Global Computed Tomography Market in Spain Revenue Million Forecast, by End User 2019 & 2032
- Table 10: Global Computed Tomography Market in Spain Revenue Million Forecast, by Country 2019 & 2032
- Table 11: United States Computed Tomography Market in Spain Revenue (Million) Forecast, by Application 2019 & 2032
- Table 12: Canada Computed Tomography Market in Spain Revenue (Million) Forecast, by Application 2019 & 2032
- Table 13: Mexico Computed Tomography Market in Spain Revenue (Million) Forecast, by Application 2019 & 2032
- Table 14: Global Computed Tomography Market in Spain Revenue Million Forecast, by Type 2019 & 2032
- Table 15: Global Computed Tomography Market in Spain Revenue Million Forecast, by Application 2019 & 2032
- Table 16: Global Computed Tomography Market in Spain Revenue Million Forecast, by End User 2019 & 2032
- Table 17: Global Computed Tomography Market in Spain Revenue Million Forecast, by Country 2019 & 2032
- Table 18: Brazil Computed Tomography Market in Spain Revenue (Million) Forecast, by Application 2019 & 2032
- Table 19: Argentina Computed Tomography Market in Spain Revenue (Million) Forecast, by Application 2019 & 2032
- Table 20: Rest of South America Computed Tomography Market in Spain Revenue (Million) Forecast, by Application 2019 & 2032
- Table 21: Global Computed Tomography Market in Spain Revenue Million Forecast, by Type 2019 & 2032
- Table 22: Global Computed Tomography Market in Spain Revenue Million Forecast, by Application 2019 & 2032
- Table 23: Global Computed Tomography Market in Spain Revenue Million Forecast, by End User 2019 & 2032
- Table 24: Global Computed Tomography Market in Spain Revenue Million Forecast, by Country 2019 & 2032
- Table 25: United Kingdom Computed Tomography Market in Spain Revenue (Million) Forecast, by Application 2019 & 2032
- Table 26: Germany Computed Tomography Market in Spain Revenue (Million) Forecast, by Application 2019 & 2032
- Table 27: France Computed Tomography Market in Spain Revenue (Million) Forecast, by Application 2019 & 2032
- Table 28: Italy Computed Tomography Market in Spain Revenue (Million) Forecast, by Application 2019 & 2032
- Table 29: Spain Computed Tomography Market in Spain Revenue (Million) Forecast, by Application 2019 & 2032
- Table 30: Russia Computed Tomography Market in Spain Revenue (Million) Forecast, by Application 2019 & 2032
- Table 31: Benelux Computed Tomography Market in Spain Revenue (Million) Forecast, by Application 2019 & 2032
- Table 32: Nordics Computed Tomography Market in Spain Revenue (Million) Forecast, by Application 2019 & 2032
- Table 33: Rest of Europe Computed Tomography Market in Spain Revenue (Million) Forecast, by Application 2019 & 2032
- Table 34: Global Computed Tomography Market in Spain Revenue Million Forecast, by Type 2019 & 2032
- Table 35: Global Computed Tomography Market in Spain Revenue Million Forecast, by Application 2019 & 2032
- Table 36: Global Computed Tomography Market in Spain Revenue Million Forecast, by End User 2019 & 2032
- Table 37: Global Computed Tomography Market in Spain Revenue Million Forecast, by Country 2019 & 2032
- Table 38: Turkey Computed Tomography Market in Spain Revenue (Million) Forecast, by Application 2019 & 2032
- Table 39: Israel Computed Tomography Market in Spain Revenue (Million) Forecast, by Application 2019 & 2032
- Table 40: GCC Computed Tomography Market in Spain Revenue (Million) Forecast, by Application 2019 & 2032
- Table 41: North Africa Computed Tomography Market in Spain Revenue (Million) Forecast, by Application 2019 & 2032
- Table 42: South Africa Computed Tomography Market in Spain Revenue (Million) Forecast, by Application 2019 & 2032
- Table 43: Rest of Middle East & Africa Computed Tomography Market in Spain Revenue (Million) Forecast, by Application 2019 & 2032
- Table 44: Global Computed Tomography Market in Spain Revenue Million Forecast, by Type 2019 & 2032
- Table 45: Global Computed Tomography Market in Spain Revenue Million Forecast, by Application 2019 & 2032
- Table 46: Global Computed Tomography Market in Spain Revenue Million Forecast, by End User 2019 & 2032
- Table 47: Global Computed Tomography Market in Spain Revenue Million Forecast, by Country 2019 & 2032
- Table 48: China Computed Tomography Market in Spain Revenue (Million) Forecast, by Application 2019 & 2032
- Table 49: India Computed Tomography Market in Spain Revenue (Million) Forecast, by Application 2019 & 2032
- Table 50: Japan Computed Tomography Market in Spain Revenue (Million) Forecast, by Application 2019 & 2032
- Table 51: South Korea Computed Tomography Market in Spain Revenue (Million) Forecast, by Application 2019 & 2032
- Table 52: ASEAN Computed Tomography Market in Spain Revenue (Million) Forecast, by Application 2019 & 2032
- Table 53: Oceania Computed Tomography Market in Spain Revenue (Million) Forecast, by Application 2019 & 2032
- Table 54: Rest of Asia Pacific Computed Tomography Market in Spain Revenue (Million) Forecast, by Application 2019 & 2032
Frequently Asked Questions
1. What is the projected Compound Annual Growth Rate (CAGR) of the Computed Tomography Market in Spain?
The projected CAGR is approximately 5.50%.
2. Which companies are prominent players in the Computed Tomography Market in Spain?
Key companies in the market include CareStream Health, Siemens Healthineers, GE Healthcare, Samsung Electronics Co Ltd (Samsung Medison), Koninklijke Philips NV, Canon Medical Systems Corporation, Planmed Oy, Fujifilm Holdings Corporation.
3. What are the main segments of the Computed Tomography Market in Spain?
The market segments include Type, Application, End User.
4. Can you provide details about the market size?
The market size is estimated to be USD 201.59 Million as of 2022.
5. What are some drivers contributing to market growth?
Increasing Geriatric Population and Chronic Disease Burden; Technological Advancements in Computed Tomography.
6. What are the notable trends driving market growth?
Oncology is Expected to Dominate the Application Segment.
7. Are there any restraints impacting market growth?
High Cost Associated With CT Scan Procedure and Equipment.
8. Can you provide examples of recent developments in the market?
In November 2021, Siemens Healthineers launched the NAEOTOM Alpha, the world's first photon-counting CT scanner. The system is cleared for clinical use in the United States and Europe.
9. What pricing options are available for accessing the report?
Pricing options include single-user, multi-user, and enterprise licenses priced at USD 3800, USD 4500, and USD 5800 respectively.
10. Is the market size provided in terms of value or volume?
The market size is provided in terms of value, measured in Million.
11. Are there any specific market keywords associated with the report?
Yes, the market keyword associated with the report is "Computed Tomography Market in Spain," which aids in identifying and referencing the specific market segment covered.
12. How do I determine which pricing option suits my needs best?
The pricing options vary based on user requirements and access needs. Individual users may opt for single-user licenses, while businesses requiring broader access may choose multi-user or enterprise licenses for cost-effective access to the report.
13. Are there any additional resources or data provided in the Computed Tomography Market in Spain report?
While the report offers comprehensive insights, it's advisable to review the specific contents or supplementary materials provided to ascertain if additional resources or data are available.
14. How can I stay updated on further developments or reports in the Computed Tomography Market in Spain?
To stay informed about further developments, trends, and reports in the Computed Tomography Market in Spain, consider subscribing to industry newsletters, following relevant companies and organizations, or regularly checking reputable industry news sources and publications.
Methodology
Step 1 - Identification of Relevant Samples Size from Population Database


Step 2 - Approaches for Defining Global Market Size (Value, Volume* & Price*)

Note*: In applicable scenarios
Step 3 - Data Sources
Primary Research
- Web Analytics
- Survey Reports
- Research Institute
- Latest Research Reports
- Opinion Leaders
Secondary Research
- Annual Reports
- White Paper
- Latest Press Release
- Industry Association
- Paid Database
- Investor Presentations

Step 4 - Data Triangulation
Involves using different sources of information in order to increase the validity of a study
These sources are likely to be stakeholders in a program - participants, other researchers, program staff, other community members, and so on.
Then we put all data in single framework & apply various statistical tools to find out the dynamic on the market.
During the analysis stage, feedback from the stakeholder groups would be compared to determine areas of agreement as well as areas of divergence


