

Key Insights
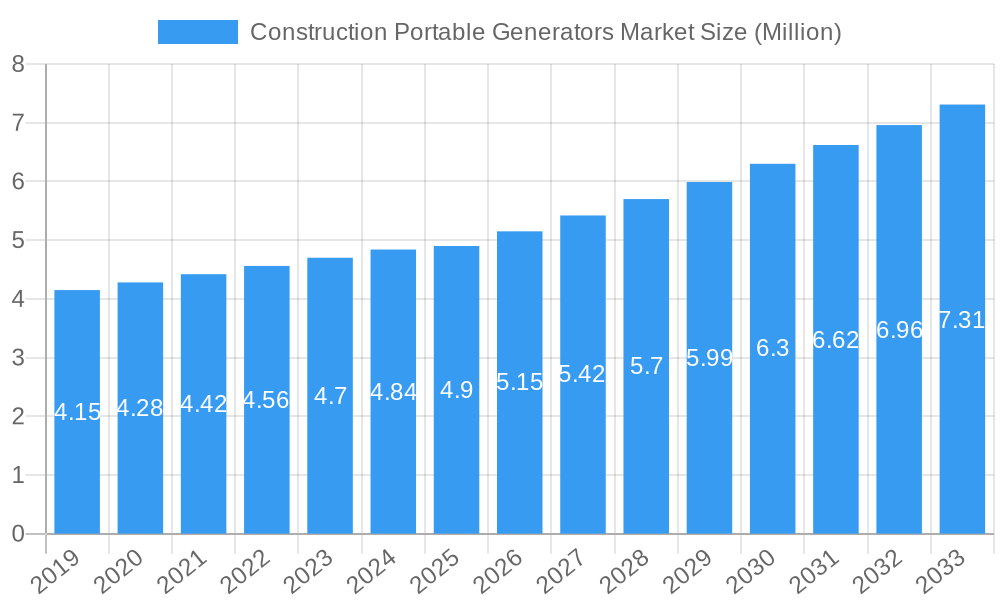
The global Construction Portable Generators Market is experiencing robust growth, projected to reach an estimated USD 4.90 million in 2025. Driven by a compelling Compound Annual Growth Rate (CAGR) of 5.50% throughout the forecast period extending to 2033, this expansion underscores the increasing demand for reliable power solutions on construction sites. The market is characterized by a diverse range of power ratings, with segments like "Below 5 KW" and "5-10 KW" likely to see sustained demand due to their versatility and application in smaller-scale construction and renovation projects. Furthermore, the "Above 10 KW" segment is poised for significant growth, catering to the power-intensive needs of large-scale infrastructure development and commercial building projects. Fuel types, particularly gasoline and diesel, continue to dominate the market, offering a balance of portability, power output, and readily available fuel infrastructure. However, increasing environmental consciousness and the drive for sustainable energy solutions are expected to foster gradual adoption of other fuel types and hybrid technologies in the long term.
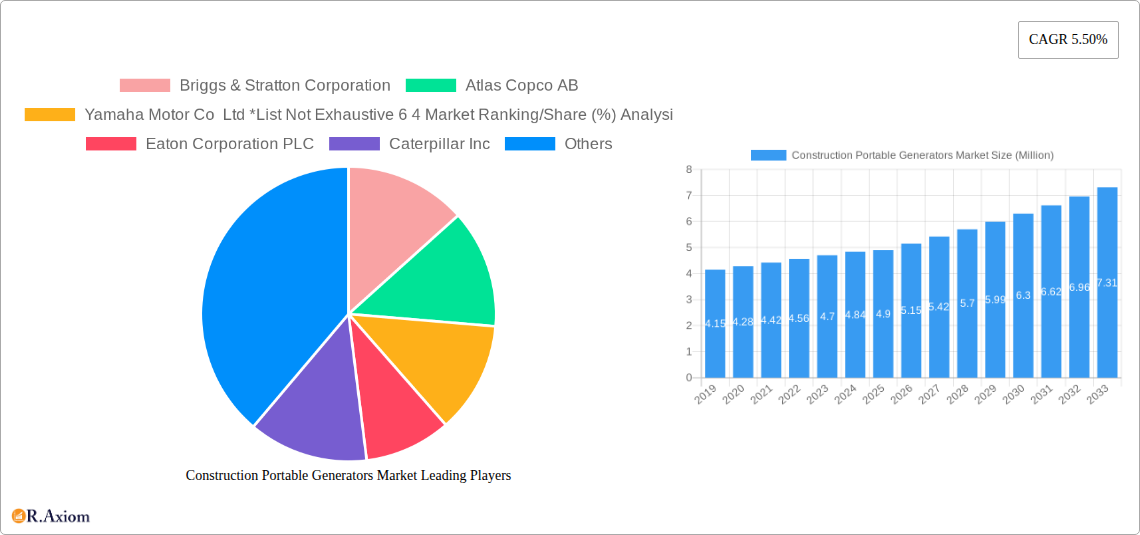
Construction Portable Generators Market Market Size (In Million)
The market's trajectory is significantly influenced by several key drivers, including the escalating pace of global urbanization and infrastructure development, which necessitates consistent and mobile power sources for construction activities. The growth of the construction sector in emerging economies, coupled with increasing investments in residential, commercial, and industrial projects, further fuels demand. Technological advancements leading to more fuel-efficient, quieter, and portable generator designs are also playing a crucial role. Key players such as Briggs & Stratton Corporation, Caterpillar Inc., and Honda Siel Power Products Ltd. are actively innovating and expanding their product portfolios to capture market share. While the market exhibits strong growth potential, restraints such as stringent environmental regulations regarding emissions and noise pollution, along with the fluctuating prices of raw materials, could pose challenges. Nevertheless, the continuous need for reliable power at remote and temporary construction sites ensures a positive outlook for the Construction Portable Generators Market.
Construction Portable Generators Market Company Market Share
This in-depth report provides a panoramic view of the global Construction Portable Generators Market, offering critical insights into market dynamics, growth trajectories, and competitive landscapes. We delve into the intricacies of this vital sector, from innovative product developments to emerging market opportunities, equipping industry stakeholders with actionable intelligence for strategic decision-making. The study encompasses a comprehensive Study Period: 2019–2033, with a Base Year: 2025 and an Estimated Year: 2025, and a detailed Forecast Period: 2025–2033, drawing upon data from the Historical Period: 2019–2024.
Construction Portable Generators Market Market Concentration & Innovation
The Construction Portable Generators Market exhibits a moderate level of market concentration, with a mix of large, established players and smaller, regional manufacturers. Innovation is a key differentiator, driven by the demand for more fuel-efficient, quieter, and technologically advanced generators. Factors such as stricter emission regulations and the need for enhanced job site safety are pushing manufacturers to invest in research and development for inverter generators, hybrid power solutions, and smart connectivity features. The regulatory framework, particularly concerning emissions and noise pollution, plays a significant role in shaping product design and market entry. Product substitutes, such as grid power extensions where feasible and larger, stationary generators, exist but are often less practical for the dynamic nature of construction sites. End-user trends are increasingly focused on portability, ease of use, and sustainable power solutions. Mergers and acquisitions (M&A) activities are observed as larger companies seek to expand their product portfolios and market reach. For instance, strategic acquisitions in recent years have aimed to integrate innovative technologies or capture market share in specific segments, with deal values ranging from tens of millions to hundreds of millions of dollars. The Market Ranking/Share (%) Analysis indicates a dynamic interplay of leading entities, with key players holding significant portions of the market.
Construction Portable Generators Market Industry Trends & Insights
The Construction Portable Generators Market is poised for robust growth, propelled by a confluence of factors including accelerating urbanization, escalating infrastructure development projects globally, and the increasing need for reliable, off-grid power solutions at construction sites. The global market for construction portable generators is projected to witness a Compound Annual Growth Rate (CAGR) of approximately 5.5% during the forecast period. This growth is fundamentally driven by the inherent demand for uninterrupted power supply on construction sites, especially in remote areas or during grid outages, which are critical for operating heavy machinery, lighting, and temporary facilities. Technological advancements are significantly reshaping the industry. The advent of inverter generator technology has led to a substantial improvement in fuel efficiency, reduced noise levels, and cleaner power output, making them highly attractive for noise-sensitive urban environments and for powering delicate electronic equipment. Furthermore, the integration of smart technologies, such as remote monitoring and control capabilities via mobile applications, is enhancing user convenience and operational efficiency. Consumer preferences are leaning towards generators that offer a balance of power, portability, and eco-friendliness. The rising awareness about environmental sustainability is creating a demand for more fuel-efficient models and those that can operate on alternative fuels. The competitive landscape is characterized by intense rivalry, with manufacturers continuously striving to innovate and differentiate their offerings. Companies are focusing on developing lighter, more durable, and user-friendly generator models. Market penetration is deepening in developing economies as infrastructure spending increases, creating new avenues for market expansion. The trend towards electric and hybrid construction equipment also indirectly influences the demand for portable generators capable of supporting these new technologies.
Dominant Markets & Segments in Construction Portable Generators Market
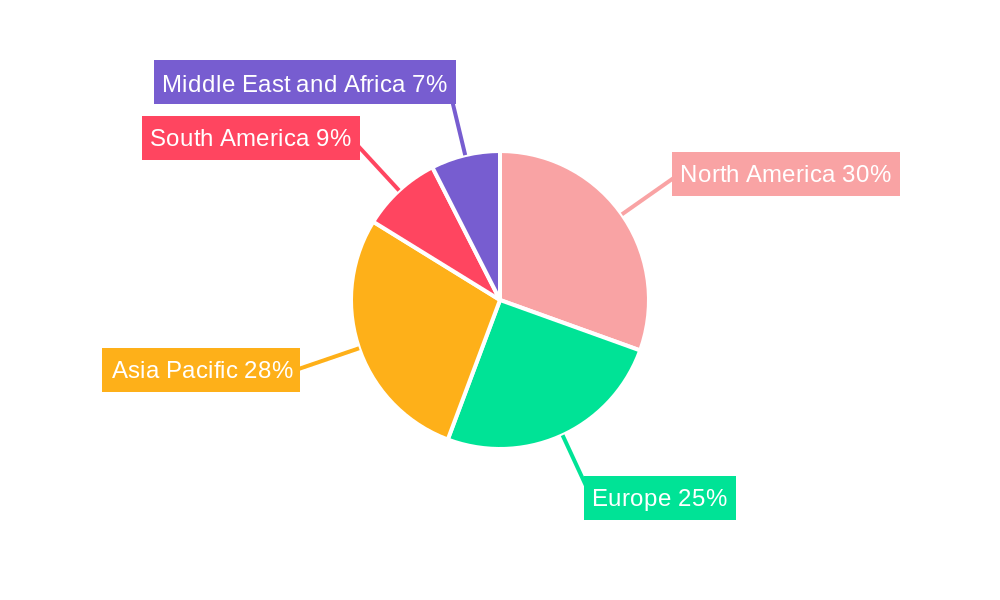
The Construction Portable Generators Market is characterized by several dominant regions and segments, each driven by unique economic and infrastructural factors.
Dominant Region: North America currently holds a significant market share, largely due to its mature construction industry, substantial investment in infrastructure upgrades, and a strong emphasis on adopting advanced technologies in construction sites. The United States, in particular, is a major consumer, owing to a high volume of new construction projects and the demand for reliable backup power for both residential and commercial developments.
Leading Country: Beyond North America, Asia Pacific is emerging as a rapidly growing market. Countries like China and India are experiencing unprecedented urbanization and infrastructure development, leading to a surge in demand for construction portable generators. Government initiatives promoting construction and housing projects further fuel this growth.
Power Rating Dominance:
- 5-10 KW Segment: This power rating segment is the most dominant within the construction industry. These generators offer a versatile power output suitable for a wide range of construction applications, from powering hand tools and lighting to operating small to medium-sized equipment. Their balance of portability and power capacity makes them the go-to choice for many construction sites. Key drivers include the need for powering multiple tools simultaneously and the flexibility to move between different work zones.
- Below 5 KW: This segment caters to lighter-duty applications and smaller construction sites or specific tool power needs. Their compact size and lower fuel consumption make them attractive for tasks requiring only basic power.
- Above 10 KW: This segment is crucial for larger construction projects requiring substantial power for heavy machinery, extensive lighting systems, or powering entire temporary site offices. While less portable than smaller units, their high power output is indispensable for large-scale operations.
Fuel Type Dominance:
- Diesel Fuel Type: Diesel-powered construction portable generators command a significant market share due to their inherent durability, fuel efficiency, and robust performance, especially for heavy-duty applications. Their ability to operate for extended periods and withstand demanding conditions makes them a preferred choice for long-term construction projects. The availability and established infrastructure for diesel fuel also contribute to its dominance.
- Gas (Gasoline) Fuel Type: Gasoline generators are popular for their lower initial cost and widespread availability of fuel. They are often favored for smaller projects or as backup power solutions where continuous, heavy-duty operation is not the primary concern.
- Other Fuel Types (e.g., Propane, Natural Gas, Hybrid): While currently a smaller segment, the demand for generators running on other fuel types, particularly propane due to its cleaner burning properties and ease of storage, is gradually increasing. Hybrid models, combining different fuel sources or integrating battery storage, are also gaining traction as sustainability becomes a more prominent factor.
Construction Portable Generators Market Product Developments
Product innovations in the Construction Portable Generators Market are centered on enhancing efficiency, portability, and user experience. Manufacturers are increasingly focusing on developing inverter generators that deliver cleaner, more stable power, ideal for sensitive electronic equipment commonly used on modern construction sites. Developments include lighter-weight designs, improved fuel injection systems for better economy, and noise reduction technologies to meet stringent environmental regulations. The integration of smart features, such as remote monitoring, diagnostics, and connectivity for fleet management, is another key trend, offering construction companies greater control and operational insights. These advancements provide a competitive edge by addressing the evolving needs for reliable, adaptable, and sustainable power solutions in the construction sector.
Report Scope & Segmentation Analysis
This report meticulously segments the Construction Portable Generators Market based on critical parameters to provide a granular understanding of market dynamics. The analysis includes:
Power Rating:
- Below 5 KW: This segment, characterized by compact and lightweight units, is projected to witness steady growth, driven by demand for powering smaller tools and applications.
- 5-10 KW: This is anticipated to remain the largest segment, offering a balance of power and portability essential for a wide array of construction tasks.
- Above 10 KW: This segment is expected to experience robust growth, fueled by the increasing scale of construction projects and the need for higher power output.
Fuel Type:
- Gas: While facing competition, gasoline generators are expected to maintain a significant presence due to their cost-effectiveness and fuel availability.
- Diesel: This segment is projected to continue its strong performance, driven by its durability and fuel efficiency for heavy-duty applications.
- Other Fuel Types (e.g., Propane, Hybrid): This segment, though currently smaller, is poised for the highest growth rate, fueled by increasing environmental consciousness and the demand for alternative energy solutions.
Key Drivers of Construction Portable Generators Market Growth
The growth of the Construction Portable Generators Market is underpinned by several key drivers. Foremost is the global surge in infrastructure development and construction activities, necessitating reliable, on-site power. Technological advancements, particularly in inverter generator technology, are enhancing efficiency, reducing noise pollution, and improving power quality, making generators more suitable for diverse applications and environments. The increasing adoption of smart technologies for remote monitoring and management further enhances their appeal. Furthermore, the growing emphasis on sustainability and environmental regulations is pushing manufacturers to develop more fuel-efficient and lower-emission generators. The demand for portable and versatile power solutions in remote or off-grid locations also significantly contributes to market expansion.
Challenges in the Construction Portable Generators Market Sector
Despite the positive growth trajectory, the Construction Portable Generators Market faces several challenges. Stricter environmental regulations regarding emissions and noise levels can increase manufacturing costs and necessitate significant R&D investments for compliance. Fluctuations in raw material prices, particularly for metals and components, can impact profit margins. Supply chain disruptions, as witnessed in recent global events, can lead to production delays and increased lead times. Intense competition among a large number of manufacturers can lead to price wars and squeeze profit margins. Moreover, the increasing adoption of renewable energy solutions and advances in grid infrastructure in some regions could potentially limit the demand for portable generators in specific applications.
Emerging Opportunities in Construction Portable Generators Market
The Construction Portable Generators Market presents several compelling emerging opportunities. The growing adoption of hybrid generator systems, which combine traditional fuel engines with battery storage or solar power, offers enhanced fuel efficiency and reduced emissions. The increasing demand for smart generators with advanced connectivity features for remote monitoring, diagnostics, and fleet management opens up new revenue streams. Expansion into developing economies with rapidly growing construction sectors represents a significant untapped market. Furthermore, the development of more compact, lightweight, and quieter generators catering to specific niche applications, such as powering drones or advanced construction robotics, presents further innovation avenues.
Leading Players in the Construction Portable Generators Market Market
- Briggs & Stratton Corporation
- Atlas Copco AB
- Yamaha Motor Co Ltd
- Eaton Corporation PLC
- Caterpillar Inc
- Honda Siel Power Products Ltd
- Kohler Power Systems
- Wacker Neuson SE
- Generac Holdings Inc
Key Developments in Construction Portable Generators Market Industry
- 2023: Introduction of new inverter generator models with enhanced fuel efficiency and reduced noise levels by several leading manufacturers, responding to increasing environmental concerns.
- 2022: Several companies announced strategic partnerships to integrate IoT capabilities into their portable generator lines, enabling remote monitoring and predictive maintenance.
- 2021: Focus on expanding product offerings for the rental market, with an emphasis on durability and ease of transportation for construction sites.
- 2020: Increased investment in research and development for hybrid power solutions and generators compatible with alternative fuels like propane.
- 2019: Launch of ultra-quiet generator models designed for use in noise-sensitive urban construction environments.
Strategic Outlook for Construction Portable Generators Market Market
The Construction Portable Generators Market is set for continued expansion, driven by ongoing global infrastructure development and the increasing need for reliable on-site power. Strategic focus will be on embracing technological innovations such as smart connectivity, hybrid power solutions, and enhanced fuel efficiency to meet evolving regulatory demands and customer preferences. Companies that invest in sustainable power generation and prioritize user-centric designs, including portability and reduced noise output, will be well-positioned to capture market share. Exploring opportunities in emerging economies and developing advanced product offerings for niche applications will be crucial for sustained growth and market leadership in the coming years.
Construction Portable Generators Market Segmentation
-
1. Power Rating
- 1.1. Below 5 KW
- 1.2. 5-10 KW
- 1.3. Above 10 KW
-
2. Fuel Type
- 2.1. Gas
- 2.2. Diesel
- 2.3. Other Fuel Types
Construction Portable Generators Market Segmentation By Geography
-
1. North America
- 1.1. United States
- 1.2. Canada
- 1.3. Rest of North America
-
2. Europe
- 2.1. Germany
- 2.2. France
- 2.3. United Kingdom
- 2.4. Spain
- 2.5. NORDIC
- 2.6. Turkey
- 2.7. Russia
- 2.8. Rest of Europe
-
3. Asia Pacific
- 3.1. China
- 3.2. India
- 3.3. Japan
- 3.4. South Korea
- 3.5. Malaysia
- 3.6. Thailand
- 3.7. Indonesia
- 3.8. Vietnam
- 3.9. Rest of Asia Pacific
-
4. South America
- 4.1. Brazil
- 4.2. Argentina
- 4.3. Colombia
- 4.4. Rest of South America
-
5. Middle East and Africa
- 5.1. Saudi Arabia
- 5.2. United Arab Emirates
- 5.3. South Africa
- 5.4. Egypt
- 5.5. Nigeria
- 5.6. Qatar
- 5.7. Rest of Middle East and Africa
Construction Portable Generators Market Regional Market Share
Geographic Coverage of Construction Portable Generators Market
Construction Portable Generators Market REPORT HIGHLIGHTS
| Aspects | Details |
|---|---|
| Study Period | 2020-2034 |
| Base Year | 2025 |
| Estimated Year | 2026 |
| Forecast Period | 2026-2034 |
| Historical Period | 2020-2025 |
| Growth Rate | CAGR of 5.50% from 2020-2034 |
| Segmentation |
|
Table of Contents
- 1. Introduction
- 1.1. Research Scope
- 1.2. Market Segmentation
- 1.3. Research Objective
- 1.4. Definitions and Assumptions
- 2. Executive Summary
- 2.1. Market Snapshot
- 3. Market Dynamics
- 3.1. Market Drivers
- 3.2. Market Restrains
- 3.3. Market Trends
- 3.4. Market Opportunities
- 4. Market Factor Analysis
- 4.1. Porters Five Forces
- 4.1.1. Bargaining Power of Suppliers
- 4.1.2. Bargaining Power of Buyers
- 4.1.3. Threat of New Entrants
- 4.1.4. Threat of Substitutes
- 4.1.5. Competitive Rivalry
- 4.2. PESTEL analysis
- 4.3. BCG Analysis
- 4.3.1. Stars (High Growth, High Market Share)
- 4.3.2. Cash Cows (Low Growth, High Market Share)
- 4.3.3. Question Mark (High Growth, Low Market Share)
- 4.3.4. Dogs (Low Growth, Low Market Share)
- 4.4. Ansoff Matrix Analysis
- 4.5. Supply Chain Analysis
- 4.6. Regulatory Landscape
- 4.7. Current Market Potential and Opportunity Assessment (TAM–SAM–SOM Framework)
- 4.8. RAX Analyst Note
- 4.1. Porters Five Forces
- 5. Market Analysis, Insights and Forecast 2021-2033
- 5.1. Market Analysis, Insights and Forecast - by Power Rating
- 5.1.1. Below 5 KW
- 5.1.2. 5-10 KW
- 5.1.3. Above 10 KW
- 5.2. Market Analysis, Insights and Forecast - by Fuel Type
- 5.2.1. Gas
- 5.2.2. Diesel
- 5.2.3. Other Fuel Types
- 5.3. Market Analysis, Insights and Forecast - by Region
- 5.3.1. North America
- 5.3.2. Europe
- 5.3.3. Asia Pacific
- 5.3.4. South America
- 5.3.5. Middle East and Africa
- 5.1. Market Analysis, Insights and Forecast - by Power Rating
- 6. Global Construction Portable Generators Market Analysis, Insights and Forecast, 2021-2033
- 6.1. Market Analysis, Insights and Forecast - by Power Rating
- 6.1.1. Below 5 KW
- 6.1.2. 5-10 KW
- 6.1.3. Above 10 KW
- 6.2. Market Analysis, Insights and Forecast - by Fuel Type
- 6.2.1. Gas
- 6.2.2. Diesel
- 6.2.3. Other Fuel Types
- 6.1. Market Analysis, Insights and Forecast - by Power Rating
- 7. North America Construction Portable Generators Market Analysis, Insights and Forecast, 2020-2032
- 7.1. Market Analysis, Insights and Forecast - by Power Rating
- 7.1.1. Below 5 KW
- 7.1.2. 5-10 KW
- 7.1.3. Above 10 KW
- 7.2. Market Analysis, Insights and Forecast - by Fuel Type
- 7.2.1. Gas
- 7.2.2. Diesel
- 7.2.3. Other Fuel Types
- 7.1. Market Analysis, Insights and Forecast - by Power Rating
- 8. Europe Construction Portable Generators Market Analysis, Insights and Forecast, 2020-2032
- 8.1. Market Analysis, Insights and Forecast - by Power Rating
- 8.1.1. Below 5 KW
- 8.1.2. 5-10 KW
- 8.1.3. Above 10 KW
- 8.2. Market Analysis, Insights and Forecast - by Fuel Type
- 8.2.1. Gas
- 8.2.2. Diesel
- 8.2.3. Other Fuel Types
- 8.1. Market Analysis, Insights and Forecast - by Power Rating
- 9. Asia Pacific Construction Portable Generators Market Analysis, Insights and Forecast, 2020-2032
- 9.1. Market Analysis, Insights and Forecast - by Power Rating
- 9.1.1. Below 5 KW
- 9.1.2. 5-10 KW
- 9.1.3. Above 10 KW
- 9.2. Market Analysis, Insights and Forecast - by Fuel Type
- 9.2.1. Gas
- 9.2.2. Diesel
- 9.2.3. Other Fuel Types
- 9.1. Market Analysis, Insights and Forecast - by Power Rating
- 10. South America Construction Portable Generators Market Analysis, Insights and Forecast, 2020-2032
- 10.1. Market Analysis, Insights and Forecast - by Power Rating
- 10.1.1. Below 5 KW
- 10.1.2. 5-10 KW
- 10.1.3. Above 10 KW
- 10.2. Market Analysis, Insights and Forecast - by Fuel Type
- 10.2.1. Gas
- 10.2.2. Diesel
- 10.2.3. Other Fuel Types
- 10.1. Market Analysis, Insights and Forecast - by Power Rating
- 11. Middle East and Africa Construction Portable Generators Market Analysis, Insights and Forecast, 2020-2032
- 11.1. Market Analysis, Insights and Forecast - by Power Rating
- 11.1.1. Below 5 KW
- 11.1.2. 5-10 KW
- 11.1.3. Above 10 KW
- 11.2. Market Analysis, Insights and Forecast - by Fuel Type
- 11.2.1. Gas
- 11.2.2. Diesel
- 11.2.3. Other Fuel Types
- 11.1. Market Analysis, Insights and Forecast - by Power Rating
- 12. Competitive Analysis
- 12.1. Company Profiles
- 12.1.1 Briggs & Stratton Corporation
- 12.1.1.1. Company Overview
- 12.1.1.2. Products
- 12.1.1.3. Company Financials
- 12.1.1.4. SWOT Analysis
- 12.1.2 Atlas Copco AB
- 12.1.2.1. Company Overview
- 12.1.2.2. Products
- 12.1.2.3. Company Financials
- 12.1.2.4. SWOT Analysis
- 12.1.3 Yamaha Motor Co Ltd *List Not Exhaustive 6 4 Market Ranking/Share (%) Analysi
- 12.1.3.1. Company Overview
- 12.1.3.2. Products
- 12.1.3.3. Company Financials
- 12.1.3.4. SWOT Analysis
- 12.1.4 Eaton Corporation PLC
- 12.1.4.1. Company Overview
- 12.1.4.2. Products
- 12.1.4.3. Company Financials
- 12.1.4.4. SWOT Analysis
- 12.1.5 Caterpillar Inc
- 12.1.5.1. Company Overview
- 12.1.5.2. Products
- 12.1.5.3. Company Financials
- 12.1.5.4. SWOT Analysis
- 12.1.6 Honda Siel Power Products Ltd
- 12.1.6.1. Company Overview
- 12.1.6.2. Products
- 12.1.6.3. Company Financials
- 12.1.6.4. SWOT Analysis
- 12.1.7 Kohler Power Systems
- 12.1.7.1. Company Overview
- 12.1.7.2. Products
- 12.1.7.3. Company Financials
- 12.1.7.4. SWOT Analysis
- 12.1.8 Wacker Neuson SE
- 12.1.8.1. Company Overview
- 12.1.8.2. Products
- 12.1.8.3. Company Financials
- 12.1.8.4. SWOT Analysis
- 12.1.9 Generac Holdings Inc
- 12.1.9.1. Company Overview
- 12.1.9.2. Products
- 12.1.9.3. Company Financials
- 12.1.9.4. SWOT Analysis
- 12.1.1 Briggs & Stratton Corporation
- 12.2. Market Entropy
- 12.2.1 Company's Key Areas Served
- 12.2.2 Recent Developments
- 12.3. Company Market Share Analysis 2025
- 12.3.1 Top 5 Companies Market Share Analysis
- 12.3.2 Top 3 Companies Market Share Analysis
- 12.4. List of Potential Customers
- 13. Research Methodology
List of Figures
- Figure 1: Global Construction Portable Generators Market Revenue Breakdown (Million, %) by Region 2025 & 2033
- Figure 2: Global Construction Portable Generators Market Volume Breakdown (K Unit, %) by Region 2025 & 2033
- Figure 3: North America Construction Portable Generators Market Revenue (Million), by Power Rating 2025 & 2033
- Figure 4: North America Construction Portable Generators Market Volume (K Unit), by Power Rating 2025 & 2033
- Figure 5: North America Construction Portable Generators Market Revenue Share (%), by Power Rating 2025 & 2033
- Figure 6: North America Construction Portable Generators Market Volume Share (%), by Power Rating 2025 & 2033
- Figure 7: North America Construction Portable Generators Market Revenue (Million), by Fuel Type 2025 & 2033
- Figure 8: North America Construction Portable Generators Market Volume (K Unit), by Fuel Type 2025 & 2033
- Figure 9: North America Construction Portable Generators Market Revenue Share (%), by Fuel Type 2025 & 2033
- Figure 10: North America Construction Portable Generators Market Volume Share (%), by Fuel Type 2025 & 2033
- Figure 11: North America Construction Portable Generators Market Revenue (Million), by Country 2025 & 2033
- Figure 12: North America Construction Portable Generators Market Volume (K Unit), by Country 2025 & 2033
- Figure 13: North America Construction Portable Generators Market Revenue Share (%), by Country 2025 & 2033
- Figure 14: North America Construction Portable Generators Market Volume Share (%), by Country 2025 & 2033
- Figure 15: Europe Construction Portable Generators Market Revenue (Million), by Power Rating 2025 & 2033
- Figure 16: Europe Construction Portable Generators Market Volume (K Unit), by Power Rating 2025 & 2033
- Figure 17: Europe Construction Portable Generators Market Revenue Share (%), by Power Rating 2025 & 2033
- Figure 18: Europe Construction Portable Generators Market Volume Share (%), by Power Rating 2025 & 2033
- Figure 19: Europe Construction Portable Generators Market Revenue (Million), by Fuel Type 2025 & 2033
- Figure 20: Europe Construction Portable Generators Market Volume (K Unit), by Fuel Type 2025 & 2033
- Figure 21: Europe Construction Portable Generators Market Revenue Share (%), by Fuel Type 2025 & 2033
- Figure 22: Europe Construction Portable Generators Market Volume Share (%), by Fuel Type 2025 & 2033
- Figure 23: Europe Construction Portable Generators Market Revenue (Million), by Country 2025 & 2033
- Figure 24: Europe Construction Portable Generators Market Volume (K Unit), by Country 2025 & 2033
- Figure 25: Europe Construction Portable Generators Market Revenue Share (%), by Country 2025 & 2033
- Figure 26: Europe Construction Portable Generators Market Volume Share (%), by Country 2025 & 2033
- Figure 27: Asia Pacific Construction Portable Generators Market Revenue (Million), by Power Rating 2025 & 2033
- Figure 28: Asia Pacific Construction Portable Generators Market Volume (K Unit), by Power Rating 2025 & 2033
- Figure 29: Asia Pacific Construction Portable Generators Market Revenue Share (%), by Power Rating 2025 & 2033
- Figure 30: Asia Pacific Construction Portable Generators Market Volume Share (%), by Power Rating 2025 & 2033
- Figure 31: Asia Pacific Construction Portable Generators Market Revenue (Million), by Fuel Type 2025 & 2033
- Figure 32: Asia Pacific Construction Portable Generators Market Volume (K Unit), by Fuel Type 2025 & 2033
- Figure 33: Asia Pacific Construction Portable Generators Market Revenue Share (%), by Fuel Type 2025 & 2033
- Figure 34: Asia Pacific Construction Portable Generators Market Volume Share (%), by Fuel Type 2025 & 2033
- Figure 35: Asia Pacific Construction Portable Generators Market Revenue (Million), by Country 2025 & 2033
- Figure 36: Asia Pacific Construction Portable Generators Market Volume (K Unit), by Country 2025 & 2033
- Figure 37: Asia Pacific Construction Portable Generators Market Revenue Share (%), by Country 2025 & 2033
- Figure 38: Asia Pacific Construction Portable Generators Market Volume Share (%), by Country 2025 & 2033
- Figure 39: South America Construction Portable Generators Market Revenue (Million), by Power Rating 2025 & 2033
- Figure 40: South America Construction Portable Generators Market Volume (K Unit), by Power Rating 2025 & 2033
- Figure 41: South America Construction Portable Generators Market Revenue Share (%), by Power Rating 2025 & 2033
- Figure 42: South America Construction Portable Generators Market Volume Share (%), by Power Rating 2025 & 2033
- Figure 43: South America Construction Portable Generators Market Revenue (Million), by Fuel Type 2025 & 2033
- Figure 44: South America Construction Portable Generators Market Volume (K Unit), by Fuel Type 2025 & 2033
- Figure 45: South America Construction Portable Generators Market Revenue Share (%), by Fuel Type 2025 & 2033
- Figure 46: South America Construction Portable Generators Market Volume Share (%), by Fuel Type 2025 & 2033
- Figure 47: South America Construction Portable Generators Market Revenue (Million), by Country 2025 & 2033
- Figure 48: South America Construction Portable Generators Market Volume (K Unit), by Country 2025 & 2033
- Figure 49: South America Construction Portable Generators Market Revenue Share (%), by Country 2025 & 2033
- Figure 50: South America Construction Portable Generators Market Volume Share (%), by Country 2025 & 2033
- Figure 51: Middle East and Africa Construction Portable Generators Market Revenue (Million), by Power Rating 2025 & 2033
- Figure 52: Middle East and Africa Construction Portable Generators Market Volume (K Unit), by Power Rating 2025 & 2033
- Figure 53: Middle East and Africa Construction Portable Generators Market Revenue Share (%), by Power Rating 2025 & 2033
- Figure 54: Middle East and Africa Construction Portable Generators Market Volume Share (%), by Power Rating 2025 & 2033
- Figure 55: Middle East and Africa Construction Portable Generators Market Revenue (Million), by Fuel Type 2025 & 2033
- Figure 56: Middle East and Africa Construction Portable Generators Market Volume (K Unit), by Fuel Type 2025 & 2033
- Figure 57: Middle East and Africa Construction Portable Generators Market Revenue Share (%), by Fuel Type 2025 & 2033
- Figure 58: Middle East and Africa Construction Portable Generators Market Volume Share (%), by Fuel Type 2025 & 2033
- Figure 59: Middle East and Africa Construction Portable Generators Market Revenue (Million), by Country 2025 & 2033
- Figure 60: Middle East and Africa Construction Portable Generators Market Volume (K Unit), by Country 2025 & 2033
- Figure 61: Middle East and Africa Construction Portable Generators Market Revenue Share (%), by Country 2025 & 2033
- Figure 62: Middle East and Africa Construction Portable Generators Market Volume Share (%), by Country 2025 & 2033
List of Tables
- Table 1: Global Construction Portable Generators Market Revenue Million Forecast, by Power Rating 2020 & 2033
- Table 2: Global Construction Portable Generators Market Volume K Unit Forecast, by Power Rating 2020 & 2033
- Table 3: Global Construction Portable Generators Market Revenue Million Forecast, by Fuel Type 2020 & 2033
- Table 4: Global Construction Portable Generators Market Volume K Unit Forecast, by Fuel Type 2020 & 2033
- Table 5: Global Construction Portable Generators Market Revenue Million Forecast, by Region 2020 & 2033
- Table 6: Global Construction Portable Generators Market Volume K Unit Forecast, by Region 2020 & 2033
- Table 7: Global Construction Portable Generators Market Revenue Million Forecast, by Power Rating 2020 & 2033
- Table 8: Global Construction Portable Generators Market Volume K Unit Forecast, by Power Rating 2020 & 2033
- Table 9: Global Construction Portable Generators Market Revenue Million Forecast, by Fuel Type 2020 & 2033
- Table 10: Global Construction Portable Generators Market Volume K Unit Forecast, by Fuel Type 2020 & 2033
- Table 11: Global Construction Portable Generators Market Revenue Million Forecast, by Country 2020 & 2033
- Table 12: Global Construction Portable Generators Market Volume K Unit Forecast, by Country 2020 & 2033
- Table 13: United States Construction Portable Generators Market Revenue (Million) Forecast, by Application 2020 & 2033
- Table 14: United States Construction Portable Generators Market Volume (K Unit) Forecast, by Application 2020 & 2033
- Table 15: Canada Construction Portable Generators Market Revenue (Million) Forecast, by Application 2020 & 2033
- Table 16: Canada Construction Portable Generators Market Volume (K Unit) Forecast, by Application 2020 & 2033
- Table 17: Rest of North America Construction Portable Generators Market Revenue (Million) Forecast, by Application 2020 & 2033
- Table 18: Rest of North America Construction Portable Generators Market Volume (K Unit) Forecast, by Application 2020 & 2033
- Table 19: Global Construction Portable Generators Market Revenue Million Forecast, by Power Rating 2020 & 2033
- Table 20: Global Construction Portable Generators Market Volume K Unit Forecast, by Power Rating 2020 & 2033
- Table 21: Global Construction Portable Generators Market Revenue Million Forecast, by Fuel Type 2020 & 2033
- Table 22: Global Construction Portable Generators Market Volume K Unit Forecast, by Fuel Type 2020 & 2033
- Table 23: Global Construction Portable Generators Market Revenue Million Forecast, by Country 2020 & 2033
- Table 24: Global Construction Portable Generators Market Volume K Unit Forecast, by Country 2020 & 2033
- Table 25: Germany Construction Portable Generators Market Revenue (Million) Forecast, by Application 2020 & 2033
- Table 26: Germany Construction Portable Generators Market Volume (K Unit) Forecast, by Application 2020 & 2033
- Table 27: France Construction Portable Generators Market Revenue (Million) Forecast, by Application 2020 & 2033
- Table 28: France Construction Portable Generators Market Volume (K Unit) Forecast, by Application 2020 & 2033
- Table 29: United Kingdom Construction Portable Generators Market Revenue (Million) Forecast, by Application 2020 & 2033
- Table 30: United Kingdom Construction Portable Generators Market Volume (K Unit) Forecast, by Application 2020 & 2033
- Table 31: Spain Construction Portable Generators Market Revenue (Million) Forecast, by Application 2020 & 2033
- Table 32: Spain Construction Portable Generators Market Volume (K Unit) Forecast, by Application 2020 & 2033
- Table 33: NORDIC Construction Portable Generators Market Revenue (Million) Forecast, by Application 2020 & 2033
- Table 34: NORDIC Construction Portable Generators Market Volume (K Unit) Forecast, by Application 2020 & 2033
- Table 35: Turkey Construction Portable Generators Market Revenue (Million) Forecast, by Application 2020 & 2033
- Table 36: Turkey Construction Portable Generators Market Volume (K Unit) Forecast, by Application 2020 & 2033
- Table 37: Russia Construction Portable Generators Market Revenue (Million) Forecast, by Application 2020 & 2033
- Table 38: Russia Construction Portable Generators Market Volume (K Unit) Forecast, by Application 2020 & 2033
- Table 39: Rest of Europe Construction Portable Generators Market Revenue (Million) Forecast, by Application 2020 & 2033
- Table 40: Rest of Europe Construction Portable Generators Market Volume (K Unit) Forecast, by Application 2020 & 2033
- Table 41: Global Construction Portable Generators Market Revenue Million Forecast, by Power Rating 2020 & 2033
- Table 42: Global Construction Portable Generators Market Volume K Unit Forecast, by Power Rating 2020 & 2033
- Table 43: Global Construction Portable Generators Market Revenue Million Forecast, by Fuel Type 2020 & 2033
- Table 44: Global Construction Portable Generators Market Volume K Unit Forecast, by Fuel Type 2020 & 2033
- Table 45: Global Construction Portable Generators Market Revenue Million Forecast, by Country 2020 & 2033
- Table 46: Global Construction Portable Generators Market Volume K Unit Forecast, by Country 2020 & 2033
- Table 47: China Construction Portable Generators Market Revenue (Million) Forecast, by Application 2020 & 2033
- Table 48: China Construction Portable Generators Market Volume (K Unit) Forecast, by Application 2020 & 2033
- Table 49: India Construction Portable Generators Market Revenue (Million) Forecast, by Application 2020 & 2033
- Table 50: India Construction Portable Generators Market Volume (K Unit) Forecast, by Application 2020 & 2033
- Table 51: Japan Construction Portable Generators Market Revenue (Million) Forecast, by Application 2020 & 2033
- Table 52: Japan Construction Portable Generators Market Volume (K Unit) Forecast, by Application 2020 & 2033
- Table 53: South Korea Construction Portable Generators Market Revenue (Million) Forecast, by Application 2020 & 2033
- Table 54: South Korea Construction Portable Generators Market Volume (K Unit) Forecast, by Application 2020 & 2033
- Table 55: Malaysia Construction Portable Generators Market Revenue (Million) Forecast, by Application 2020 & 2033
- Table 56: Malaysia Construction Portable Generators Market Volume (K Unit) Forecast, by Application 2020 & 2033
- Table 57: Thailand Construction Portable Generators Market Revenue (Million) Forecast, by Application 2020 & 2033
- Table 58: Thailand Construction Portable Generators Market Volume (K Unit) Forecast, by Application 2020 & 2033
- Table 59: Indonesia Construction Portable Generators Market Revenue (Million) Forecast, by Application 2020 & 2033
- Table 60: Indonesia Construction Portable Generators Market Volume (K Unit) Forecast, by Application 2020 & 2033
- Table 61: Vietnam Construction Portable Generators Market Revenue (Million) Forecast, by Application 2020 & 2033
- Table 62: Vietnam Construction Portable Generators Market Volume (K Unit) Forecast, by Application 2020 & 2033
- Table 63: Rest of Asia Pacific Construction Portable Generators Market Revenue (Million) Forecast, by Application 2020 & 2033
- Table 64: Rest of Asia Pacific Construction Portable Generators Market Volume (K Unit) Forecast, by Application 2020 & 2033
- Table 65: Global Construction Portable Generators Market Revenue Million Forecast, by Power Rating 2020 & 2033
- Table 66: Global Construction Portable Generators Market Volume K Unit Forecast, by Power Rating 2020 & 2033
- Table 67: Global Construction Portable Generators Market Revenue Million Forecast, by Fuel Type 2020 & 2033
- Table 68: Global Construction Portable Generators Market Volume K Unit Forecast, by Fuel Type 2020 & 2033
- Table 69: Global Construction Portable Generators Market Revenue Million Forecast, by Country 2020 & 2033
- Table 70: Global Construction Portable Generators Market Volume K Unit Forecast, by Country 2020 & 2033
- Table 71: Brazil Construction Portable Generators Market Revenue (Million) Forecast, by Application 2020 & 2033
- Table 72: Brazil Construction Portable Generators Market Volume (K Unit) Forecast, by Application 2020 & 2033
- Table 73: Argentina Construction Portable Generators Market Revenue (Million) Forecast, by Application 2020 & 2033
- Table 74: Argentina Construction Portable Generators Market Volume (K Unit) Forecast, by Application 2020 & 2033
- Table 75: Colombia Construction Portable Generators Market Revenue (Million) Forecast, by Application 2020 & 2033
- Table 76: Colombia Construction Portable Generators Market Volume (K Unit) Forecast, by Application 2020 & 2033
- Table 77: Rest of South America Construction Portable Generators Market Revenue (Million) Forecast, by Application 2020 & 2033
- Table 78: Rest of South America Construction Portable Generators Market Volume (K Unit) Forecast, by Application 2020 & 2033
- Table 79: Global Construction Portable Generators Market Revenue Million Forecast, by Power Rating 2020 & 2033
- Table 80: Global Construction Portable Generators Market Volume K Unit Forecast, by Power Rating 2020 & 2033
- Table 81: Global Construction Portable Generators Market Revenue Million Forecast, by Fuel Type 2020 & 2033
- Table 82: Global Construction Portable Generators Market Volume K Unit Forecast, by Fuel Type 2020 & 2033
- Table 83: Global Construction Portable Generators Market Revenue Million Forecast, by Country 2020 & 2033
- Table 84: Global Construction Portable Generators Market Volume K Unit Forecast, by Country 2020 & 2033
- Table 85: Saudi Arabia Construction Portable Generators Market Revenue (Million) Forecast, by Application 2020 & 2033
- Table 86: Saudi Arabia Construction Portable Generators Market Volume (K Unit) Forecast, by Application 2020 & 2033
- Table 87: United Arab Emirates Construction Portable Generators Market Revenue (Million) Forecast, by Application 2020 & 2033
- Table 88: United Arab Emirates Construction Portable Generators Market Volume (K Unit) Forecast, by Application 2020 & 2033
- Table 89: South Africa Construction Portable Generators Market Revenue (Million) Forecast, by Application 2020 & 2033
- Table 90: South Africa Construction Portable Generators Market Volume (K Unit) Forecast, by Application 2020 & 2033
- Table 91: Egypt Construction Portable Generators Market Revenue (Million) Forecast, by Application 2020 & 2033
- Table 92: Egypt Construction Portable Generators Market Volume (K Unit) Forecast, by Application 2020 & 2033
- Table 93: Nigeria Construction Portable Generators Market Revenue (Million) Forecast, by Application 2020 & 2033
- Table 94: Nigeria Construction Portable Generators Market Volume (K Unit) Forecast, by Application 2020 & 2033
- Table 95: Qatar Construction Portable Generators Market Revenue (Million) Forecast, by Application 2020 & 2033
- Table 96: Qatar Construction Portable Generators Market Volume (K Unit) Forecast, by Application 2020 & 2033
- Table 97: Rest of Middle East and Africa Construction Portable Generators Market Revenue (Million) Forecast, by Application 2020 & 2033
- Table 98: Rest of Middle East and Africa Construction Portable Generators Market Volume (K Unit) Forecast, by Application 2020 & 2033
Frequently Asked Questions
1. What is the projected Compound Annual Growth Rate (CAGR) of the Construction Portable Generators Market?
The projected CAGR is approximately 5.50%.
2. Which companies are prominent players in the Construction Portable Generators Market?
Key companies in the market include Briggs & Stratton Corporation, Atlas Copco AB, Yamaha Motor Co Ltd *List Not Exhaustive 6 4 Market Ranking/Share (%) Analysi, Eaton Corporation PLC, Caterpillar Inc, Honda Siel Power Products Ltd, Kohler Power Systems, Wacker Neuson SE, Generac Holdings Inc.
3. What are the main segments of the Construction Portable Generators Market?
The market segments include Power Rating, Fuel Type.
4. Can you provide details about the market size?
The market size is estimated to be USD 4.90 Million as of 2022.
5. What are some drivers contributing to market growth?
4.; Increasing Demand for portable power source4.; Increasing investments in Construction Sector across the Globe.
6. What are the notable trends driving market growth?
Above 10 KW to be a Significant Market Segment.
7. Are there any restraints impacting market growth?
4.; Increasing Demand for Battery Storage Systems and other Cleaner Sources of Standby Power.
8. Can you provide examples of recent developments in the market?
N/A
9. What pricing options are available for accessing the report?
Pricing options include single-user, multi-user, and enterprise licenses priced at USD 4750, USD 5250, and USD 8750 respectively.
10. Is the market size provided in terms of value or volume?
The market size is provided in terms of value, measured in Million and volume, measured in K Unit.
11. Are there any specific market keywords associated with the report?
Yes, the market keyword associated with the report is "Construction Portable Generators Market," which aids in identifying and referencing the specific market segment covered.
12. How do I determine which pricing option suits my needs best?
The pricing options vary based on user requirements and access needs. Individual users may opt for single-user licenses, while businesses requiring broader access may choose multi-user or enterprise licenses for cost-effective access to the report.
13. Are there any additional resources or data provided in the Construction Portable Generators Market report?
While the report offers comprehensive insights, it's advisable to review the specific contents or supplementary materials provided to ascertain if additional resources or data are available.
14. How can I stay updated on further developments or reports in the Construction Portable Generators Market?
To stay informed about further developments, trends, and reports in the Construction Portable Generators Market, consider subscribing to industry newsletters, following relevant companies and organizations, or regularly checking reputable industry news sources and publications.
Methodology
Step 1 - Identification of Relevant Samples Size from Population Database


Step 2 - Approaches for Defining Global Market Size (Value, Volume* & Price*)

Note*: In applicable scenarios
Step 3 - Data Sources
Primary Research
- Web Analytics
- Survey Reports
- Research Institute
- Latest Research Reports
- Opinion Leaders
Secondary Research
- Annual Reports
- White Paper
- Latest Press Release
- Industry Association
- Paid Database
- Investor Presentations

Step 4 - Data Triangulation
Involves using different sources of information in order to increase the validity of a study
These sources are likely to be stakeholders in a program - participants, other researchers, program staff, other community members, and so on.
Then we put all data in single framework & apply various statistical tools to find out the dynamic on the market.
During the analysis stage, feedback from the stakeholder groups would be compared to determine areas of agreement as well as areas of divergence