


Key Insights
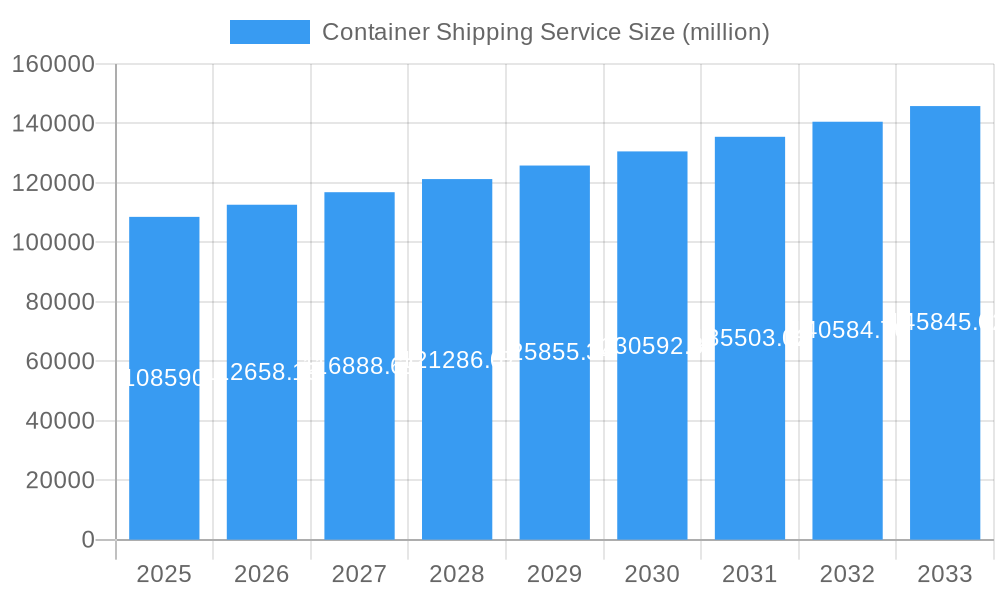
The global container shipping service market, valued at $108.59 billion in 2025, is projected to experience steady growth, driven by increasing global trade volumes and the ongoing expansion of e-commerce. A compound annual growth rate (CAGR) of 3.5% from 2025 to 2033 suggests a substantial market expansion over the forecast period. Key drivers include the rising demand for faster and more reliable shipping solutions, the growth of manufacturing and export activities in developing economies, and the increasing adoption of sophisticated logistics and supply chain management technologies. While potential restraints such as geopolitical instability, fluctuating fuel prices, and port congestion could impact growth, the overall market outlook remains positive. The market is highly concentrated, with major players like Maersk, MSC, CMA-CGM, Hapag-Lloyd, COSCO, Ocean Network Express, Evergreen Line, Hyundai Merchant Marine, Yang Ming Marine Transport, and Zim Integrated Shipping Services Ltd. dominating the landscape through their extensive vessel fleets, global network reach, and advanced technological capabilities. These companies are constantly striving to enhance their operational efficiency, optimize shipping routes, and provide value-added services to maintain their competitive edge.
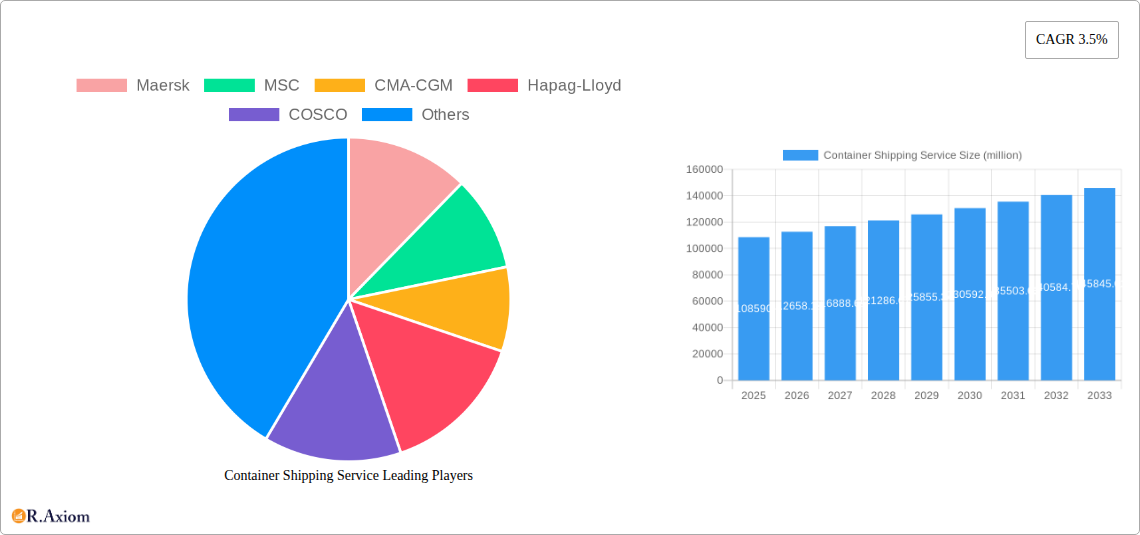
Container Shipping Service Market Size (In Billion)

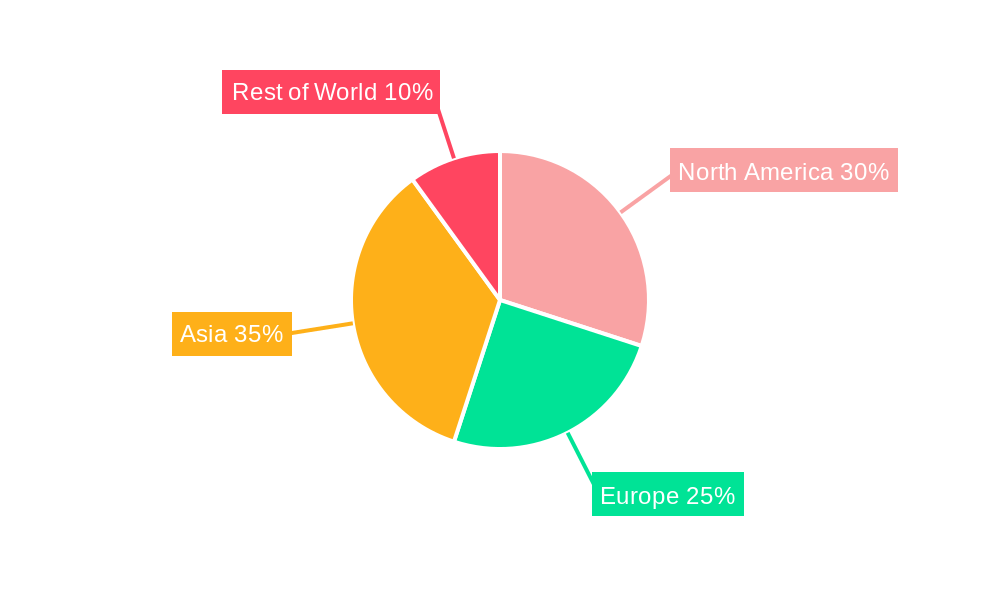
The competitive intensity within the container shipping sector necessitates continuous innovation and strategic partnerships. Companies are investing heavily in digitalization, automation, and sustainable practices to improve their environmental footprint and meet evolving customer demands. The market is further segmented geographically, with variations in regional growth rates reflecting economic activity and infrastructure development in different regions. While precise regional data is unavailable, North America and Asia are expected to remain significant contributors to the market's overall growth, driven by their substantial manufacturing and consumption capabilities. The forecast period will likely see a gradual shift towards sustainable shipping practices, including the adoption of alternative fuels and more efficient vessel designs, in response to increasing environmental concerns and regulatory pressures. Overall, the container shipping service market is poised for sustained expansion, offering attractive opportunities for established players and new entrants alike.
Container Shipping Service Company Market Share
Container Shipping Service Market: A Comprehensive Report (2019-2033)
This comprehensive report provides an in-depth analysis of the global container shipping service market, offering invaluable insights for industry stakeholders, investors, and strategic decision-makers. The report covers the period from 2019 to 2033, with a focus on the forecast period of 2025-2033 and a base year of 2025. The study utilizes rigorous methodologies and data analysis to present a clear and actionable understanding of market trends, dynamics, and future prospects. Millions are used for all value mentions.
Container Shipping Service Market Concentration & Innovation
The global container shipping service market exhibits high concentration, dominated by a few major players. Maersk, MSC, CMA-CGM, Hapag-Lloyd, and COSCO collectively control a significant portion (estimated xx million USD) of the global market share, exceeding xx%. This oligopolistic structure influences pricing, capacity allocation, and technological advancements within the industry.
- Market Share (2024 Estimate): Maersk (xx%), MSC (xx%), CMA-CGM (xx%), Hapag-Lloyd (xx%), COSCO (xx%), Others (xx%).
- Innovation Drivers: Technological advancements such as digitalization, automation (e.g., autonomous vessels), and improved logistics management systems are driving efficiency and reducing operational costs. Environmental regulations and the push for sustainability are also stimulating innovation in areas like alternative fuels and reduced emissions technologies.
- Regulatory Frameworks: International maritime regulations, port infrastructure developments, and trade policies significantly impact market dynamics. Stringent environmental regulations are driving investment in greener shipping solutions.
- M&A Activities: The historical period (2019-2024) witnessed several significant M&A deals, totaling an estimated xx million USD in value, primarily focused on expanding capacity, optimizing logistics networks, and enhancing technological capabilities. Future M&A activity is expected to remain substantial as companies strive for greater market share and operational efficiency.
- Product Substitutes: While direct substitutes are limited, alternative transportation modes like air freight and rail transport pose indirect competition, particularly for time-sensitive goods. The rise of e-commerce further impacts demand for efficient and reliable container shipping services.
- End-User Trends: Growing global trade, particularly in e-commerce and consumer goods, fuels demand for container shipping services. The increasing focus on supply chain resilience and diversification also drives market growth.
Container Shipping Service Industry Trends & Insights
The global container shipping service market is projected to experience substantial growth during the forecast period (2025-2033), with a CAGR of approximately xx%. Several factors contribute to this positive outlook:
- Market Growth Drivers: Expanding global trade, increased consumer spending, and the rise of e-commerce are key drivers. Furthermore, infrastructure improvements in developing economies and the ongoing shift towards globalization are boosting demand for efficient and reliable container shipping.
- Technological Disruptions: The adoption of digital technologies, including blockchain for supply chain transparency, IoT for real-time cargo tracking, and AI for optimized route planning, is transforming the industry. Automation and the development of autonomous vessels promise to enhance efficiency and reduce costs.
- Consumer Preferences: Consumers increasingly demand faster and more reliable delivery, which necessitates efficient and technologically advanced container shipping services. Sustainability concerns also influence consumer choices, driving the demand for environmentally friendly shipping solutions.
- Competitive Dynamics: The highly concentrated market features intense competition among major players, leading to price fluctuations and the implementation of various strategies to gain a competitive edge. This includes capacity expansion, service differentiation, and technological innovation. Market penetration by smaller players is limited due to the significant capital investment required to enter the market.
Dominant Markets & Segments in Container Shipping Service
Asia dominates the global container shipping market, with regions like East Asia, South Asia, and Southeast Asia driving significant growth. This dominance is attributable to factors such as:
Key Drivers in Asia:
- Robust Manufacturing Base: Asia is home to numerous manufacturing hubs, resulting in high volumes of goods requiring container shipping.
- Expanding E-commerce: The rapid expansion of e-commerce in Asian markets drives demand for efficient shipping services.
- Government Initiatives: Government policies supporting infrastructure development and trade liberalization contribute to market expansion.
- Strong Intra-Regional Trade: A significant portion of container shipping within Asia itself contributes to high volumes.
Dominance Analysis: The high concentration of manufacturing and consumption within Asia, coupled with substantial investment in port infrastructure and logistics networks, firmly establishes it as the leading market for container shipping services. The growth of intra-Asian trade further amplifies the region’s dominance. Other regions, like Europe and North America, maintain significant shares but lag behind Asia in terms of overall market size and growth rate.
Container Shipping Service Product Developments
Recent product innovations in the container shipping service market include the introduction of larger container vessels to improve economies of scale, the development of more efficient logistics and tracking systems using digital technology, and an increased focus on environmentally friendly shipping practices (e.g., using alternative fuels and improving vessel design for reduced emissions). These innovations offer significant competitive advantages in terms of cost efficiency, speed, and environmental sustainability, improving market fit and appeal.
Report Scope & Segmentation Analysis
This report segments the container shipping service market by vessel type (e.g., TEU capacity), trade lane, and geographic region. The report provides detailed growth projections, market sizes, and competitive dynamics for each segment. For instance, the segment for large container vessels (e.g., Ultra Large Container Vessels) is projected to have xx million USD market size by 2033, driven by economies of scale and increased demand for large-volume shipping. Specific data for other segments, like trade lane and region, will be detailed in the full report.
Key Drivers of Container Shipping Service Growth
The growth of the container shipping service market is driven by several factors including: increasing global trade volumes, particularly in emerging economies; advancements in technology improving efficiency and reducing costs; infrastructure improvements in ports and logistics networks; and supportive government policies fostering international trade.
Challenges in the Container Shipping Service Sector
The container shipping service sector faces challenges such as: fluctuations in global demand impacting freight rates; geopolitical uncertainties disrupting trade routes; environmental regulations increasing operational costs; and intense competition among major players leading to price wars. These challenges could potentially impact the market by reducing profit margins and hindering growth in certain segments.
Emerging Opportunities in Container Shipping Service
Emerging opportunities include: expansion into new markets (e.g., developing economies in Africa and Latin America); technological advancements like autonomous vessels and blockchain technology; and an increasing focus on sustainable shipping practices creating new market niches.
Leading Players in the Container Shipping Service Market
- Maersk
- MSC
- CMA-CGM
- Hapag-Lloyd
- COSCO
- Ocean Network Express
- Evergreen Line
- Hyundai Merchant Marine
- Yang Ming Marine Transport
- Zim Integrated Shipping Services Ltd
Key Developments in Container Shipping Service Industry
- 2022 Q4: Increased investment in digitalization and automation across the major players.
- 2023 Q1: Several alliances formed amongst container shipping companies to enhance operational efficiency and reduce costs.
- 2023 Q3: Launch of new, larger container vessels by Maersk and MSC, impacting global capacity.
- 2024 Q2: Significant investment in sustainable shipping technologies reported across the industry.
Strategic Outlook for Container Shipping Service Market
The container shipping service market is poised for continued growth driven by global trade expansion, technological innovations, and a growing focus on sustainability. Opportunities exist for companies to capitalize on emerging markets, invest in new technologies, and implement environmentally friendly practices. Further consolidation within the industry is anticipated as companies seek to enhance their market position and reduce costs. The development of efficient and reliable supply chains will remain a key priority, driving demand for sophisticated container shipping solutions.
Container Shipping Service Segmentation
-
1. Application
- 1.1. Food Transport
- 1.2. Industrial Product Transport
- 1.3. Consumer Goods Transport
- 1.4. Other
-
2. Types
- 2.1. Above 30ft
- 2.2. Below 30ft
Container Shipping Service Segmentation By Geography
-
1. North America
- 1.1. United States
- 1.2. Canada
- 1.3. Mexico
-
2. South America
- 2.1. Brazil
- 2.2. Argentina
- 2.3. Rest of South America
-
3. Europe
- 3.1. United Kingdom
- 3.2. Germany
- 3.3. France
- 3.4. Italy
- 3.5. Spain
- 3.6. Russia
- 3.7. Benelux
- 3.8. Nordics
- 3.9. Rest of Europe
-
4. Middle East & Africa
- 4.1. Turkey
- 4.2. Israel
- 4.3. GCC
- 4.4. North Africa
- 4.5. South Africa
- 4.6. Rest of Middle East & Africa
-
5. Asia Pacific
- 5.1. China
- 5.2. India
- 5.3. Japan
- 5.4. South Korea
- 5.5. ASEAN
- 5.6. Oceania
- 5.7. Rest of Asia Pacific
Container Shipping Service Regional Market Share
Geographic Coverage of Container Shipping Service
Container Shipping Service REPORT HIGHLIGHTS
| Aspects | Details |
|---|---|
| Study Period | 2020-2034 |
| Base Year | 2025 |
| Estimated Year | 2026 |
| Forecast Period | 2026-2034 |
| Historical Period | 2020-2025 |
| Growth Rate | CAGR of 3.5% from 2020-2034 |
| Segmentation |
|
Table of Contents
- 1. Introduction
- 1.1. Research Scope
- 1.2. Market Segmentation
- 1.3. Research Methodology
- 1.4. Definitions and Assumptions
- 2. Executive Summary
- 2.1. Introduction
- 3. Market Dynamics
- 3.1. Introduction
- 3.2. Market Drivers
- 3.3. Market Restrains
- 3.4. Market Trends
- 4. Market Factor Analysis
- 4.1. Porters Five Forces
- 4.2. Supply/Value Chain
- 4.3. PESTEL analysis
- 4.4. Market Entropy
- 4.5. Patent/Trademark Analysis
- 5. Global Container Shipping Service Analysis, Insights and Forecast, 2020-2032
- 5.1. Market Analysis, Insights and Forecast - by Application
- 5.1.1. Food Transport
- 5.1.2. Industrial Product Transport
- 5.1.3. Consumer Goods Transport
- 5.1.4. Other
- 5.2. Market Analysis, Insights and Forecast - by Types
- 5.2.1. Above 30ft
- 5.2.2. Below 30ft
- 5.3. Market Analysis, Insights and Forecast - by Region
- 5.3.1. North America
- 5.3.2. South America
- 5.3.3. Europe
- 5.3.4. Middle East & Africa
- 5.3.5. Asia Pacific
- 5.1. Market Analysis, Insights and Forecast - by Application
- 6. North America Container Shipping Service Analysis, Insights and Forecast, 2020-2032
- 6.1. Market Analysis, Insights and Forecast - by Application
- 6.1.1. Food Transport
- 6.1.2. Industrial Product Transport
- 6.1.3. Consumer Goods Transport
- 6.1.4. Other
- 6.2. Market Analysis, Insights and Forecast - by Types
- 6.2.1. Above 30ft
- 6.2.2. Below 30ft
- 6.1. Market Analysis, Insights and Forecast - by Application
- 7. South America Container Shipping Service Analysis, Insights and Forecast, 2020-2032
- 7.1. Market Analysis, Insights and Forecast - by Application
- 7.1.1. Food Transport
- 7.1.2. Industrial Product Transport
- 7.1.3. Consumer Goods Transport
- 7.1.4. Other
- 7.2. Market Analysis, Insights and Forecast - by Types
- 7.2.1. Above 30ft
- 7.2.2. Below 30ft
- 7.1. Market Analysis, Insights and Forecast - by Application
- 8. Europe Container Shipping Service Analysis, Insights and Forecast, 2020-2032
- 8.1. Market Analysis, Insights and Forecast - by Application
- 8.1.1. Food Transport
- 8.1.2. Industrial Product Transport
- 8.1.3. Consumer Goods Transport
- 8.1.4. Other
- 8.2. Market Analysis, Insights and Forecast - by Types
- 8.2.1. Above 30ft
- 8.2.2. Below 30ft
- 8.1. Market Analysis, Insights and Forecast - by Application
- 9. Middle East & Africa Container Shipping Service Analysis, Insights and Forecast, 2020-2032
- 9.1. Market Analysis, Insights and Forecast - by Application
- 9.1.1. Food Transport
- 9.1.2. Industrial Product Transport
- 9.1.3. Consumer Goods Transport
- 9.1.4. Other
- 9.2. Market Analysis, Insights and Forecast - by Types
- 9.2.1. Above 30ft
- 9.2.2. Below 30ft
- 9.1. Market Analysis, Insights and Forecast - by Application
- 10. Asia Pacific Container Shipping Service Analysis, Insights and Forecast, 2020-2032
- 10.1. Market Analysis, Insights and Forecast - by Application
- 10.1.1. Food Transport
- 10.1.2. Industrial Product Transport
- 10.1.3. Consumer Goods Transport
- 10.1.4. Other
- 10.2. Market Analysis, Insights and Forecast - by Types
- 10.2.1. Above 30ft
- 10.2.2. Below 30ft
- 10.1. Market Analysis, Insights and Forecast - by Application
- 11. Competitive Analysis
- 11.1. Global Market Share Analysis 2025
- 11.2. Company Profiles
- 11.2.1 Maersk
- 11.2.1.1. Overview
- 11.2.1.2. Products
- 11.2.1.3. SWOT Analysis
- 11.2.1.4. Recent Developments
- 11.2.1.5. Financials (Based on Availability)
- 11.2.2 MSC
- 11.2.2.1. Overview
- 11.2.2.2. Products
- 11.2.2.3. SWOT Analysis
- 11.2.2.4. Recent Developments
- 11.2.2.5. Financials (Based on Availability)
- 11.2.3 CMA-CGM
- 11.2.3.1. Overview
- 11.2.3.2. Products
- 11.2.3.3. SWOT Analysis
- 11.2.3.4. Recent Developments
- 11.2.3.5. Financials (Based on Availability)
- 11.2.4 Hapag-Lloyd
- 11.2.4.1. Overview
- 11.2.4.2. Products
- 11.2.4.3. SWOT Analysis
- 11.2.4.4. Recent Developments
- 11.2.4.5. Financials (Based on Availability)
- 11.2.5 COSCO
- 11.2.5.1. Overview
- 11.2.5.2. Products
- 11.2.5.3. SWOT Analysis
- 11.2.5.4. Recent Developments
- 11.2.5.5. Financials (Based on Availability)
- 11.2.6 Ocean Network Express
- 11.2.6.1. Overview
- 11.2.6.2. Products
- 11.2.6.3. SWOT Analysis
- 11.2.6.4. Recent Developments
- 11.2.6.5. Financials (Based on Availability)
- 11.2.7 Evergreen Line
- 11.2.7.1. Overview
- 11.2.7.2. Products
- 11.2.7.3. SWOT Analysis
- 11.2.7.4. Recent Developments
- 11.2.7.5. Financials (Based on Availability)
- 11.2.8 Hyundai Merchant Marine
- 11.2.8.1. Overview
- 11.2.8.2. Products
- 11.2.8.3. SWOT Analysis
- 11.2.8.4. Recent Developments
- 11.2.8.5. Financials (Based on Availability)
- 11.2.9 Yang Ming Marine Transport
- 11.2.9.1. Overview
- 11.2.9.2. Products
- 11.2.9.3. SWOT Analysis
- 11.2.9.4. Recent Developments
- 11.2.9.5. Financials (Based on Availability)
- 11.2.10 Zim Integrated Shipping Services Ltd
- 11.2.10.1. Overview
- 11.2.10.2. Products
- 11.2.10.3. SWOT Analysis
- 11.2.10.4. Recent Developments
- 11.2.10.5. Financials (Based on Availability)
- 11.2.1 Maersk
List of Figures
- Figure 1: Global Container Shipping Service Revenue Breakdown (million, %) by Region 2025 & 2033
- Figure 2: North America Container Shipping Service Revenue (million), by Application 2025 & 2033
- Figure 3: North America Container Shipping Service Revenue Share (%), by Application 2025 & 2033
- Figure 4: North America Container Shipping Service Revenue (million), by Types 2025 & 2033
- Figure 5: North America Container Shipping Service Revenue Share (%), by Types 2025 & 2033
- Figure 6: North America Container Shipping Service Revenue (million), by Country 2025 & 2033
- Figure 7: North America Container Shipping Service Revenue Share (%), by Country 2025 & 2033
- Figure 8: South America Container Shipping Service Revenue (million), by Application 2025 & 2033
- Figure 9: South America Container Shipping Service Revenue Share (%), by Application 2025 & 2033
- Figure 10: South America Container Shipping Service Revenue (million), by Types 2025 & 2033
- Figure 11: South America Container Shipping Service Revenue Share (%), by Types 2025 & 2033
- Figure 12: South America Container Shipping Service Revenue (million), by Country 2025 & 2033
- Figure 13: South America Container Shipping Service Revenue Share (%), by Country 2025 & 2033
- Figure 14: Europe Container Shipping Service Revenue (million), by Application 2025 & 2033
- Figure 15: Europe Container Shipping Service Revenue Share (%), by Application 2025 & 2033
- Figure 16: Europe Container Shipping Service Revenue (million), by Types 2025 & 2033
- Figure 17: Europe Container Shipping Service Revenue Share (%), by Types 2025 & 2033
- Figure 18: Europe Container Shipping Service Revenue (million), by Country 2025 & 2033
- Figure 19: Europe Container Shipping Service Revenue Share (%), by Country 2025 & 2033
- Figure 20: Middle East & Africa Container Shipping Service Revenue (million), by Application 2025 & 2033
- Figure 21: Middle East & Africa Container Shipping Service Revenue Share (%), by Application 2025 & 2033
- Figure 22: Middle East & Africa Container Shipping Service Revenue (million), by Types 2025 & 2033
- Figure 23: Middle East & Africa Container Shipping Service Revenue Share (%), by Types 2025 & 2033
- Figure 24: Middle East & Africa Container Shipping Service Revenue (million), by Country 2025 & 2033
- Figure 25: Middle East & Africa Container Shipping Service Revenue Share (%), by Country 2025 & 2033
- Figure 26: Asia Pacific Container Shipping Service Revenue (million), by Application 2025 & 2033
- Figure 27: Asia Pacific Container Shipping Service Revenue Share (%), by Application 2025 & 2033
- Figure 28: Asia Pacific Container Shipping Service Revenue (million), by Types 2025 & 2033
- Figure 29: Asia Pacific Container Shipping Service Revenue Share (%), by Types 2025 & 2033
- Figure 30: Asia Pacific Container Shipping Service Revenue (million), by Country 2025 & 2033
- Figure 31: Asia Pacific Container Shipping Service Revenue Share (%), by Country 2025 & 2033
List of Tables
- Table 1: Global Container Shipping Service Revenue million Forecast, by Application 2020 & 2033
- Table 2: Global Container Shipping Service Revenue million Forecast, by Types 2020 & 2033
- Table 3: Global Container Shipping Service Revenue million Forecast, by Region 2020 & 2033
- Table 4: Global Container Shipping Service Revenue million Forecast, by Application 2020 & 2033
- Table 5: Global Container Shipping Service Revenue million Forecast, by Types 2020 & 2033
- Table 6: Global Container Shipping Service Revenue million Forecast, by Country 2020 & 2033
- Table 7: United States Container Shipping Service Revenue (million) Forecast, by Application 2020 & 2033
- Table 8: Canada Container Shipping Service Revenue (million) Forecast, by Application 2020 & 2033
- Table 9: Mexico Container Shipping Service Revenue (million) Forecast, by Application 2020 & 2033
- Table 10: Global Container Shipping Service Revenue million Forecast, by Application 2020 & 2033
- Table 11: Global Container Shipping Service Revenue million Forecast, by Types 2020 & 2033
- Table 12: Global Container Shipping Service Revenue million Forecast, by Country 2020 & 2033
- Table 13: Brazil Container Shipping Service Revenue (million) Forecast, by Application 2020 & 2033
- Table 14: Argentina Container Shipping Service Revenue (million) Forecast, by Application 2020 & 2033
- Table 15: Rest of South America Container Shipping Service Revenue (million) Forecast, by Application 2020 & 2033
- Table 16: Global Container Shipping Service Revenue million Forecast, by Application 2020 & 2033
- Table 17: Global Container Shipping Service Revenue million Forecast, by Types 2020 & 2033
- Table 18: Global Container Shipping Service Revenue million Forecast, by Country 2020 & 2033
- Table 19: United Kingdom Container Shipping Service Revenue (million) Forecast, by Application 2020 & 2033
- Table 20: Germany Container Shipping Service Revenue (million) Forecast, by Application 2020 & 2033
- Table 21: France Container Shipping Service Revenue (million) Forecast, by Application 2020 & 2033
- Table 22: Italy Container Shipping Service Revenue (million) Forecast, by Application 2020 & 2033
- Table 23: Spain Container Shipping Service Revenue (million) Forecast, by Application 2020 & 2033
- Table 24: Russia Container Shipping Service Revenue (million) Forecast, by Application 2020 & 2033
- Table 25: Benelux Container Shipping Service Revenue (million) Forecast, by Application 2020 & 2033
- Table 26: Nordics Container Shipping Service Revenue (million) Forecast, by Application 2020 & 2033
- Table 27: Rest of Europe Container Shipping Service Revenue (million) Forecast, by Application 2020 & 2033
- Table 28: Global Container Shipping Service Revenue million Forecast, by Application 2020 & 2033
- Table 29: Global Container Shipping Service Revenue million Forecast, by Types 2020 & 2033
- Table 30: Global Container Shipping Service Revenue million Forecast, by Country 2020 & 2033
- Table 31: Turkey Container Shipping Service Revenue (million) Forecast, by Application 2020 & 2033
- Table 32: Israel Container Shipping Service Revenue (million) Forecast, by Application 2020 & 2033
- Table 33: GCC Container Shipping Service Revenue (million) Forecast, by Application 2020 & 2033
- Table 34: North Africa Container Shipping Service Revenue (million) Forecast, by Application 2020 & 2033
- Table 35: South Africa Container Shipping Service Revenue (million) Forecast, by Application 2020 & 2033
- Table 36: Rest of Middle East & Africa Container Shipping Service Revenue (million) Forecast, by Application 2020 & 2033
- Table 37: Global Container Shipping Service Revenue million Forecast, by Application 2020 & 2033
- Table 38: Global Container Shipping Service Revenue million Forecast, by Types 2020 & 2033
- Table 39: Global Container Shipping Service Revenue million Forecast, by Country 2020 & 2033
- Table 40: China Container Shipping Service Revenue (million) Forecast, by Application 2020 & 2033
- Table 41: India Container Shipping Service Revenue (million) Forecast, by Application 2020 & 2033
- Table 42: Japan Container Shipping Service Revenue (million) Forecast, by Application 2020 & 2033
- Table 43: South Korea Container Shipping Service Revenue (million) Forecast, by Application 2020 & 2033
- Table 44: ASEAN Container Shipping Service Revenue (million) Forecast, by Application 2020 & 2033
- Table 45: Oceania Container Shipping Service Revenue (million) Forecast, by Application 2020 & 2033
- Table 46: Rest of Asia Pacific Container Shipping Service Revenue (million) Forecast, by Application 2020 & 2033
Frequently Asked Questions
1. What is the projected Compound Annual Growth Rate (CAGR) of the Container Shipping Service?
The projected CAGR is approximately 3.5%.
2. Which companies are prominent players in the Container Shipping Service?
Key companies in the market include Maersk, MSC, CMA-CGM, Hapag-Lloyd, COSCO, Ocean Network Express, Evergreen Line, Hyundai Merchant Marine, Yang Ming Marine Transport, Zim Integrated Shipping Services Ltd.
3. What are the main segments of the Container Shipping Service?
The market segments include Application, Types.
4. Can you provide details about the market size?
The market size is estimated to be USD 108590 million as of 2022.
5. What are some drivers contributing to market growth?
N/A
6. What are the notable trends driving market growth?
N/A
7. Are there any restraints impacting market growth?
N/A
8. Can you provide examples of recent developments in the market?
N/A
9. What pricing options are available for accessing the report?
Pricing options include single-user, multi-user, and enterprise licenses priced at USD 4350.00, USD 6525.00, and USD 8700.00 respectively.
10. Is the market size provided in terms of value or volume?
The market size is provided in terms of value, measured in million.
11. Are there any specific market keywords associated with the report?
Yes, the market keyword associated with the report is "Container Shipping Service," which aids in identifying and referencing the specific market segment covered.
12. How do I determine which pricing option suits my needs best?
The pricing options vary based on user requirements and access needs. Individual users may opt for single-user licenses, while businesses requiring broader access may choose multi-user or enterprise licenses for cost-effective access to the report.
13. Are there any additional resources or data provided in the Container Shipping Service report?
While the report offers comprehensive insights, it's advisable to review the specific contents or supplementary materials provided to ascertain if additional resources or data are available.
14. How can I stay updated on further developments or reports in the Container Shipping Service?
To stay informed about further developments, trends, and reports in the Container Shipping Service, consider subscribing to industry newsletters, following relevant companies and organizations, or regularly checking reputable industry news sources and publications.
Methodology
Step 1 - Identification of Relevant Samples Size from Population Database


Step 2 - Approaches for Defining Global Market Size (Value, Volume* & Price*)

Note*: In applicable scenarios
Step 3 - Data Sources
Primary Research
- Web Analytics
- Survey Reports
- Research Institute
- Latest Research Reports
- Opinion Leaders
Secondary Research
- Annual Reports
- White Paper
- Latest Press Release
- Industry Association
- Paid Database
- Investor Presentations

Step 4 - Data Triangulation
Involves using different sources of information in order to increase the validity of a study
These sources are likely to be stakeholders in a program - participants, other researchers, program staff, other community members, and so on.
Then we put all data in single framework & apply various statistical tools to find out the dynamic on the market.
During the analysis stage, feedback from the stakeholder groups would be compared to determine areas of agreement as well as areas of divergence