Key Insights
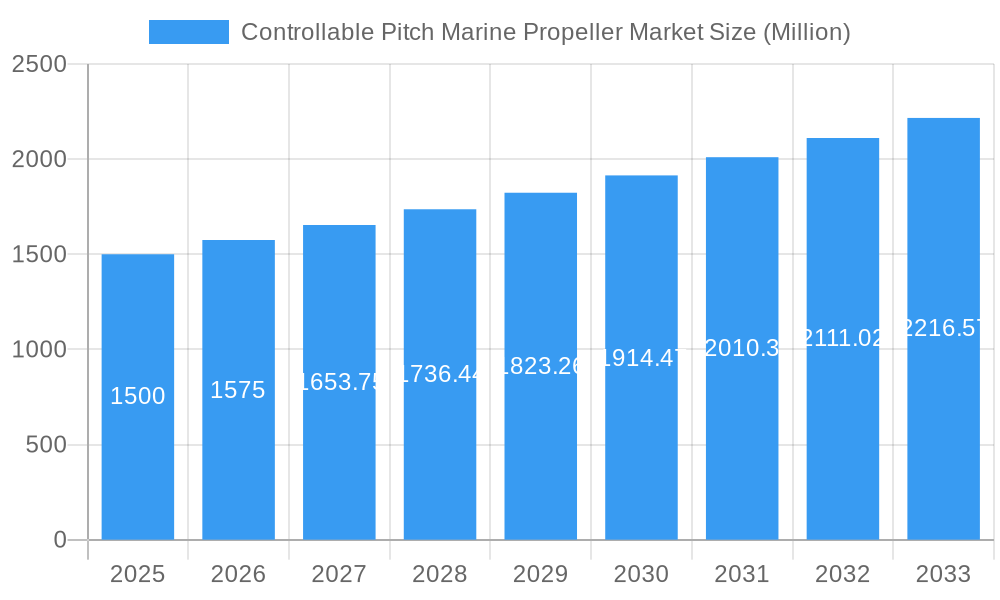
The Controllable Pitch Marine Propeller (CPMP) market is forecast to reach $4.85 billion by 2025, exhibiting a robust Compound Annual Growth Rate (CAGR) of 8.3% from 2025 to 2033. This growth is propelled by several key drivers. Primarily, the marine industry's increasing demand for advanced fuel-efficient propulsion systems, a critical factor amidst rising fuel costs and stringent environmental regulations. CPMPs offer significant fuel savings over conventional fixed-pitch propellers. Secondly, expanding global maritime trade and growth in the passenger vessel sector are bolstering demand for dependable and efficient propulsion technologies. Technological innovations, including more durable and intelligent control systems, further enhance CPMP attractiveness. Additionally, the requirement for superior maneuverability across diverse vessel types, such as tugs, ferries, and commercial ships, is accelerating CPMP adoption. The market encompasses applications in passenger vessels, commercial and cargo ships, and specialized craft including tugs, push boats, ferries, and icebreakers. Leading industry players such as Rolls Royce, Niigata Power Systems, Caterpillar Inc., Kawasaki Group, Brunvoll AS, and Wärtsilä are at the forefront of innovation and market competition.
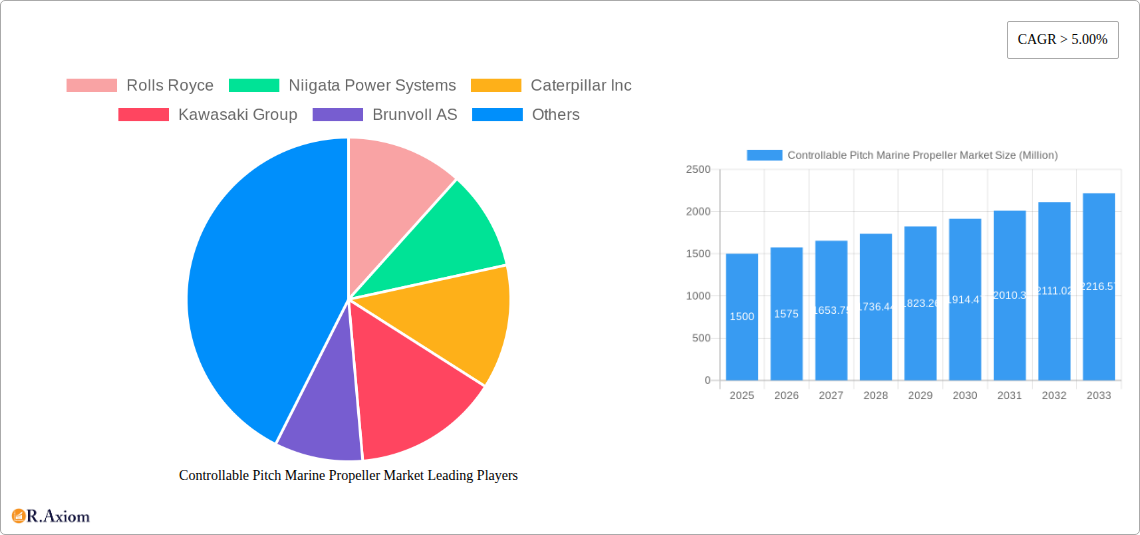
Controllable Pitch Marine Propeller Market Market Size (In Billion)
Despite the positive outlook, market expansion faces certain constraints. The substantial initial capital expenditure for CPMPs, relative to fixed-pitch alternatives, can pose a barrier for smaller operators. Furthermore, the intricate nature of CPMP maintenance and repair presents operational challenges. However, the long-term advantages of enhanced fuel efficiency, superior maneuverability, and improved operational performance are projected to surmount these hurdles, ensuring sustained market expansion throughout the forecast period. Geographically, North America, Europe, and Asia Pacific are key markets, with emerging economies offering significant growth potential due to their rapidly expanding maritime sectors. Future advancements in materials science, leading to lighter, stronger, and more corrosion-resistant propellers, alongside the increasing integration of automation and digital technologies for refined control and monitoring, will shape market trajectory.
Controllable Pitch Marine Propeller Market Company Market Share
Controllable Pitch Marine Propeller Market: A Comprehensive Analysis (2019-2033)
This comprehensive report provides an in-depth analysis of the Controllable Pitch Marine Propeller market, offering valuable insights for industry stakeholders, investors, and strategic decision-makers. The study covers the period from 2019 to 2033, with 2025 serving as the base and estimated year. The report meticulously examines market dynamics, growth drivers, challenges, and opportunities, offering a 360-degree view of this crucial maritime sector. Key players like Rolls Royce, Niigata Power Systems, Caterpillar Inc, Kawasaki Group, Brunvoll AS, and Wärtsilä are profiled, providing a granular understanding of their market strategies and competitive landscape.
Controllable Pitch Marine Propeller Market Concentration & Innovation
This section analyzes the market concentration, identifying key players and their market share. It explores the drivers of innovation, including technological advancements, regulatory changes, and the influence of substitute products. Further, it examines end-user trends impacting market demand and details recent M&A activity with associated deal values. The competitive landscape is highly consolidated, with the top five players commanding approximately xx% of the global market share in 2024.
- Market Concentration: The market demonstrates a moderately concentrated structure, with a few dominant players and several smaller niche players.
- Innovation Drivers: Stringent emission regulations, demand for fuel efficiency, and the advancement of automation technologies are driving innovation in controllable pitch marine propeller design.
- Regulatory Frameworks: IMO regulations concerning greenhouse gas emissions significantly influence the market, pushing for more energy-efficient propeller systems.
- Product Substitutes: While controllable pitch propellers are dominant, alternative propulsion systems like Azipods and waterjets present some level of substitution.
- End-User Trends: Growing demand for larger and more efficient vessels in the commercial and passenger segments is driving market growth.
- M&A Activities: The past five years have witnessed xx M&A deals in the controllable pitch marine propeller market, with a total deal value estimated at $xx Million.
Controllable Pitch Marine Propeller Market Industry Trends & Insights
This section delves into the key industry trends impacting the controllable pitch marine propeller market. It examines market growth drivers, technological disruptions, evolving consumer preferences, and the competitive dynamics shaping the industry's future. The market is projected to exhibit a CAGR of xx% during the forecast period (2025-2033), driven primarily by increasing demand from the shipping industry and technological advancements. Market penetration of advanced features, such as integrated monitoring systems and optimized blade designs, is steadily increasing.
The increasing adoption of LNG and other alternative fuels in the shipping industry is creating new opportunities for advanced propeller designs capable of handling diverse fuel types. Furthermore, technological innovations focused on improving efficiency, reducing noise pollution, and enhancing maneuverability are key factors influencing market growth. The competitive landscape is characterized by intense competition among major players focusing on technological advancements, strategic partnerships, and product differentiation.
Dominant Markets & Segments in Controllable Pitch Marine Propeller Market
This section identifies the leading regions, countries, and segments within the controllable pitch marine propeller market. The analysis considers market size, growth rate, and key drivers for each segment.
- By Number of Blades: The four-blade segment holds the largest market share due to its optimal balance of efficiency and maneuverability.
- By Application: The commercial/cargo vessel segment dominates the market due to the high volume of cargo ships requiring efficient propulsion systems.
- By Ship Type: The tug and push boat segment showcases strong growth potential driven by the increasing demand for efficient towing operations.
Key Drivers:
- Economic Policies: Government support for the shipbuilding industry and incentives for adopting environmentally friendly technologies contribute to market growth.
- Infrastructure Development: Expansion of port infrastructure and improvements in maritime transportation networks fuel demand for efficient propulsion systems.
Controllable Pitch Marine Propeller Market Product Developments
Recent product innovations focus on enhancing propeller efficiency, reducing fuel consumption, and minimizing noise pollution. The integration of advanced materials and improved blade designs has led to significant performance improvements. These developments are primarily driven by the need to meet stricter environmental regulations and improve overall vessel operational efficiency. The market is witnessing a growing demand for intelligent propellers with integrated monitoring and control systems, enhancing operational effectiveness and predictive maintenance capabilities.
Report Scope & Segmentation Analysis
This report segments the controllable pitch marine propeller market by the number of blades (two and three blades, four blades, five blades), application (passenger vessels, commercial/cargo vessels), and ship type (tug and push boats, ferries, ice breakers, other ship types). Each segment is analyzed considering market size, growth projections, and competitive dynamics. The market is segmented to provide detailed insights into individual segments’ contributions to the overall market growth and to identify potential investment opportunities.
Key Drivers of Controllable Pitch Marine Propeller Market Growth
Several factors drive the growth of the controllable pitch marine propeller market. These include the increasing demand for fuel-efficient vessels, stringent environmental regulations promoting cleaner technologies, and the growing adoption of advanced technologies like digitalization and automation in the maritime industry. Furthermore, the continuous expansion of global trade and the construction of new vessels further fuel market growth.
Challenges in the Controllable Pitch Marine Propeller Market Sector
The controllable pitch marine propeller market faces challenges including the high initial cost of these systems, complex installation procedures, and the potential for maintenance complexities. Fluctuations in raw material prices and the impact of geopolitical events on supply chains also pose risks. The market faces increasing competitive pressure from alternative propulsion systems, which demands continuous technological improvement and cost optimization to maintain competitiveness.
Emerging Opportunities in Controllable Pitch Marine Propeller Market
Emerging opportunities exist in developing markets with growing maritime activities and in the adoption of innovative technologies like hybrid propulsion systems. The development of lightweight materials and the integration of smart sensors for predictive maintenance present further avenues for growth. The increasing demand for environmentally friendly solutions opens opportunities for propellers optimized for alternative fuels like LNG and hydrogen.
Leading Players in the Controllable Pitch Marine Propeller Market
- Rolls Royce
- Niigata Power Systems
- Caterpillar Inc
- Kawasaki Group
- Brunvoll AS
- Wärtsilä
Key Developments in Controllable Pitch Marine Propeller Market Industry
- March 2022: Wärtsilä signed a long-term service agreement with Brittany Ferries for its new LNG-fuelled ferry, highlighting the growing adoption of LNG and the importance of service agreements in the market.
- December 2020: China State Shipbuilding Corporation (CSSC) received an order for four of the world's largest containerships, demonstrating the strong demand for large-capacity vessels and subsequently, efficient propulsion systems.
Strategic Outlook for Controllable Pitch Marine Propeller Market
The controllable pitch marine propeller market is poised for sustained growth, driven by technological advancements, stringent environmental regulations, and the expanding global shipping industry. Opportunities exist in developing advanced propeller designs, integrating smart technologies, and expanding into new markets. Focusing on innovation, efficiency improvements, and sustainable solutions will be key to success in this dynamic market.
Controllable Pitch Marine Propeller Market Segmentation
-
1. Number Of Blades
- 1.1. Two and Three Blades
- 1.2. Four Blades
- 1.3. Five Blades
-
2. Application
- 2.1. passenger Vessels
- 2.2. Commercial/cargo Vessels
-
3. Ship Type
- 3.1. Tug And Push Boats
- 3.2. Ferries
- 3.3. Ice Breakers
- 3.4. Other Ship Type
Controllable Pitch Marine Propeller Market Segmentation By Geography
-
1. North America
- 1.1. US
- 1.2. Canada
- 1.3. Rest of North America
-
2. Europe
- 2.1. Germany
- 2.2. UK
- 2.3. France
- 2.4. Russia
- 2.5. Spain
- 2.6. Rest of Europe
-
3. Asia Pacific
- 3.1. India
- 3.2. China
- 3.3. Japan
- 3.4. South Korea
- 3.5. Rest of Asia Pacific
-
4. Rest of the World
- 4.1. South America
- 4.2. Middle East and Africa
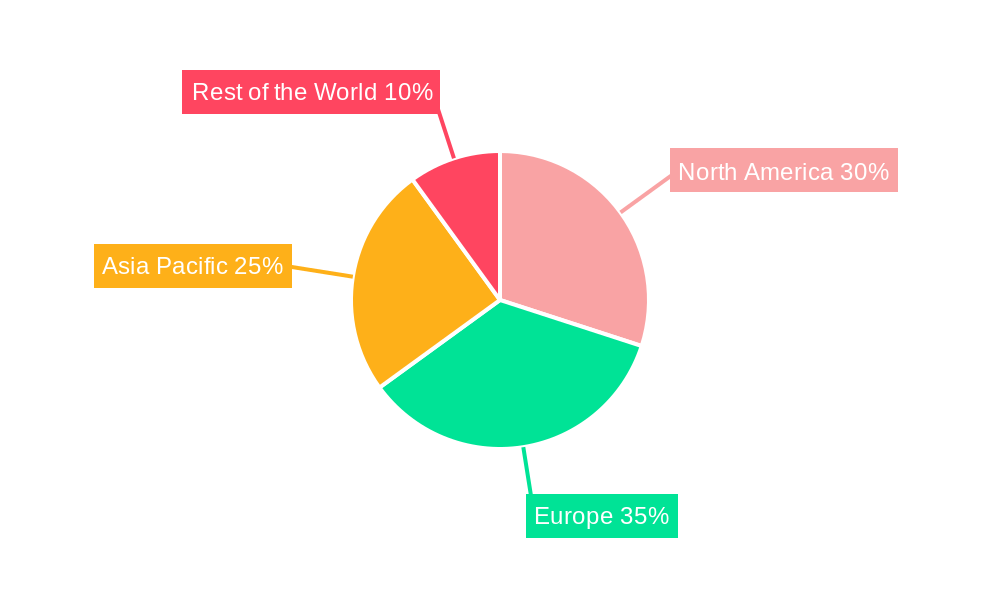
Controllable Pitch Marine Propeller Market Regional Market Share
Geographic Coverage of Controllable Pitch Marine Propeller Market
Controllable Pitch Marine Propeller Market REPORT HIGHLIGHTS
| Aspects | Details |
|---|---|
| Study Period | 2020-2034 |
| Base Year | 2025 |
| Estimated Year | 2026 |
| Forecast Period | 2026-2034 |
| Historical Period | 2020-2025 |
| Growth Rate | CAGR of 8.3% from 2020-2034 |
| Segmentation |
|
Table of Contents
- 1. Introduction
- 1.1. Research Scope
- 1.2. Market Segmentation
- 1.3. Research Objective
- 1.4. Definitions and Assumptions
- 2. Executive Summary
- 2.1. Market Snapshot
- 3. Market Dynamics
- 3.1. Market Drivers
- 3.2. Market Restrains
- 3.3. Market Trends
- 3.4. Market Opportunities
- 4. Market Factor Analysis
- 4.1. Porters Five Forces
- 4.1.1. Bargaining Power of Suppliers
- 4.1.2. Bargaining Power of Buyers
- 4.1.3. Threat of New Entrants
- 4.1.4. Threat of Substitutes
- 4.1.5. Competitive Rivalry
- 4.2. PESTEL analysis
- 4.3. BCG Analysis
- 4.3.1. Stars (High Growth, High Market Share)
- 4.3.2. Cash Cows (Low Growth, High Market Share)
- 4.3.3. Question Mark (High Growth, Low Market Share)
- 4.3.4. Dogs (Low Growth, Low Market Share)
- 4.4. Ansoff Matrix Analysis
- 4.5. Supply Chain Analysis
- 4.6. Regulatory Landscape
- 4.7. Current Market Potential and Opportunity Assessment (TAM–SAM–SOM Framework)
- 4.8. RAX Analyst Note
- 4.1. Porters Five Forces
- 5. Market Analysis, Insights and Forecast 2021-2033
- 5.1. Market Analysis, Insights and Forecast - by Number Of Blades
- 5.1.1. Two and Three Blades
- 5.1.2. Four Blades
- 5.1.3. Five Blades
- 5.2. Market Analysis, Insights and Forecast - by Application
- 5.2.1. passenger Vessels
- 5.2.2. Commercial/cargo Vessels
- 5.3. Market Analysis, Insights and Forecast - by Ship Type
- 5.3.1. Tug And Push Boats
- 5.3.2. Ferries
- 5.3.3. Ice Breakers
- 5.3.4. Other Ship Type
- 5.4. Market Analysis, Insights and Forecast - by Region
- 5.4.1. North America
- 5.4.2. Europe
- 5.4.3. Asia Pacific
- 5.4.4. Rest of the World
- 5.1. Market Analysis, Insights and Forecast - by Number Of Blades
- 6. Global Controllable Pitch Marine Propeller Market Analysis, Insights and Forecast, 2021-2033
- 6.1. Market Analysis, Insights and Forecast - by Number Of Blades
- 6.1.1. Two and Three Blades
- 6.1.2. Four Blades
- 6.1.3. Five Blades
- 6.2. Market Analysis, Insights and Forecast - by Application
- 6.2.1. passenger Vessels
- 6.2.2. Commercial/cargo Vessels
- 6.3. Market Analysis, Insights and Forecast - by Ship Type
- 6.3.1. Tug And Push Boats
- 6.3.2. Ferries
- 6.3.3. Ice Breakers
- 6.3.4. Other Ship Type
- 6.1. Market Analysis, Insights and Forecast - by Number Of Blades
- 7. North America Controllable Pitch Marine Propeller Market Analysis, Insights and Forecast, 2020-2032
- 7.1. Market Analysis, Insights and Forecast - by Number Of Blades
- 7.1.1. Two and Three Blades
- 7.1.2. Four Blades
- 7.1.3. Five Blades
- 7.2. Market Analysis, Insights and Forecast - by Application
- 7.2.1. passenger Vessels
- 7.2.2. Commercial/cargo Vessels
- 7.3. Market Analysis, Insights and Forecast - by Ship Type
- 7.3.1. Tug And Push Boats
- 7.3.2. Ferries
- 7.3.3. Ice Breakers
- 7.3.4. Other Ship Type
- 7.1. Market Analysis, Insights and Forecast - by Number Of Blades
- 8. Europe Controllable Pitch Marine Propeller Market Analysis, Insights and Forecast, 2020-2032
- 8.1. Market Analysis, Insights and Forecast - by Number Of Blades
- 8.1.1. Two and Three Blades
- 8.1.2. Four Blades
- 8.1.3. Five Blades
- 8.2. Market Analysis, Insights and Forecast - by Application
- 8.2.1. passenger Vessels
- 8.2.2. Commercial/cargo Vessels
- 8.3. Market Analysis, Insights and Forecast - by Ship Type
- 8.3.1. Tug And Push Boats
- 8.3.2. Ferries
- 8.3.3. Ice Breakers
- 8.3.4. Other Ship Type
- 8.1. Market Analysis, Insights and Forecast - by Number Of Blades
- 9. Asia Pacific Controllable Pitch Marine Propeller Market Analysis, Insights and Forecast, 2020-2032
- 9.1. Market Analysis, Insights and Forecast - by Number Of Blades
- 9.1.1. Two and Three Blades
- 9.1.2. Four Blades
- 9.1.3. Five Blades
- 9.2. Market Analysis, Insights and Forecast - by Application
- 9.2.1. passenger Vessels
- 9.2.2. Commercial/cargo Vessels
- 9.3. Market Analysis, Insights and Forecast - by Ship Type
- 9.3.1. Tug And Push Boats
- 9.3.2. Ferries
- 9.3.3. Ice Breakers
- 9.3.4. Other Ship Type
- 9.1. Market Analysis, Insights and Forecast - by Number Of Blades
- 10. Rest of the World Controllable Pitch Marine Propeller Market Analysis, Insights and Forecast, 2020-2032
- 10.1. Market Analysis, Insights and Forecast - by Number Of Blades
- 10.1.1. Two and Three Blades
- 10.1.2. Four Blades
- 10.1.3. Five Blades
- 10.2. Market Analysis, Insights and Forecast - by Application
- 10.2.1. passenger Vessels
- 10.2.2. Commercial/cargo Vessels
- 10.3. Market Analysis, Insights and Forecast - by Ship Type
- 10.3.1. Tug And Push Boats
- 10.3.2. Ferries
- 10.3.3. Ice Breakers
- 10.3.4. Other Ship Type
- 10.1. Market Analysis, Insights and Forecast - by Number Of Blades
- 11. Competitive Analysis
- 11.1. Company Profiles
- 11.1.1 Rolls Royce
- 11.1.1.1. Company Overview
- 11.1.1.2. Products
- 11.1.1.3. Company Financials
- 11.1.1.4. SWOT Analysis
- 11.1.2 Niigata Power Systems
- 11.1.2.1. Company Overview
- 11.1.2.2. Products
- 11.1.2.3. Company Financials
- 11.1.2.4. SWOT Analysis
- 11.1.3 Caterpillar Inc
- 11.1.3.1. Company Overview
- 11.1.3.2. Products
- 11.1.3.3. Company Financials
- 11.1.3.4. SWOT Analysis
- 11.1.4 Kawasaki Group
- 11.1.4.1. Company Overview
- 11.1.4.2. Products
- 11.1.4.3. Company Financials
- 11.1.4.4. SWOT Analysis
- 11.1.5 Brunvoll AS
- 11.1.5.1. Company Overview
- 11.1.5.2. Products
- 11.1.5.3. Company Financials
- 11.1.5.4. SWOT Analysis
- 11.1.6 Wartsil
- 11.1.6.1. Company Overview
- 11.1.6.2. Products
- 11.1.6.3. Company Financials
- 11.1.6.4. SWOT Analysis
- 11.1.1 Rolls Royce
- 11.2. Market Entropy
- 11.2.1 Company's Key Areas Served
- 11.2.2 Recent Developments
- 11.3. Company Market Share Analysis 2025
- 11.3.1 Top 5 Companies Market Share Analysis
- 11.3.2 Top 3 Companies Market Share Analysis
- 11.4. List of Potential Customers
- 12. Research Methodology
List of Figures
- Figure 1: Global Controllable Pitch Marine Propeller Market Revenue Breakdown (billion, %) by Region 2025 & 2033
- Figure 2: North America Controllable Pitch Marine Propeller Market Revenue (billion), by Number Of Blades 2025 & 2033
- Figure 3: North America Controllable Pitch Marine Propeller Market Revenue Share (%), by Number Of Blades 2025 & 2033
- Figure 4: North America Controllable Pitch Marine Propeller Market Revenue (billion), by Application 2025 & 2033
- Figure 5: North America Controllable Pitch Marine Propeller Market Revenue Share (%), by Application 2025 & 2033
- Figure 6: North America Controllable Pitch Marine Propeller Market Revenue (billion), by Ship Type 2025 & 2033
- Figure 7: North America Controllable Pitch Marine Propeller Market Revenue Share (%), by Ship Type 2025 & 2033
- Figure 8: North America Controllable Pitch Marine Propeller Market Revenue (billion), by Country 2025 & 2033
- Figure 9: North America Controllable Pitch Marine Propeller Market Revenue Share (%), by Country 2025 & 2033
- Figure 10: Europe Controllable Pitch Marine Propeller Market Revenue (billion), by Number Of Blades 2025 & 2033
- Figure 11: Europe Controllable Pitch Marine Propeller Market Revenue Share (%), by Number Of Blades 2025 & 2033
- Figure 12: Europe Controllable Pitch Marine Propeller Market Revenue (billion), by Application 2025 & 2033
- Figure 13: Europe Controllable Pitch Marine Propeller Market Revenue Share (%), by Application 2025 & 2033
- Figure 14: Europe Controllable Pitch Marine Propeller Market Revenue (billion), by Ship Type 2025 & 2033
- Figure 15: Europe Controllable Pitch Marine Propeller Market Revenue Share (%), by Ship Type 2025 & 2033
- Figure 16: Europe Controllable Pitch Marine Propeller Market Revenue (billion), by Country 2025 & 2033
- Figure 17: Europe Controllable Pitch Marine Propeller Market Revenue Share (%), by Country 2025 & 2033
- Figure 18: Asia Pacific Controllable Pitch Marine Propeller Market Revenue (billion), by Number Of Blades 2025 & 2033
- Figure 19: Asia Pacific Controllable Pitch Marine Propeller Market Revenue Share (%), by Number Of Blades 2025 & 2033
- Figure 20: Asia Pacific Controllable Pitch Marine Propeller Market Revenue (billion), by Application 2025 & 2033
- Figure 21: Asia Pacific Controllable Pitch Marine Propeller Market Revenue Share (%), by Application 2025 & 2033
- Figure 22: Asia Pacific Controllable Pitch Marine Propeller Market Revenue (billion), by Ship Type 2025 & 2033
- Figure 23: Asia Pacific Controllable Pitch Marine Propeller Market Revenue Share (%), by Ship Type 2025 & 2033
- Figure 24: Asia Pacific Controllable Pitch Marine Propeller Market Revenue (billion), by Country 2025 & 2033
- Figure 25: Asia Pacific Controllable Pitch Marine Propeller Market Revenue Share (%), by Country 2025 & 2033
- Figure 26: Rest of the World Controllable Pitch Marine Propeller Market Revenue (billion), by Number Of Blades 2025 & 2033
- Figure 27: Rest of the World Controllable Pitch Marine Propeller Market Revenue Share (%), by Number Of Blades 2025 & 2033
- Figure 28: Rest of the World Controllable Pitch Marine Propeller Market Revenue (billion), by Application 2025 & 2033
- Figure 29: Rest of the World Controllable Pitch Marine Propeller Market Revenue Share (%), by Application 2025 & 2033
- Figure 30: Rest of the World Controllable Pitch Marine Propeller Market Revenue (billion), by Ship Type 2025 & 2033
- Figure 31: Rest of the World Controllable Pitch Marine Propeller Market Revenue Share (%), by Ship Type 2025 & 2033
- Figure 32: Rest of the World Controllable Pitch Marine Propeller Market Revenue (billion), by Country 2025 & 2033
- Figure 33: Rest of the World Controllable Pitch Marine Propeller Market Revenue Share (%), by Country 2025 & 2033
List of Tables
- Table 1: Global Controllable Pitch Marine Propeller Market Revenue billion Forecast, by Number Of Blades 2020 & 2033
- Table 2: Global Controllable Pitch Marine Propeller Market Revenue billion Forecast, by Application 2020 & 2033
- Table 3: Global Controllable Pitch Marine Propeller Market Revenue billion Forecast, by Ship Type 2020 & 2033
- Table 4: Global Controllable Pitch Marine Propeller Market Revenue billion Forecast, by Region 2020 & 2033
- Table 5: Global Controllable Pitch Marine Propeller Market Revenue billion Forecast, by Number Of Blades 2020 & 2033
- Table 6: Global Controllable Pitch Marine Propeller Market Revenue billion Forecast, by Application 2020 & 2033
- Table 7: Global Controllable Pitch Marine Propeller Market Revenue billion Forecast, by Ship Type 2020 & 2033
- Table 8: Global Controllable Pitch Marine Propeller Market Revenue billion Forecast, by Country 2020 & 2033
- Table 9: US Controllable Pitch Marine Propeller Market Revenue (billion) Forecast, by Application 2020 & 2033
- Table 10: Canada Controllable Pitch Marine Propeller Market Revenue (billion) Forecast, by Application 2020 & 2033
- Table 11: Rest of North America Controllable Pitch Marine Propeller Market Revenue (billion) Forecast, by Application 2020 & 2033
- Table 12: Global Controllable Pitch Marine Propeller Market Revenue billion Forecast, by Number Of Blades 2020 & 2033
- Table 13: Global Controllable Pitch Marine Propeller Market Revenue billion Forecast, by Application 2020 & 2033
- Table 14: Global Controllable Pitch Marine Propeller Market Revenue billion Forecast, by Ship Type 2020 & 2033
- Table 15: Global Controllable Pitch Marine Propeller Market Revenue billion Forecast, by Country 2020 & 2033
- Table 16: Germany Controllable Pitch Marine Propeller Market Revenue (billion) Forecast, by Application 2020 & 2033
- Table 17: UK Controllable Pitch Marine Propeller Market Revenue (billion) Forecast, by Application 2020 & 2033
- Table 18: France Controllable Pitch Marine Propeller Market Revenue (billion) Forecast, by Application 2020 & 2033
- Table 19: Russia Controllable Pitch Marine Propeller Market Revenue (billion) Forecast, by Application 2020 & 2033
- Table 20: Spain Controllable Pitch Marine Propeller Market Revenue (billion) Forecast, by Application 2020 & 2033
- Table 21: Rest of Europe Controllable Pitch Marine Propeller Market Revenue (billion) Forecast, by Application 2020 & 2033
- Table 22: Global Controllable Pitch Marine Propeller Market Revenue billion Forecast, by Number Of Blades 2020 & 2033
- Table 23: Global Controllable Pitch Marine Propeller Market Revenue billion Forecast, by Application 2020 & 2033
- Table 24: Global Controllable Pitch Marine Propeller Market Revenue billion Forecast, by Ship Type 2020 & 2033
- Table 25: Global Controllable Pitch Marine Propeller Market Revenue billion Forecast, by Country 2020 & 2033
- Table 26: India Controllable Pitch Marine Propeller Market Revenue (billion) Forecast, by Application 2020 & 2033
- Table 27: China Controllable Pitch Marine Propeller Market Revenue (billion) Forecast, by Application 2020 & 2033
- Table 28: Japan Controllable Pitch Marine Propeller Market Revenue (billion) Forecast, by Application 2020 & 2033
- Table 29: South Korea Controllable Pitch Marine Propeller Market Revenue (billion) Forecast, by Application 2020 & 2033
- Table 30: Rest of Asia Pacific Controllable Pitch Marine Propeller Market Revenue (billion) Forecast, by Application 2020 & 2033
- Table 31: Global Controllable Pitch Marine Propeller Market Revenue billion Forecast, by Number Of Blades 2020 & 2033
- Table 32: Global Controllable Pitch Marine Propeller Market Revenue billion Forecast, by Application 2020 & 2033
- Table 33: Global Controllable Pitch Marine Propeller Market Revenue billion Forecast, by Ship Type 2020 & 2033
- Table 34: Global Controllable Pitch Marine Propeller Market Revenue billion Forecast, by Country 2020 & 2033
- Table 35: South America Controllable Pitch Marine Propeller Market Revenue (billion) Forecast, by Application 2020 & 2033
- Table 36: Middle East and Africa Controllable Pitch Marine Propeller Market Revenue (billion) Forecast, by Application 2020 & 2033
Frequently Asked Questions
1. What is the projected Compound Annual Growth Rate (CAGR) of the Controllable Pitch Marine Propeller Market?
The projected CAGR is approximately 8.3%.
2. Which companies are prominent players in the Controllable Pitch Marine Propeller Market?
Key companies in the market include Rolls Royce, Niigata Power Systems, Caterpillar Inc, Kawasaki Group, Brunvoll AS, Wartsil.
3. What are the main segments of the Controllable Pitch Marine Propeller Market?
The market segments include Number Of Blades, Application, Ship Type.
4. Can you provide details about the market size?
The market size is estimated to be USD 4.85 billion as of 2022.
5. What are some drivers contributing to market growth?
Rising Tourism Activity Drive Demand in the Market.
6. What are the notable trends driving market growth?
Controllable Pitch Propellers Continue to Witness Growth.
7. Are there any restraints impacting market growth?
Lack of Government Framework for the Usage of RVs.
8. Can you provide examples of recent developments in the market?
In March 2022, Wärtsilä signed a long-term service agreement with Brittany Ferries to support a new LNG-fuelled ferry. The technology group Wärtsilä will provide technical support via a long-term service agreement for its broad scope of solutions installed on Brittany Ferries' latest RoPax vessel, the 'Salamanca.' The 10-year agreement was signed in December 2021. The ferry will be inaugurated on March 25 and will make its first commercial sailing from Portsmouth, U.K., to Bilbao, Spain, on March 27.
9. What pricing options are available for accessing the report?
Pricing options include single-user, multi-user, and enterprise licenses priced at USD 4750, USD 5250, and USD 8750 respectively.
10. Is the market size provided in terms of value or volume?
The market size is provided in terms of value, measured in billion.
11. Are there any specific market keywords associated with the report?
Yes, the market keyword associated with the report is "Controllable Pitch Marine Propeller Market," which aids in identifying and referencing the specific market segment covered.
12. How do I determine which pricing option suits my needs best?
The pricing options vary based on user requirements and access needs. Individual users may opt for single-user licenses, while businesses requiring broader access may choose multi-user or enterprise licenses for cost-effective access to the report.
13. Are there any additional resources or data provided in the Controllable Pitch Marine Propeller Market report?
While the report offers comprehensive insights, it's advisable to review the specific contents or supplementary materials provided to ascertain if additional resources or data are available.
14. How can I stay updated on further developments or reports in the Controllable Pitch Marine Propeller Market?
To stay informed about further developments, trends, and reports in the Controllable Pitch Marine Propeller Market, consider subscribing to industry newsletters, following relevant companies and organizations, or regularly checking reputable industry news sources and publications.
Methodology
Step 1 - Identification of Relevant Samples Size from Population Database


Step 2 - Approaches for Defining Global Market Size (Value, Volume* & Price*)

Note*: In applicable scenarios
Step 3 - Data Sources
Primary Research
- Web Analytics
- Survey Reports
- Research Institute
- Latest Research Reports
- Opinion Leaders
Secondary Research
- Annual Reports
- White Paper
- Latest Press Release
- Industry Association
- Paid Database
- Investor Presentations

Step 4 - Data Triangulation
Involves using different sources of information in order to increase the validity of a study
These sources are likely to be stakeholders in a program - participants, other researchers, program staff, other community members, and so on.
Then we put all data in single framework & apply various statistical tools to find out the dynamic on the market.
During the analysis stage, feedback from the stakeholder groups would be compared to determine areas of agreement as well as areas of divergence

