
Key Insights
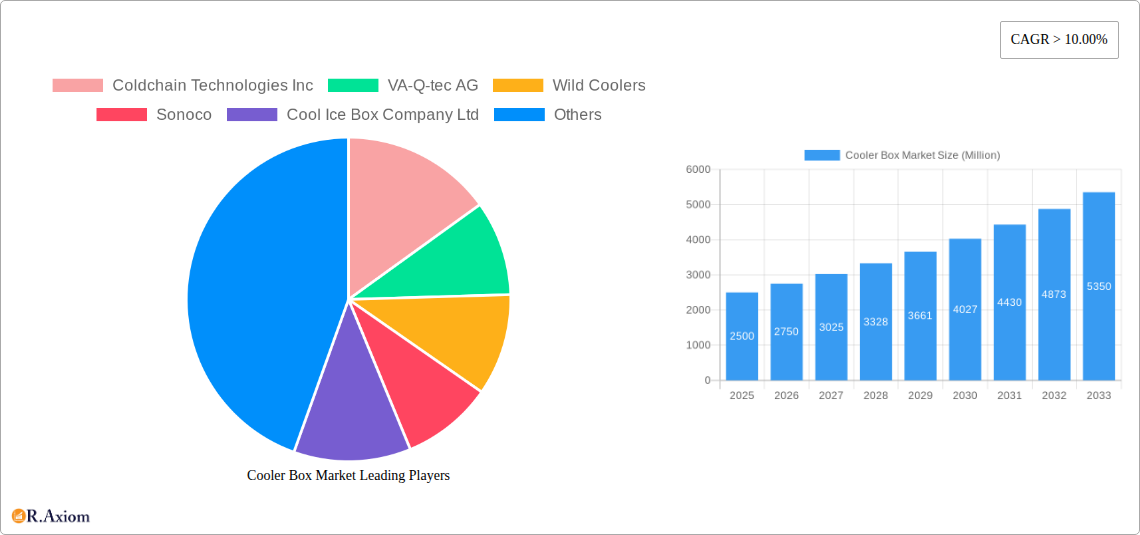
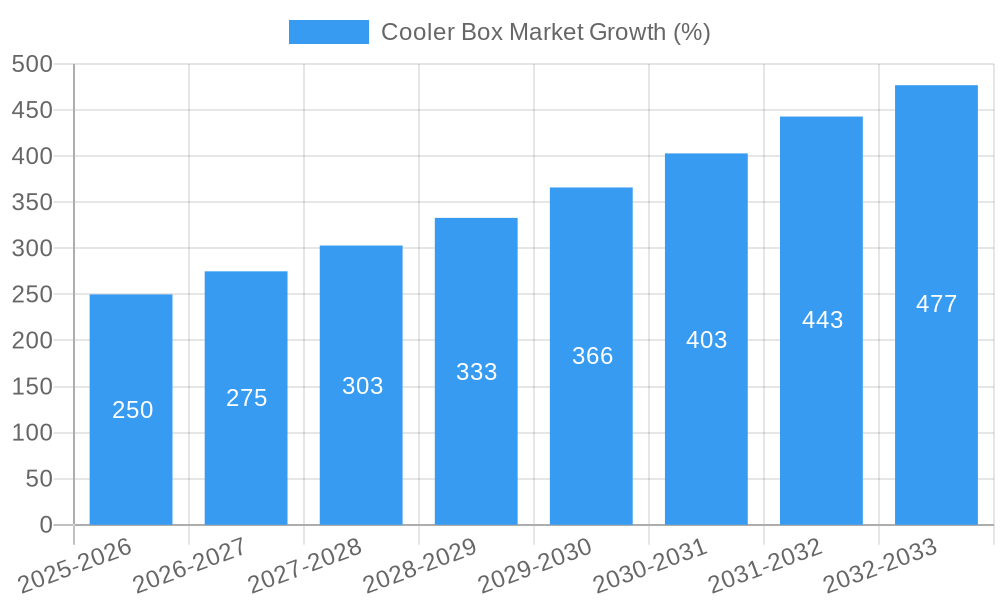
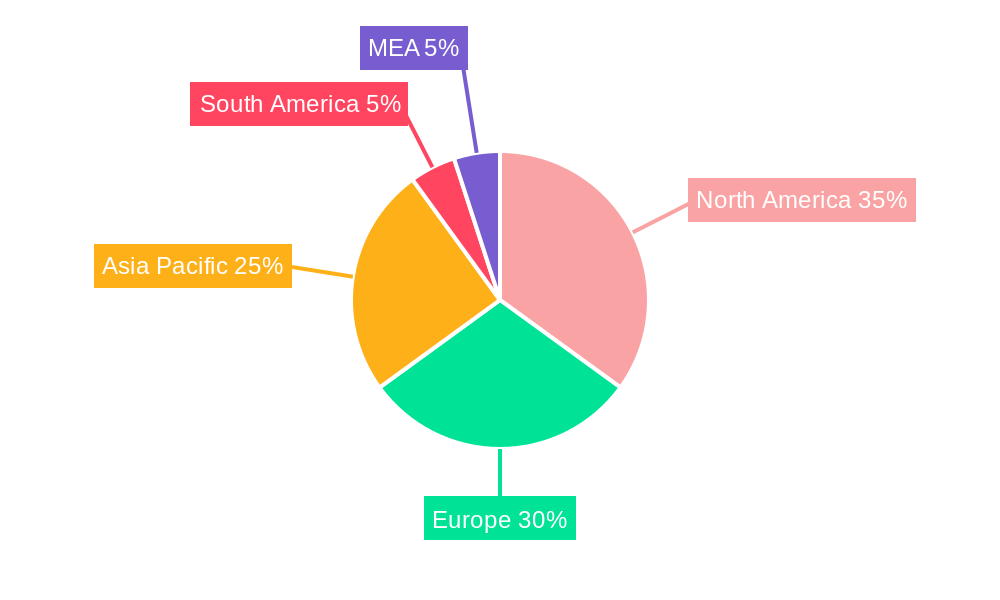
The cooler box market, valued at approximately $XX million in 2025, is experiencing robust growth, exhibiting a Compound Annual Growth Rate (CAGR) exceeding 10% from 2025 to 2033. This expansion is driven by several key factors. The burgeoning food and beverage industry, particularly within the expanding quick-service restaurant and delivery segments, necessitates efficient cold-chain solutions, fueling demand for cooler boxes. Furthermore, the growing popularity of outdoor recreational activities like camping, fishing, and tailgating is significantly boosting consumer demand. The pharmaceutical sector also contributes substantially, requiring reliable temperature-controlled transport for sensitive medications and vaccines. Market segmentation reveals a strong preference for reusable cooler boxes, driven by environmental concerns and cost-effectiveness in the long run. PU foam and Expanded Polystyrene remain dominant raw materials due to their cost-effectiveness and insulation properties. However, the market is witnessing a gradual shift towards more sustainable alternatives like Expanded Polypropylene, driven by increasing environmental regulations and consumer awareness. Geographic distribution shows a strong concentration in North America and Europe, largely due to established cold-chain infrastructure and high disposable incomes. However, rapidly developing economies in Asia-Pacific, particularly China and India, are expected to witness substantial growth in the coming years, providing lucrative expansion opportunities for existing and new players.
Competition in the cooler box market is intense, with established players like Coldchain Technologies Inc, VA-Q-tec AG, and Sonoco competing against smaller, specialized brands. The market is characterized by both price competition and differentiation strategies focusing on innovation in materials, design, and functionality. The increasing focus on sustainability and the incorporation of smart technology, such as temperature monitoring and tracking systems, are emerging trends shaping the competitive landscape. While the market faces restraints such as fluctuating raw material prices and potential economic downturns, the overall growth trajectory remains positive, driven by underlying demand from multiple sectors and a growing consumer preference for convenient and reliable cold-chain solutions. The continued expansion of e-commerce and the rise of delivery services will further propel market growth throughout the forecast period.
Cooler Box Market: A Comprehensive Report (2019-2033)
This in-depth report provides a comprehensive analysis of the global Cooler Box Market, offering valuable insights for stakeholders across the value chain. The study covers the period from 2019 to 2033, with a focus on the forecast period of 2025-2033 and a base year of 2025. The report uses a detailed segmentation by type (Reusable, Disposable), raw material (PU Foam, Expanded Polystyrene, Extruded Polystyrene, Expanded Polypropylene, Others), and end-user (Pharmaceuticals, Food & Beverages, Others), enabling a granular understanding of market dynamics. Key players such as Coldchain Technologies Inc, VA-Q-tec AG, Wild Coolers, Sonoco, Cool Ice Box Company Ltd, Blowkings, Sofrigam Group, FEURER GmbH, Azenta Inc (B Medical Systems), CSafe Global, Igloo, and Bison Coolers are analyzed for their market positioning and strategic initiatives. The report's findings are supported by robust data analysis, market sizing, and future projections. The total market size is predicted to reach xx Million by 2033, demonstrating significant growth potential.
Cooler Box Market Concentration & Innovation
This section analyzes the competitive landscape of the cooler box market, assessing market concentration, innovation drivers, regulatory influences, product substitution, and M&A activities. The market is characterized by a mix of large multinational corporations and specialized manufacturers, leading to a moderately concentrated landscape. Market share data for key players will be provided, along with an analysis of their competitive strategies. The report will quantify the market share of the top 5 players, revealing the degree of market concentration. Innovation is driven by the need for improved thermal performance, sustainable materials, and enhanced logistics solutions, particularly within the pharmaceutical sector. Regulatory frameworks concerning food safety and environmental regulations are significant influencing factors. Furthermore, the report delves into the impact of M&A activity, analyzing deal values and their implications for market consolidation and technological advancements. Recent examples of M&A deals, their size, and the strategic rationale behind them will be highlighted, contributing to a holistic picture of market dynamics.
- Market Concentration: xx% held by top 5 players (2025).
- Innovation Drivers: Improved thermal efficiency, sustainable materials, traceability solutions.
- Regulatory Frameworks: Food safety standards, environmental regulations.
- M&A Activity: Analysis of deal values and strategic implications (2019-2024).
Cooler Box Market Industry Trends & Insights
This section explores the key trends shaping the cooler box market, including growth drivers, technological disruptions, consumer preferences, and competitive dynamics. The global cooler box market is expected to witness a CAGR of xx% during the forecast period (2025-2033), driven by rising demand from the food and beverage and pharmaceutical industries. Technological advancements in insulation materials and cooling technologies are enabling more efficient and sustainable cooler boxes. Changing consumer preferences towards eco-friendly and reusable products are also impacting market dynamics. The report analyzes the market penetration of reusable cooler boxes and assesses the competitive landscape, identifying key success factors. The competitive dynamics are influenced by factors like pricing strategies, product innovation, and distribution networks.
Dominant Markets & Segments in Cooler Box Market
This section identifies the leading regions, countries, and segments within the cooler box market. The report will pinpoint the dominant region, which is likely to be [Region Name], due to factors such as high demand for temperature-controlled transport in [Industry segment], robust economic growth, and well-established cold chain infrastructure.
- Key Drivers (Dominant Region):
- Strong economic growth
- Expanding cold chain infrastructure
- High demand from [Industry segment]
- Dominant Segments: The report will highlight the dominant segments based on type (Reusable/Disposable), raw material, and end-user, providing detailed analysis of their market share and growth drivers. The analysis will consider factors such as cost, performance, and environmental concerns.
Cooler Box Market Product Developments
Recent product innovations in the cooler box market focus on improved insulation, enhanced durability, and more sustainable materials. The development of innovative cooling technologies, such as phase-change materials and advanced insulation techniques, is leading to more energy-efficient and reliable cooler boxes. These advancements are improving the performance and cost-effectiveness of cooler boxes, enhancing their market fit across various end-user segments. Market competitiveness is driven by these product enhancements and improvements in performance metrics such as temperature stability and longevity.
Report Scope & Segmentation Analysis
This report segments the cooler box market based on type (Reusable, Disposable), raw material (PU Foam, Expanded Polystyrene, Extruded Polystyrene, Expanded Polypropylene, Others), and end-user (Pharmaceuticals, Food & Beverages, Others). Each segment's market size, growth projections, and competitive dynamics will be analyzed, considering factors such as material costs, manufacturing processes, and end-user requirements. Growth projections for each segment will be provided for the forecast period (2025-2033).
Key Drivers of Cooler Box Market Growth
The growth of the cooler box market is driven by several key factors. The rising demand for temperature-sensitive products in the food and beverage and pharmaceutical industries necessitates efficient and reliable cooling solutions. Technological advancements in insulation materials and cooling technologies are enhancing the performance and sustainability of cooler boxes. Favorable government regulations and incentives promoting energy efficiency and sustainable packaging are further fueling market growth.
Challenges in the Cooler Box Market Sector
The cooler box market faces challenges such as fluctuations in raw material prices, environmental concerns related to the use of certain materials, and intense competition from existing and emerging players. Supply chain disruptions can also affect production and delivery timelines, impacting market stability. Moreover, stringent regulatory requirements for food safety and environmental protection pose compliance challenges for manufacturers.
Emerging Opportunities in Cooler Box Market
Emerging opportunities in the cooler box market include the development of eco-friendly and sustainable materials, the integration of advanced technologies such as smart sensors for temperature monitoring, and the expansion into new applications, such as personal medical transport. The growing demand for cold chain logistics in developing economies presents a significant market opportunity for cooler box manufacturers.
Leading Players in the Cooler Box Market Market
- Coldchain Technologies Inc
- VA-Q-tec AG
- Wild Coolers
- Sonoco
- Cool Ice Box Company Ltd
- Blowkings
- Sofrigam Group
- FEURER GmbH
- Azenta Inc (B Medical Systems)
- CSafe Global
- Igloo
- Bison Coolers
Key Developments in Cooler Box Market Industry
- November 2022: Sonoco plans to expand Sonopost cornerpost manufacturing in Bursa, Turkey. This expansion reflects growing demand and aims to enhance its manufacturing capabilities.
- October 2022: Azenta Inc. acquires B Medical Systems, strengthening its position in temperature-controlled storage and transportation. This acquisition signifies a strategic move to expand its market reach and capabilities.
- October 2022: CSafe Global launches its new advanced reusable pallet shipper, CSafeAPS. This launch demonstrates ongoing innovation to meet the evolving needs of the pharmaceutical industry.
Strategic Outlook for Cooler Box Market Market
The cooler box market is poised for significant growth, driven by ongoing innovation in materials, cooling technologies, and demand from key sectors. The expansion of the cold chain logistics industry, particularly in emerging markets, presents considerable opportunity. The increasing focus on sustainability and eco-friendly solutions will further shape market developments. Strategic collaborations, acquisitions, and investments in research and development will play crucial roles in shaping the future of the market.
Cooler Box Market Segmentation
-
1. Type
- 1.1. Reusable
- 1.2. Disposable
-
2. Raw Material
- 2.1. PU Foam
- 2.2. Expanded Polystyrene
- 2.3. Extruded Polystyrene
- 2.4. Expanded Polypropylene
- 2.5. Others
-
3. End User
- 3.1. Pharmaceuticals
- 3.2. Food & Beverages
- 3.3. Others
Cooler Box Market Segmentation By Geography
- 1. North America
- 2. Europe
- 3. Asia Pacific
- 4. South America
- 5. Middle East and Africa
Cooler Box Market REPORT HIGHLIGHTS
| Aspects | Details |
|---|---|
| Study Period | 2019-2033 |
| Base Year | 2024 |
| Estimated Year | 2025 |
| Forecast Period | 2025-2033 |
| Historical Period | 2019-2024 |
| Growth Rate | CAGR of > 10.00% from 2019-2033 |
| Segmentation |
|
Table of Contents
- 1. Introduction
- 1.1. Research Scope
- 1.2. Market Segmentation
- 1.3. Research Methodology
- 1.4. Definitions and Assumptions
- 2. Executive Summary
- 2.1. Introduction
- 3. Market Dynamics
- 3.1. Introduction
- 3.2. Market Drivers
- 3.2.1. Increasing Birth Rate Drives The Market; Rise In Disposable Income Of Parents Drives The Market
- 3.3. Market Restrains
- 3.3.1. Lack of Security Issues; Infrastructure and Space Limitations
- 3.4. Market Trends
- 3.4.1. The Reusable Segment Dominated the Market
- 4. Market Factor Analysis
- 4.1. Porters Five Forces
- 4.2. Supply/Value Chain
- 4.3. PESTEL analysis
- 4.4. Market Entropy
- 4.5. Patent/Trademark Analysis
- 5. Global Cooler Box Market Analysis, Insights and Forecast, 2019-2031
- 5.1. Market Analysis, Insights and Forecast - by Type
- 5.1.1. Reusable
- 5.1.2. Disposable
- 5.2. Market Analysis, Insights and Forecast - by Raw Material
- 5.2.1. PU Foam
- 5.2.2. Expanded Polystyrene
- 5.2.3. Extruded Polystyrene
- 5.2.4. Expanded Polypropylene
- 5.2.5. Others
- 5.3. Market Analysis, Insights and Forecast - by End User
- 5.3.1. Pharmaceuticals
- 5.3.2. Food & Beverages
- 5.3.3. Others
- 5.4. Market Analysis, Insights and Forecast - by Region
- 5.4.1. North America
- 5.4.2. Europe
- 5.4.3. Asia Pacific
- 5.4.4. South America
- 5.4.5. Middle East and Africa
- 5.1. Market Analysis, Insights and Forecast - by Type
- 6. North America Cooler Box Market Analysis, Insights and Forecast, 2019-2031
- 6.1. Market Analysis, Insights and Forecast - by Type
- 6.1.1. Reusable
- 6.1.2. Disposable
- 6.2. Market Analysis, Insights and Forecast - by Raw Material
- 6.2.1. PU Foam
- 6.2.2. Expanded Polystyrene
- 6.2.3. Extruded Polystyrene
- 6.2.4. Expanded Polypropylene
- 6.2.5. Others
- 6.3. Market Analysis, Insights and Forecast - by End User
- 6.3.1. Pharmaceuticals
- 6.3.2. Food & Beverages
- 6.3.3. Others
- 6.1. Market Analysis, Insights and Forecast - by Type
- 7. Europe Cooler Box Market Analysis, Insights and Forecast, 2019-2031
- 7.1. Market Analysis, Insights and Forecast - by Type
- 7.1.1. Reusable
- 7.1.2. Disposable
- 7.2. Market Analysis, Insights and Forecast - by Raw Material
- 7.2.1. PU Foam
- 7.2.2. Expanded Polystyrene
- 7.2.3. Extruded Polystyrene
- 7.2.4. Expanded Polypropylene
- 7.2.5. Others
- 7.3. Market Analysis, Insights and Forecast - by End User
- 7.3.1. Pharmaceuticals
- 7.3.2. Food & Beverages
- 7.3.3. Others
- 7.1. Market Analysis, Insights and Forecast - by Type
- 8. Asia Pacific Cooler Box Market Analysis, Insights and Forecast, 2019-2031
- 8.1. Market Analysis, Insights and Forecast - by Type
- 8.1.1. Reusable
- 8.1.2. Disposable
- 8.2. Market Analysis, Insights and Forecast - by Raw Material
- 8.2.1. PU Foam
- 8.2.2. Expanded Polystyrene
- 8.2.3. Extruded Polystyrene
- 8.2.4. Expanded Polypropylene
- 8.2.5. Others
- 8.3. Market Analysis, Insights and Forecast - by End User
- 8.3.1. Pharmaceuticals
- 8.3.2. Food & Beverages
- 8.3.3. Others
- 8.1. Market Analysis, Insights and Forecast - by Type
- 9. South America Cooler Box Market Analysis, Insights and Forecast, 2019-2031
- 9.1. Market Analysis, Insights and Forecast - by Type
- 9.1.1. Reusable
- 9.1.2. Disposable
- 9.2. Market Analysis, Insights and Forecast - by Raw Material
- 9.2.1. PU Foam
- 9.2.2. Expanded Polystyrene
- 9.2.3. Extruded Polystyrene
- 9.2.4. Expanded Polypropylene
- 9.2.5. Others
- 9.3. Market Analysis, Insights and Forecast - by End User
- 9.3.1. Pharmaceuticals
- 9.3.2. Food & Beverages
- 9.3.3. Others
- 9.1. Market Analysis, Insights and Forecast - by Type
- 10. Middle East and Africa Cooler Box Market Analysis, Insights and Forecast, 2019-2031
- 10.1. Market Analysis, Insights and Forecast - by Type
- 10.1.1. Reusable
- 10.1.2. Disposable
- 10.2. Market Analysis, Insights and Forecast - by Raw Material
- 10.2.1. PU Foam
- 10.2.2. Expanded Polystyrene
- 10.2.3. Extruded Polystyrene
- 10.2.4. Expanded Polypropylene
- 10.2.5. Others
- 10.3. Market Analysis, Insights and Forecast - by End User
- 10.3.1. Pharmaceuticals
- 10.3.2. Food & Beverages
- 10.3.3. Others
- 10.1. Market Analysis, Insights and Forecast - by Type
- 11. North America Cooler Box Market Analysis, Insights and Forecast, 2019-2031
- 11.1. Market Analysis, Insights and Forecast - By Country/Sub-region
- 11.1.1 United States
- 11.1.2 Canada
- 11.1.3 Mexico
- 12. Europe Cooler Box Market Analysis, Insights and Forecast, 2019-2031
- 12.1. Market Analysis, Insights and Forecast - By Country/Sub-region
- 12.1.1 Germany
- 12.1.2 United Kingdom
- 12.1.3 France
- 12.1.4 Spain
- 12.1.5 Italy
- 12.1.6 Spain
- 12.1.7 Belgium
- 12.1.8 Netherland
- 12.1.9 Nordics
- 12.1.10 Rest of Europe
- 13. Asia Pacific Cooler Box Market Analysis, Insights and Forecast, 2019-2031
- 13.1. Market Analysis, Insights and Forecast - By Country/Sub-region
- 13.1.1 China
- 13.1.2 Japan
- 13.1.3 India
- 13.1.4 South Korea
- 13.1.5 Southeast Asia
- 13.1.6 Australia
- 13.1.7 Indonesia
- 13.1.8 Phillipes
- 13.1.9 Singapore
- 13.1.10 Thailandc
- 13.1.11 Rest of Asia Pacific
- 14. South America Cooler Box Market Analysis, Insights and Forecast, 2019-2031
- 14.1. Market Analysis, Insights and Forecast - By Country/Sub-region
- 14.1.1 Brazil
- 14.1.2 Argentina
- 14.1.3 Peru
- 14.1.4 Chile
- 14.1.5 Colombia
- 14.1.6 Ecuador
- 14.1.7 Venezuela
- 14.1.8 Rest of South America
- 15. North America Cooler Box Market Analysis, Insights and Forecast, 2019-2031
- 15.1. Market Analysis, Insights and Forecast - By Country/Sub-region
- 15.1.1 United States
- 15.1.2 Canada
- 15.1.3 Mexico
- 16. MEA Cooler Box Market Analysis, Insights and Forecast, 2019-2031
- 16.1. Market Analysis, Insights and Forecast - By Country/Sub-region
- 16.1.1 United Arab Emirates
- 16.1.2 Saudi Arabia
- 16.1.3 South Africa
- 16.1.4 Rest of Middle East and Africa
- 17. Competitive Analysis
- 17.1. Global Market Share Analysis 2024
- 17.2. Company Profiles
- 17.2.1 Coldchain Technologies Inc
- 17.2.1.1. Overview
- 17.2.1.2. Products
- 17.2.1.3. SWOT Analysis
- 17.2.1.4. Recent Developments
- 17.2.1.5. Financials (Based on Availability)
- 17.2.2 VA-Q-tec AG
- 17.2.2.1. Overview
- 17.2.2.2. Products
- 17.2.2.3. SWOT Analysis
- 17.2.2.4. Recent Developments
- 17.2.2.5. Financials (Based on Availability)
- 17.2.3 Wild Coolers
- 17.2.3.1. Overview
- 17.2.3.2. Products
- 17.2.3.3. SWOT Analysis
- 17.2.3.4. Recent Developments
- 17.2.3.5. Financials (Based on Availability)
- 17.2.4 Sonoco
- 17.2.4.1. Overview
- 17.2.4.2. Products
- 17.2.4.3. SWOT Analysis
- 17.2.4.4. Recent Developments
- 17.2.4.5. Financials (Based on Availability)
- 17.2.5 Cool Ice Box Company Ltd
- 17.2.5.1. Overview
- 17.2.5.2. Products
- 17.2.5.3. SWOT Analysis
- 17.2.5.4. Recent Developments
- 17.2.5.5. Financials (Based on Availability)
- 17.2.6 Blowkings
- 17.2.6.1. Overview
- 17.2.6.2. Products
- 17.2.6.3. SWOT Analysis
- 17.2.6.4. Recent Developments
- 17.2.6.5. Financials (Based on Availability)
- 17.2.7 Sofrigam Group
- 17.2.7.1. Overview
- 17.2.7.2. Products
- 17.2.7.3. SWOT Analysis
- 17.2.7.4. Recent Developments
- 17.2.7.5. Financials (Based on Availability)
- 17.2.8 FEURER GmbH
- 17.2.8.1. Overview
- 17.2.8.2. Products
- 17.2.8.3. SWOT Analysis
- 17.2.8.4. Recent Developments
- 17.2.8.5. Financials (Based on Availability)
- 17.2.9 Azenta Inc ( B Medical Systems)
- 17.2.9.1. Overview
- 17.2.9.2. Products
- 17.2.9.3. SWOT Analysis
- 17.2.9.4. Recent Developments
- 17.2.9.5. Financials (Based on Availability)
- 17.2.10 CSafe Global
- 17.2.10.1. Overview
- 17.2.10.2. Products
- 17.2.10.3. SWOT Analysis
- 17.2.10.4. Recent Developments
- 17.2.10.5. Financials (Based on Availability)
- 17.2.11 Igloo
- 17.2.11.1. Overview
- 17.2.11.2. Products
- 17.2.11.3. SWOT Analysis
- 17.2.11.4. Recent Developments
- 17.2.11.5. Financials (Based on Availability)
- 17.2.12 Bison Coolers
- 17.2.12.1. Overview
- 17.2.12.2. Products
- 17.2.12.3. SWOT Analysis
- 17.2.12.4. Recent Developments
- 17.2.12.5. Financials (Based on Availability)
- 17.2.1 Coldchain Technologies Inc
List of Figures
- Figure 1: Global Cooler Box Market Revenue Breakdown (Million, %) by Region 2024 & 2032
- Figure 2: Global Cooler Box Market Volume Breakdown (K Unit, %) by Region 2024 & 2032
- Figure 3: North America Cooler Box Market Revenue (Million), by Country 2024 & 2032
- Figure 4: North America Cooler Box Market Volume (K Unit), by Country 2024 & 2032
- Figure 5: North America Cooler Box Market Revenue Share (%), by Country 2024 & 2032
- Figure 6: North America Cooler Box Market Volume Share (%), by Country 2024 & 2032
- Figure 7: Europe Cooler Box Market Revenue (Million), by Country 2024 & 2032
- Figure 8: Europe Cooler Box Market Volume (K Unit), by Country 2024 & 2032
- Figure 9: Europe Cooler Box Market Revenue Share (%), by Country 2024 & 2032
- Figure 10: Europe Cooler Box Market Volume Share (%), by Country 2024 & 2032
- Figure 11: Asia Pacific Cooler Box Market Revenue (Million), by Country 2024 & 2032
- Figure 12: Asia Pacific Cooler Box Market Volume (K Unit), by Country 2024 & 2032
- Figure 13: Asia Pacific Cooler Box Market Revenue Share (%), by Country 2024 & 2032
- Figure 14: Asia Pacific Cooler Box Market Volume Share (%), by Country 2024 & 2032
- Figure 15: South America Cooler Box Market Revenue (Million), by Country 2024 & 2032
- Figure 16: South America Cooler Box Market Volume (K Unit), by Country 2024 & 2032
- Figure 17: South America Cooler Box Market Revenue Share (%), by Country 2024 & 2032
- Figure 18: South America Cooler Box Market Volume Share (%), by Country 2024 & 2032
- Figure 19: North America Cooler Box Market Revenue (Million), by Country 2024 & 2032
- Figure 20: North America Cooler Box Market Volume (K Unit), by Country 2024 & 2032
- Figure 21: North America Cooler Box Market Revenue Share (%), by Country 2024 & 2032
- Figure 22: North America Cooler Box Market Volume Share (%), by Country 2024 & 2032
- Figure 23: MEA Cooler Box Market Revenue (Million), by Country 2024 & 2032
- Figure 24: MEA Cooler Box Market Volume (K Unit), by Country 2024 & 2032
- Figure 25: MEA Cooler Box Market Revenue Share (%), by Country 2024 & 2032
- Figure 26: MEA Cooler Box Market Volume Share (%), by Country 2024 & 2032
- Figure 27: North America Cooler Box Market Revenue (Million), by Type 2024 & 2032
- Figure 28: North America Cooler Box Market Volume (K Unit), by Type 2024 & 2032
- Figure 29: North America Cooler Box Market Revenue Share (%), by Type 2024 & 2032
- Figure 30: North America Cooler Box Market Volume Share (%), by Type 2024 & 2032
- Figure 31: North America Cooler Box Market Revenue (Million), by Raw Material 2024 & 2032
- Figure 32: North America Cooler Box Market Volume (K Unit), by Raw Material 2024 & 2032
- Figure 33: North America Cooler Box Market Revenue Share (%), by Raw Material 2024 & 2032
- Figure 34: North America Cooler Box Market Volume Share (%), by Raw Material 2024 & 2032
- Figure 35: North America Cooler Box Market Revenue (Million), by End User 2024 & 2032
- Figure 36: North America Cooler Box Market Volume (K Unit), by End User 2024 & 2032
- Figure 37: North America Cooler Box Market Revenue Share (%), by End User 2024 & 2032
- Figure 38: North America Cooler Box Market Volume Share (%), by End User 2024 & 2032
- Figure 39: North America Cooler Box Market Revenue (Million), by Country 2024 & 2032
- Figure 40: North America Cooler Box Market Volume (K Unit), by Country 2024 & 2032
- Figure 41: North America Cooler Box Market Revenue Share (%), by Country 2024 & 2032
- Figure 42: North America Cooler Box Market Volume Share (%), by Country 2024 & 2032
- Figure 43: Europe Cooler Box Market Revenue (Million), by Type 2024 & 2032
- Figure 44: Europe Cooler Box Market Volume (K Unit), by Type 2024 & 2032
- Figure 45: Europe Cooler Box Market Revenue Share (%), by Type 2024 & 2032
- Figure 46: Europe Cooler Box Market Volume Share (%), by Type 2024 & 2032
- Figure 47: Europe Cooler Box Market Revenue (Million), by Raw Material 2024 & 2032
- Figure 48: Europe Cooler Box Market Volume (K Unit), by Raw Material 2024 & 2032
- Figure 49: Europe Cooler Box Market Revenue Share (%), by Raw Material 2024 & 2032
- Figure 50: Europe Cooler Box Market Volume Share (%), by Raw Material 2024 & 2032
- Figure 51: Europe Cooler Box Market Revenue (Million), by End User 2024 & 2032
- Figure 52: Europe Cooler Box Market Volume (K Unit), by End User 2024 & 2032
- Figure 53: Europe Cooler Box Market Revenue Share (%), by End User 2024 & 2032
- Figure 54: Europe Cooler Box Market Volume Share (%), by End User 2024 & 2032
- Figure 55: Europe Cooler Box Market Revenue (Million), by Country 2024 & 2032
- Figure 56: Europe Cooler Box Market Volume (K Unit), by Country 2024 & 2032
- Figure 57: Europe Cooler Box Market Revenue Share (%), by Country 2024 & 2032
- Figure 58: Europe Cooler Box Market Volume Share (%), by Country 2024 & 2032
- Figure 59: Asia Pacific Cooler Box Market Revenue (Million), by Type 2024 & 2032
- Figure 60: Asia Pacific Cooler Box Market Volume (K Unit), by Type 2024 & 2032
- Figure 61: Asia Pacific Cooler Box Market Revenue Share (%), by Type 2024 & 2032
- Figure 62: Asia Pacific Cooler Box Market Volume Share (%), by Type 2024 & 2032
- Figure 63: Asia Pacific Cooler Box Market Revenue (Million), by Raw Material 2024 & 2032
- Figure 64: Asia Pacific Cooler Box Market Volume (K Unit), by Raw Material 2024 & 2032
- Figure 65: Asia Pacific Cooler Box Market Revenue Share (%), by Raw Material 2024 & 2032
- Figure 66: Asia Pacific Cooler Box Market Volume Share (%), by Raw Material 2024 & 2032
- Figure 67: Asia Pacific Cooler Box Market Revenue (Million), by End User 2024 & 2032
- Figure 68: Asia Pacific Cooler Box Market Volume (K Unit), by End User 2024 & 2032
- Figure 69: Asia Pacific Cooler Box Market Revenue Share (%), by End User 2024 & 2032
- Figure 70: Asia Pacific Cooler Box Market Volume Share (%), by End User 2024 & 2032
- Figure 71: Asia Pacific Cooler Box Market Revenue (Million), by Country 2024 & 2032
- Figure 72: Asia Pacific Cooler Box Market Volume (K Unit), by Country 2024 & 2032
- Figure 73: Asia Pacific Cooler Box Market Revenue Share (%), by Country 2024 & 2032
- Figure 74: Asia Pacific Cooler Box Market Volume Share (%), by Country 2024 & 2032
- Figure 75: South America Cooler Box Market Revenue (Million), by Type 2024 & 2032
- Figure 76: South America Cooler Box Market Volume (K Unit), by Type 2024 & 2032
- Figure 77: South America Cooler Box Market Revenue Share (%), by Type 2024 & 2032
- Figure 78: South America Cooler Box Market Volume Share (%), by Type 2024 & 2032
- Figure 79: South America Cooler Box Market Revenue (Million), by Raw Material 2024 & 2032
- Figure 80: South America Cooler Box Market Volume (K Unit), by Raw Material 2024 & 2032
- Figure 81: South America Cooler Box Market Revenue Share (%), by Raw Material 2024 & 2032
- Figure 82: South America Cooler Box Market Volume Share (%), by Raw Material 2024 & 2032
- Figure 83: South America Cooler Box Market Revenue (Million), by End User 2024 & 2032
- Figure 84: South America Cooler Box Market Volume (K Unit), by End User 2024 & 2032
- Figure 85: South America Cooler Box Market Revenue Share (%), by End User 2024 & 2032
- Figure 86: South America Cooler Box Market Volume Share (%), by End User 2024 & 2032
- Figure 87: South America Cooler Box Market Revenue (Million), by Country 2024 & 2032
- Figure 88: South America Cooler Box Market Volume (K Unit), by Country 2024 & 2032
- Figure 89: South America Cooler Box Market Revenue Share (%), by Country 2024 & 2032
- Figure 90: South America Cooler Box Market Volume Share (%), by Country 2024 & 2032
- Figure 91: Middle East and Africa Cooler Box Market Revenue (Million), by Type 2024 & 2032
- Figure 92: Middle East and Africa Cooler Box Market Volume (K Unit), by Type 2024 & 2032
- Figure 93: Middle East and Africa Cooler Box Market Revenue Share (%), by Type 2024 & 2032
- Figure 94: Middle East and Africa Cooler Box Market Volume Share (%), by Type 2024 & 2032
- Figure 95: Middle East and Africa Cooler Box Market Revenue (Million), by Raw Material 2024 & 2032
- Figure 96: Middle East and Africa Cooler Box Market Volume (K Unit), by Raw Material 2024 & 2032
- Figure 97: Middle East and Africa Cooler Box Market Revenue Share (%), by Raw Material 2024 & 2032
- Figure 98: Middle East and Africa Cooler Box Market Volume Share (%), by Raw Material 2024 & 2032
- Figure 99: Middle East and Africa Cooler Box Market Revenue (Million), by End User 2024 & 2032
- Figure 100: Middle East and Africa Cooler Box Market Volume (K Unit), by End User 2024 & 2032
- Figure 101: Middle East and Africa Cooler Box Market Revenue Share (%), by End User 2024 & 2032
- Figure 102: Middle East and Africa Cooler Box Market Volume Share (%), by End User 2024 & 2032
- Figure 103: Middle East and Africa Cooler Box Market Revenue (Million), by Country 2024 & 2032
- Figure 104: Middle East and Africa Cooler Box Market Volume (K Unit), by Country 2024 & 2032
- Figure 105: Middle East and Africa Cooler Box Market Revenue Share (%), by Country 2024 & 2032
- Figure 106: Middle East and Africa Cooler Box Market Volume Share (%), by Country 2024 & 2032
List of Tables
- Table 1: Global Cooler Box Market Revenue Million Forecast, by Region 2019 & 2032
- Table 2: Global Cooler Box Market Volume K Unit Forecast, by Region 2019 & 2032
- Table 3: Global Cooler Box Market Revenue Million Forecast, by Type 2019 & 2032
- Table 4: Global Cooler Box Market Volume K Unit Forecast, by Type 2019 & 2032
- Table 5: Global Cooler Box Market Revenue Million Forecast, by Raw Material 2019 & 2032
- Table 6: Global Cooler Box Market Volume K Unit Forecast, by Raw Material 2019 & 2032
- Table 7: Global Cooler Box Market Revenue Million Forecast, by End User 2019 & 2032
- Table 8: Global Cooler Box Market Volume K Unit Forecast, by End User 2019 & 2032
- Table 9: Global Cooler Box Market Revenue Million Forecast, by Region 2019 & 2032
- Table 10: Global Cooler Box Market Volume K Unit Forecast, by Region 2019 & 2032
- Table 11: Global Cooler Box Market Revenue Million Forecast, by Country 2019 & 2032
- Table 12: Global Cooler Box Market Volume K Unit Forecast, by Country 2019 & 2032
- Table 13: United States Cooler Box Market Revenue (Million) Forecast, by Application 2019 & 2032
- Table 14: United States Cooler Box Market Volume (K Unit) Forecast, by Application 2019 & 2032
- Table 15: Canada Cooler Box Market Revenue (Million) Forecast, by Application 2019 & 2032
- Table 16: Canada Cooler Box Market Volume (K Unit) Forecast, by Application 2019 & 2032
- Table 17: Mexico Cooler Box Market Revenue (Million) Forecast, by Application 2019 & 2032
- Table 18: Mexico Cooler Box Market Volume (K Unit) Forecast, by Application 2019 & 2032
- Table 19: Global Cooler Box Market Revenue Million Forecast, by Country 2019 & 2032
- Table 20: Global Cooler Box Market Volume K Unit Forecast, by Country 2019 & 2032
- Table 21: Germany Cooler Box Market Revenue (Million) Forecast, by Application 2019 & 2032
- Table 22: Germany Cooler Box Market Volume (K Unit) Forecast, by Application 2019 & 2032
- Table 23: United Kingdom Cooler Box Market Revenue (Million) Forecast, by Application 2019 & 2032
- Table 24: United Kingdom Cooler Box Market Volume (K Unit) Forecast, by Application 2019 & 2032
- Table 25: France Cooler Box Market Revenue (Million) Forecast, by Application 2019 & 2032
- Table 26: France Cooler Box Market Volume (K Unit) Forecast, by Application 2019 & 2032
- Table 27: Spain Cooler Box Market Revenue (Million) Forecast, by Application 2019 & 2032
- Table 28: Spain Cooler Box Market Volume (K Unit) Forecast, by Application 2019 & 2032
- Table 29: Italy Cooler Box Market Revenue (Million) Forecast, by Application 2019 & 2032
- Table 30: Italy Cooler Box Market Volume (K Unit) Forecast, by Application 2019 & 2032
- Table 31: Spain Cooler Box Market Revenue (Million) Forecast, by Application 2019 & 2032
- Table 32: Spain Cooler Box Market Volume (K Unit) Forecast, by Application 2019 & 2032
- Table 33: Belgium Cooler Box Market Revenue (Million) Forecast, by Application 2019 & 2032
- Table 34: Belgium Cooler Box Market Volume (K Unit) Forecast, by Application 2019 & 2032
- Table 35: Netherland Cooler Box Market Revenue (Million) Forecast, by Application 2019 & 2032
- Table 36: Netherland Cooler Box Market Volume (K Unit) Forecast, by Application 2019 & 2032
- Table 37: Nordics Cooler Box Market Revenue (Million) Forecast, by Application 2019 & 2032
- Table 38: Nordics Cooler Box Market Volume (K Unit) Forecast, by Application 2019 & 2032
- Table 39: Rest of Europe Cooler Box Market Revenue (Million) Forecast, by Application 2019 & 2032
- Table 40: Rest of Europe Cooler Box Market Volume (K Unit) Forecast, by Application 2019 & 2032
- Table 41: Global Cooler Box Market Revenue Million Forecast, by Country 2019 & 2032
- Table 42: Global Cooler Box Market Volume K Unit Forecast, by Country 2019 & 2032
- Table 43: China Cooler Box Market Revenue (Million) Forecast, by Application 2019 & 2032
- Table 44: China Cooler Box Market Volume (K Unit) Forecast, by Application 2019 & 2032
- Table 45: Japan Cooler Box Market Revenue (Million) Forecast, by Application 2019 & 2032
- Table 46: Japan Cooler Box Market Volume (K Unit) Forecast, by Application 2019 & 2032
- Table 47: India Cooler Box Market Revenue (Million) Forecast, by Application 2019 & 2032
- Table 48: India Cooler Box Market Volume (K Unit) Forecast, by Application 2019 & 2032
- Table 49: South Korea Cooler Box Market Revenue (Million) Forecast, by Application 2019 & 2032
- Table 50: South Korea Cooler Box Market Volume (K Unit) Forecast, by Application 2019 & 2032
- Table 51: Southeast Asia Cooler Box Market Revenue (Million) Forecast, by Application 2019 & 2032
- Table 52: Southeast Asia Cooler Box Market Volume (K Unit) Forecast, by Application 2019 & 2032
- Table 53: Australia Cooler Box Market Revenue (Million) Forecast, by Application 2019 & 2032
- Table 54: Australia Cooler Box Market Volume (K Unit) Forecast, by Application 2019 & 2032
- Table 55: Indonesia Cooler Box Market Revenue (Million) Forecast, by Application 2019 & 2032
- Table 56: Indonesia Cooler Box Market Volume (K Unit) Forecast, by Application 2019 & 2032
- Table 57: Phillipes Cooler Box Market Revenue (Million) Forecast, by Application 2019 & 2032
- Table 58: Phillipes Cooler Box Market Volume (K Unit) Forecast, by Application 2019 & 2032
- Table 59: Singapore Cooler Box Market Revenue (Million) Forecast, by Application 2019 & 2032
- Table 60: Singapore Cooler Box Market Volume (K Unit) Forecast, by Application 2019 & 2032
- Table 61: Thailandc Cooler Box Market Revenue (Million) Forecast, by Application 2019 & 2032
- Table 62: Thailandc Cooler Box Market Volume (K Unit) Forecast, by Application 2019 & 2032
- Table 63: Rest of Asia Pacific Cooler Box Market Revenue (Million) Forecast, by Application 2019 & 2032
- Table 64: Rest of Asia Pacific Cooler Box Market Volume (K Unit) Forecast, by Application 2019 & 2032
- Table 65: Global Cooler Box Market Revenue Million Forecast, by Country 2019 & 2032
- Table 66: Global Cooler Box Market Volume K Unit Forecast, by Country 2019 & 2032
- Table 67: Brazil Cooler Box Market Revenue (Million) Forecast, by Application 2019 & 2032
- Table 68: Brazil Cooler Box Market Volume (K Unit) Forecast, by Application 2019 & 2032
- Table 69: Argentina Cooler Box Market Revenue (Million) Forecast, by Application 2019 & 2032
- Table 70: Argentina Cooler Box Market Volume (K Unit) Forecast, by Application 2019 & 2032
- Table 71: Peru Cooler Box Market Revenue (Million) Forecast, by Application 2019 & 2032
- Table 72: Peru Cooler Box Market Volume (K Unit) Forecast, by Application 2019 & 2032
- Table 73: Chile Cooler Box Market Revenue (Million) Forecast, by Application 2019 & 2032
- Table 74: Chile Cooler Box Market Volume (K Unit) Forecast, by Application 2019 & 2032
- Table 75: Colombia Cooler Box Market Revenue (Million) Forecast, by Application 2019 & 2032
- Table 76: Colombia Cooler Box Market Volume (K Unit) Forecast, by Application 2019 & 2032
- Table 77: Ecuador Cooler Box Market Revenue (Million) Forecast, by Application 2019 & 2032
- Table 78: Ecuador Cooler Box Market Volume (K Unit) Forecast, by Application 2019 & 2032
- Table 79: Venezuela Cooler Box Market Revenue (Million) Forecast, by Application 2019 & 2032
- Table 80: Venezuela Cooler Box Market Volume (K Unit) Forecast, by Application 2019 & 2032
- Table 81: Rest of South America Cooler Box Market Revenue (Million) Forecast, by Application 2019 & 2032
- Table 82: Rest of South America Cooler Box Market Volume (K Unit) Forecast, by Application 2019 & 2032
- Table 83: Global Cooler Box Market Revenue Million Forecast, by Country 2019 & 2032
- Table 84: Global Cooler Box Market Volume K Unit Forecast, by Country 2019 & 2032
- Table 85: United States Cooler Box Market Revenue (Million) Forecast, by Application 2019 & 2032
- Table 86: United States Cooler Box Market Volume (K Unit) Forecast, by Application 2019 & 2032
- Table 87: Canada Cooler Box Market Revenue (Million) Forecast, by Application 2019 & 2032
- Table 88: Canada Cooler Box Market Volume (K Unit) Forecast, by Application 2019 & 2032
- Table 89: Mexico Cooler Box Market Revenue (Million) Forecast, by Application 2019 & 2032
- Table 90: Mexico Cooler Box Market Volume (K Unit) Forecast, by Application 2019 & 2032
- Table 91: Global Cooler Box Market Revenue Million Forecast, by Country 2019 & 2032
- Table 92: Global Cooler Box Market Volume K Unit Forecast, by Country 2019 & 2032
- Table 93: United Arab Emirates Cooler Box Market Revenue (Million) Forecast, by Application 2019 & 2032
- Table 94: United Arab Emirates Cooler Box Market Volume (K Unit) Forecast, by Application 2019 & 2032
- Table 95: Saudi Arabia Cooler Box Market Revenue (Million) Forecast, by Application 2019 & 2032
- Table 96: Saudi Arabia Cooler Box Market Volume (K Unit) Forecast, by Application 2019 & 2032
- Table 97: South Africa Cooler Box Market Revenue (Million) Forecast, by Application 2019 & 2032
- Table 98: South Africa Cooler Box Market Volume (K Unit) Forecast, by Application 2019 & 2032
- Table 99: Rest of Middle East and Africa Cooler Box Market Revenue (Million) Forecast, by Application 2019 & 2032
- Table 100: Rest of Middle East and Africa Cooler Box Market Volume (K Unit) Forecast, by Application 2019 & 2032
- Table 101: Global Cooler Box Market Revenue Million Forecast, by Type 2019 & 2032
- Table 102: Global Cooler Box Market Volume K Unit Forecast, by Type 2019 & 2032
- Table 103: Global Cooler Box Market Revenue Million Forecast, by Raw Material 2019 & 2032
- Table 104: Global Cooler Box Market Volume K Unit Forecast, by Raw Material 2019 & 2032
- Table 105: Global Cooler Box Market Revenue Million Forecast, by End User 2019 & 2032
- Table 106: Global Cooler Box Market Volume K Unit Forecast, by End User 2019 & 2032
- Table 107: Global Cooler Box Market Revenue Million Forecast, by Country 2019 & 2032
- Table 108: Global Cooler Box Market Volume K Unit Forecast, by Country 2019 & 2032
- Table 109: Global Cooler Box Market Revenue Million Forecast, by Type 2019 & 2032
- Table 110: Global Cooler Box Market Volume K Unit Forecast, by Type 2019 & 2032
- Table 111: Global Cooler Box Market Revenue Million Forecast, by Raw Material 2019 & 2032
- Table 112: Global Cooler Box Market Volume K Unit Forecast, by Raw Material 2019 & 2032
- Table 113: Global Cooler Box Market Revenue Million Forecast, by End User 2019 & 2032
- Table 114: Global Cooler Box Market Volume K Unit Forecast, by End User 2019 & 2032
- Table 115: Global Cooler Box Market Revenue Million Forecast, by Country 2019 & 2032
- Table 116: Global Cooler Box Market Volume K Unit Forecast, by Country 2019 & 2032
- Table 117: Global Cooler Box Market Revenue Million Forecast, by Type 2019 & 2032
- Table 118: Global Cooler Box Market Volume K Unit Forecast, by Type 2019 & 2032
- Table 119: Global Cooler Box Market Revenue Million Forecast, by Raw Material 2019 & 2032
- Table 120: Global Cooler Box Market Volume K Unit Forecast, by Raw Material 2019 & 2032
- Table 121: Global Cooler Box Market Revenue Million Forecast, by End User 2019 & 2032
- Table 122: Global Cooler Box Market Volume K Unit Forecast, by End User 2019 & 2032
- Table 123: Global Cooler Box Market Revenue Million Forecast, by Country 2019 & 2032
- Table 124: Global Cooler Box Market Volume K Unit Forecast, by Country 2019 & 2032
- Table 125: Global Cooler Box Market Revenue Million Forecast, by Type 2019 & 2032
- Table 126: Global Cooler Box Market Volume K Unit Forecast, by Type 2019 & 2032
- Table 127: Global Cooler Box Market Revenue Million Forecast, by Raw Material 2019 & 2032
- Table 128: Global Cooler Box Market Volume K Unit Forecast, by Raw Material 2019 & 2032
- Table 129: Global Cooler Box Market Revenue Million Forecast, by End User 2019 & 2032
- Table 130: Global Cooler Box Market Volume K Unit Forecast, by End User 2019 & 2032
- Table 131: Global Cooler Box Market Revenue Million Forecast, by Country 2019 & 2032
- Table 132: Global Cooler Box Market Volume K Unit Forecast, by Country 2019 & 2032
- Table 133: Global Cooler Box Market Revenue Million Forecast, by Type 2019 & 2032
- Table 134: Global Cooler Box Market Volume K Unit Forecast, by Type 2019 & 2032
- Table 135: Global Cooler Box Market Revenue Million Forecast, by Raw Material 2019 & 2032
- Table 136: Global Cooler Box Market Volume K Unit Forecast, by Raw Material 2019 & 2032
- Table 137: Global Cooler Box Market Revenue Million Forecast, by End User 2019 & 2032
- Table 138: Global Cooler Box Market Volume K Unit Forecast, by End User 2019 & 2032
- Table 139: Global Cooler Box Market Revenue Million Forecast, by Country 2019 & 2032
- Table 140: Global Cooler Box Market Volume K Unit Forecast, by Country 2019 & 2032
Frequently Asked Questions
1. What is the projected Compound Annual Growth Rate (CAGR) of the Cooler Box Market?
The projected CAGR is approximately > 10.00%.
2. Which companies are prominent players in the Cooler Box Market?
Key companies in the market include Coldchain Technologies Inc, VA-Q-tec AG, Wild Coolers, Sonoco, Cool Ice Box Company Ltd, Blowkings, Sofrigam Group, FEURER GmbH, Azenta Inc ( B Medical Systems), CSafe Global, Igloo, Bison Coolers.
3. What are the main segments of the Cooler Box Market?
The market segments include Type, Raw Material, End User.
4. Can you provide details about the market size?
The market size is estimated to be USD XX Million as of 2022.
5. What are some drivers contributing to market growth?
Increasing Birth Rate Drives The Market; Rise In Disposable Income Of Parents Drives The Market.
6. What are the notable trends driving market growth?
The Reusable Segment Dominated the Market.
7. Are there any restraints impacting market growth?
Lack of Security Issues; Infrastructure and Space Limitations.
8. Can you provide examples of recent developments in the market?
In November 2022, Sonoco, a global leader in diversified packaging, plans to further expand Sonopost cornerpost manufacturing with the new facility in Bursa, Turkey.
9. What pricing options are available for accessing the report?
Pricing options include single-user, multi-user, and enterprise licenses priced at USD 4750, USD 5250, and USD 8750 respectively.
10. Is the market size provided in terms of value or volume?
The market size is provided in terms of value, measured in Million and volume, measured in K Unit.
11. Are there any specific market keywords associated with the report?
Yes, the market keyword associated with the report is "Cooler Box Market," which aids in identifying and referencing the specific market segment covered.
12. How do I determine which pricing option suits my needs best?
The pricing options vary based on user requirements and access needs. Individual users may opt for single-user licenses, while businesses requiring broader access may choose multi-user or enterprise licenses for cost-effective access to the report.
13. Are there any additional resources or data provided in the Cooler Box Market report?
While the report offers comprehensive insights, it's advisable to review the specific contents or supplementary materials provided to ascertain if additional resources or data are available.
14. How can I stay updated on further developments or reports in the Cooler Box Market?
To stay informed about further developments, trends, and reports in the Cooler Box Market, consider subscribing to industry newsletters, following relevant companies and organizations, or regularly checking reputable industry news sources and publications.
Methodology
Step 1 - Identification of Relevant Samples Size from Population Database


Step 2 - Approaches for Defining Global Market Size (Value, Volume* & Price*)

Note*: In applicable scenarios
Step 3 - Data Sources
Primary Research
- Web Analytics
- Survey Reports
- Research Institute
- Latest Research Reports
- Opinion Leaders
Secondary Research
- Annual Reports
- White Paper
- Latest Press Release
- Industry Association
- Paid Database
- Investor Presentations

Step 4 - Data Triangulation
Involves using different sources of information in order to increase the validity of a study
These sources are likely to be stakeholders in a program - participants, other researchers, program staff, other community members, and so on.
Then we put all data in single framework & apply various statistical tools to find out the dynamic on the market.
During the analysis stage, feedback from the stakeholder groups would be compared to determine areas of agreement as well as areas of divergence


