

Key Insights
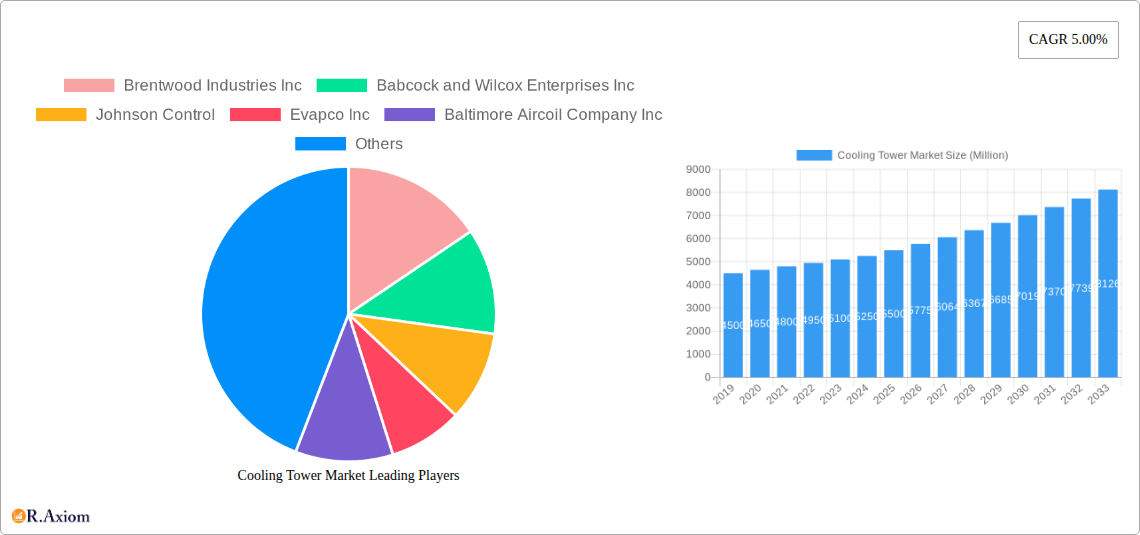
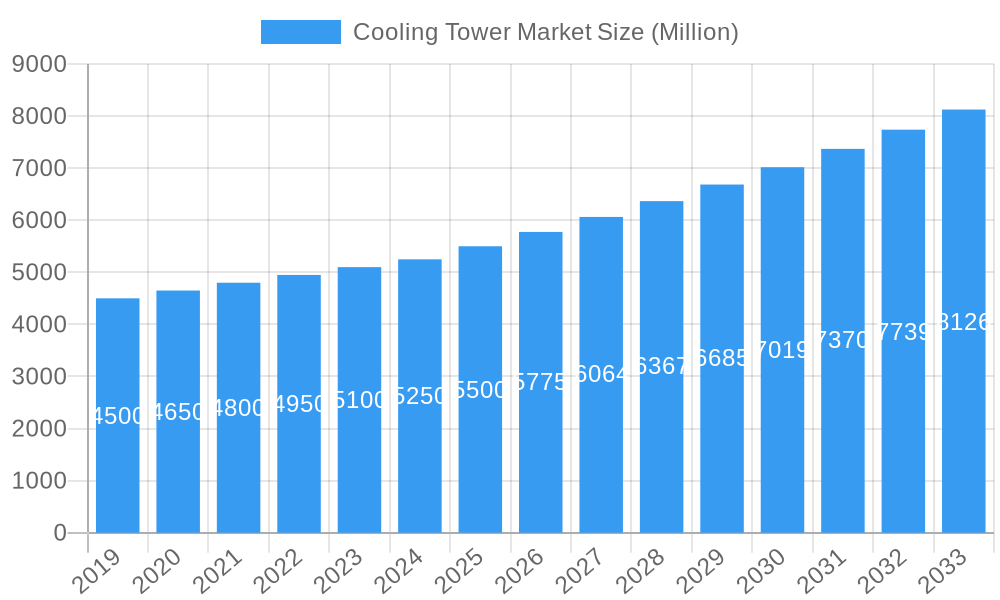
The global Cooling Tower Market is projected for significant expansion, with an estimated market size of $5.5 billion by 2025. The market is expected to witness a Compound Annual Growth Rate (CAGR) of 5.1% through 2033. This sustained growth is driven by the increasing demand for effective thermal management solutions across diverse industries. The oil and gas sector remains a key contributor, leveraging cooling towers for critical refining and processing operations. Simultaneously, the HVACR segment is experiencing robust adoption, fueled by urbanization, infrastructure development, and a focus on energy-efficient building designs. Chemical and power generation industries also represent substantial growth avenues, relying on cooling towers for process control, operational efficiency, and compliance with stringent environmental regulations.
Cooling Tower Market Market Size (In Billion)
Emerging trends, including the adoption of hybrid cooling towers offering enhanced flexibility and water conservation, are poised to influence market dynamics, addressing concerns around water scarcity and operational costs. The market features a competitive landscape with key players like Brentwood Industries Inc., Babcock and Wilcox Enterprises Inc., and Johnson Controls driving innovation and strategic collaborations. Geographically, the Asia Pacific region, led by China and India, is anticipated to dominate due to rapid industrialization and infrastructure investments. North America and Europe also present significant opportunities, driven by stringent environmental regulations and facility retrofitting with advanced cooling technologies. Potential restraints include high initial installation costs and the availability of alternative cooling solutions, emphasizing the need for continuous innovation and cost optimization.
Cooling Tower Market Company Market Share
This comprehensive report offers in-depth analysis of the global Cooling Tower Market, providing strategic insights into market dynamics, growth trajectories, and competitive landscapes. Covering the historical period (2019-2024) and a forecast period extending to 2033, with a base year of 2025, this report is essential for industry stakeholders. It includes market size estimations, CAGR projections, and detailed segmentation analysis by application, flow type, and tower type, alongside insights into market concentration, innovation drivers, regulatory frameworks, and key industry developments.
Cooling Tower Market Market Concentration & Innovation
The Cooling Tower Market exhibits moderate to high concentration, with several key players dominating global market share. In 2025, the market is projected to be valued at approximately $12,500 million, with a significant portion held by established manufacturers. Innovation is primarily driven by the demand for enhanced energy efficiency, reduced water consumption, and improved operational longevity. Regulatory frameworks, particularly environmental regulations concerning water usage and emissions, are pivotal in shaping product development and market adoption. Product substitutes, such as dry coolers and heat exchangers, present a competitive challenge, but the inherent advantages of cooling towers in high-heat load applications maintain their market dominance. End-user trends point towards a growing preference for smart cooling solutions with advanced monitoring and control capabilities. Mergers and acquisitions (M&A) activities are strategic tools for market expansion and technological integration. For instance, recent M&A deals in the industrial cooling sector have involved values ranging from $50 million to $500 million, indicating consolidation and strategic realignments.
Cooling Tower Market Industry Trends & Insights
The global Cooling Tower Market is poised for robust growth, with an estimated Compound Annual Growth Rate (CAGR) of approximately 5.5% from 2025 to 2033. This growth is fueled by an escalating demand for efficient thermal management solutions across diverse industrial sectors. Technological disruptions, such as the integration of advanced materials for enhanced durability and reduced fouling, alongside the development of intelligent control systems for optimizing performance and minimizing operational costs, are reshaping the market. Consumer preferences are increasingly leaning towards sustainable and eco-friendly cooling solutions. This includes a rising demand for cooling towers that offer significant water savings, lower energy consumption, and reduced noise pollution. The competitive dynamics within the market are characterized by intense price competition, coupled with a strong emphasis on product innovation, reliability, and after-sales service. Market penetration is expected to deepen in developing economies as industrialization and infrastructure development accelerate, creating new avenues for growth in regions like Asia-Pacific and Latin America. The market size in 2025 is estimated to reach $12,500 million, with projections indicating a significant expansion in the coming decade.
Dominant Markets & Segments in Cooling Tower Market
The Power Generation segment is anticipated to be the largest and fastest-growing application for cooling towers, driven by the increasing global demand for electricity and the subsequent expansion of power generation facilities. In 2025, this segment is expected to contribute over 35% of the total market revenue, estimated at $4,375 million. The HVACR (Heating, Ventilation, Air Conditioning, and Refrigeration) segment also holds a substantial market share, driven by growth in commercial and residential construction, particularly in urbanized areas. The Chemical Industry is another significant contributor, with cooling towers being essential for various chemical processes. The Oil Industry, while historically a major consumer, is experiencing shifts due to energy transition trends, but still represents a critical market segment.
- Dominant Region: Asia-Pacific is projected to lead the global Cooling Tower Market, owing to rapid industrialization, significant infrastructure development, and stringent environmental regulations promoting energy-efficient solutions. Countries like China and India are key growth engines.
- Application Dominance:
- Power Generation: Essential for condensing steam in thermal power plants, driving continued demand.
- HVACR: Growing demand from commercial buildings, data centers, and residential complexes.
- Chemical Industry: Crucial for process cooling and temperature control in chemical manufacturing.
- Flow Type Dominance:
- Counter Flow: Generally favored for their higher thermal performance and reduced plume, particularly in applications requiring maximum efficiency.
- Cross Flow: Popular for their ease of maintenance and accessibility.
- Type Dominance:
- Evaporative Cooling Tower: Continues to dominate the market due to its cost-effectiveness and high cooling efficiency, especially in regions with abundant water resources.
- Dry Cooling Tower: Gaining traction in water-scarce regions and for applications where water contamination is a concern.
- Hybrid Cooling Tower: Emerging as a preferred choice for balancing water and energy efficiency, offering operational flexibility.
Cooling Tower Market Product Developments
Recent product developments in the Cooling Tower Market are focused on enhancing sustainability, efficiency, and lifecycle cost. Manufacturers are investing in advanced materials that resist corrosion and fouling, thereby extending equipment life and reducing maintenance requirements. The integration of smart technologies, such as IoT sensors and advanced control algorithms, allows for real-time performance monitoring, predictive maintenance, and optimized energy consumption. These innovations provide competitive advantages by enabling customers to achieve significant operational cost savings and meet increasingly stringent environmental standards.
Report Scope & Segmentation Analysis
This report segments the Cooling Tower Market comprehensively across several key parameters.
- Application: The market is analyzed by Application, including Oil Industry, HVACR, Chemical Industry, Power Generation, and Others. Each segment's market size and projected growth are detailed.
- Flow Type: Segmentation includes Cross Flow and Counter Flow cooling towers, with analyses of their market penetration and adoption trends.
- Type: The report further divides the market into Evaporative Cooling Tower, Dry Cooling Tower, and Hybrid Cooling Tower, examining their respective market shares and future growth prospects.
Key Drivers of Cooling Tower Market Growth
Several factors are propelling the growth of the Cooling Tower Market.
- Industrial Expansion: Rapid industrialization across emerging economies, particularly in Asia-Pacific, is a primary driver, increasing demand for efficient cooling solutions in manufacturing processes and power generation.
- Energy Efficiency Mandates: Growing global emphasis on energy conservation and reduced carbon footprints is pushing industries towards adopting more energy-efficient cooling technologies like advanced cooling towers.
- Technological Advancements: Innovations in materials science and smart control systems are leading to the development of more durable, reliable, and performant cooling towers, attracting wider adoption.
- Infrastructure Development: Significant investments in infrastructure, including new power plants and commercial buildings, directly translate into higher demand for cooling towers.
Challenges in the Cooling Tower Market Sector
Despite robust growth, the Cooling Tower Market faces several challenges.
- Water Scarcity: In regions facing severe water stress, the high water consumption of traditional evaporative cooling towers can be a significant restraint, driving demand for dry and hybrid alternatives.
- High Initial Investment: The upfront cost of purchasing and installing advanced cooling tower systems can be a barrier for some industries, especially small and medium-sized enterprises.
- Regulatory Compliance: Navigating complex and evolving environmental regulations related to water discharge, noise pollution, and refrigerant use can pose compliance challenges for manufacturers and operators.
- Maintenance Costs: While ongoing maintenance is essential, high operational and maintenance costs can impact the total cost of ownership, influencing purchasing decisions.
Emerging Opportunities in Cooling Tower Market
The Cooling Tower Market is ripe with emerging opportunities.
- Sustainable Cooling Solutions: A growing demand for eco-friendly cooling technologies, including water-saving and low-emission systems, presents a significant opportunity for innovation and market penetration.
- Smart and Connected Technologies: The integration of IoT and AI in cooling tower operations for predictive maintenance, remote monitoring, and optimized performance opens new revenue streams and value propositions.
- Retrofitting and Upgradation: The large installed base of older cooling towers offers a substantial market for retrofitting and upgrading existing systems to improve efficiency and comply with modern standards.
- Data Centers and Green Buildings: The burgeoning data center industry and the increasing focus on green building certifications are creating substantial demand for high-performance and energy-efficient cooling solutions.
Leading Players in the Cooling Tower Market Market
- Brentwood Industries Inc
- Babcock and Wilcox Enterprises Inc
- Johnson Control
- Evapco Inc
- Baltimore Aircoil Company Inc
- Artech Cooling Towers Pvt Ltd
- SPX Cooling Tech LLC
- Hamon and CIE
- Thermax Limited
- Enexio Management Gmbh
Key Developments in Cooling Tower Market Industry
- February 2023: Baltimore Aircoil Company (BAC) unveiled its new TrilliumSeries Adiabatic Cooler. This product is designed for enhanced energy efficiency and minimal water usage, offering significant cost savings through optimized water and energy utilization, coupled with ease of installation and maintenance.
- November 2022: Russia successfully installed a new cooling tower at the Kursk II nuclear power plant. Standing at 179 meters, it is Russia's tallest cooling tower, expected to have a lifespan of 100 years.
Strategic Outlook for Cooling Tower Market Market
The strategic outlook for the Cooling Tower Market is highly positive, driven by a confluence of industrial growth, technological innovation, and an increasing global commitment to sustainability. The transition towards cleaner energy sources and the expansion of energy-intensive industries will continue to fuel demand for reliable and efficient cooling solutions. Manufacturers that focus on developing water-saving technologies, enhancing energy efficiency, and integrating smart functionalities will be best positioned for sustained growth. The growing awareness of environmental regulations and the drive to reduce operational costs present a significant opportunity for advanced cooling tower solutions to gain further market share. Strategic partnerships, R&D investments, and an emphasis on customer-centric solutions will be crucial for companies aiming to thrive in this dynamic market.
Cooling Tower Market Segmentation
-
1. Application
- 1.1. Oil Industry
- 1.2. HVACR
- 1.3. Chemical Industry
- 1.4. Power Generation
- 1.5. Others
-
2. Flow Type
- 2.1. Cross Flow
- 2.2. Counter Flow
-
3. Type
- 3.1. Evaporative Cooling Tower
- 3.2. Dry Cooling Tower
- 3.3. Hybrid Cooling Tower
Cooling Tower Market Segmentation By Geography
-
1. North America
- 1.1. United States
- 1.2. Canada
- 1.3. Rest of North America
-
2. Europe
- 2.1. Germany
- 2.2. France
- 2.3. United Kingdom
- 2.4. Russia
- 2.5. Rest of Europe
-
3. Asia Pacific
- 3.1. China
- 3.2. India
- 3.3. Australia
- 3.4. Malaysia
- 3.5. Rest of Asia Pacific
-
4. Middle East and Africa
- 4.1. Saudi Arabia
- 4.2. United Arab Emirates
- 4.3. Nigeria
- 4.4. Rest of Middle East and Africa
-
5. South America
- 5.1. Brazil
- 5.2. Argentina
- 5.3. Columbia
- 5.4. Rest of South America
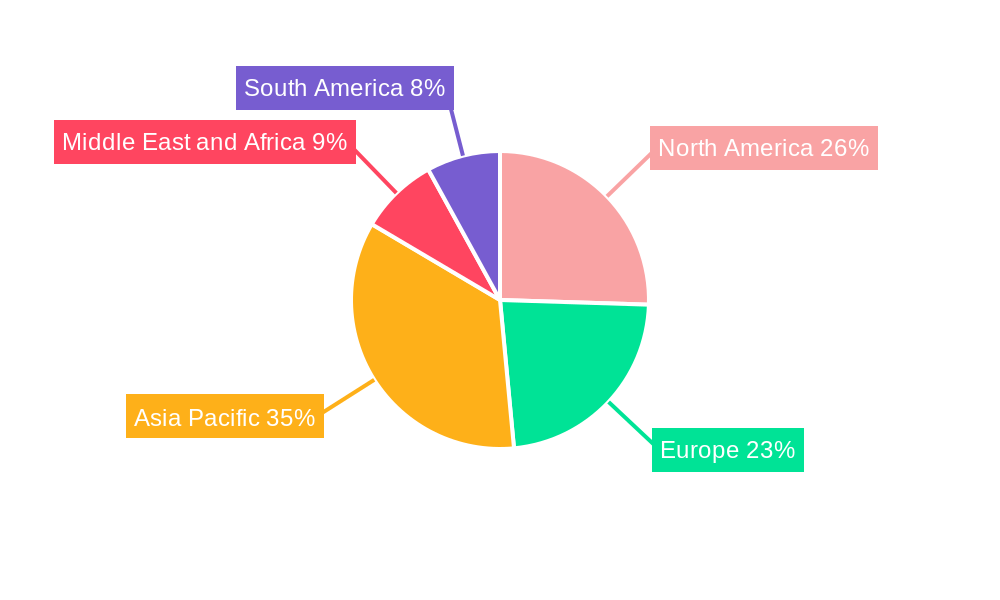
Cooling Tower Market Regional Market Share
Geographic Coverage of Cooling Tower Market
Cooling Tower Market REPORT HIGHLIGHTS
| Aspects | Details |
|---|---|
| Study Period | 2020-2034 |
| Base Year | 2025 |
| Estimated Year | 2026 |
| Forecast Period | 2026-2034 |
| Historical Period | 2020-2025 |
| Growth Rate | CAGR of 5.1% from 2020-2034 |
| Segmentation |
|
Table of Contents
- 1. Introduction
- 1.1. Research Scope
- 1.2. Market Segmentation
- 1.3. Research Objective
- 1.4. Definitions and Assumptions
- 2. Executive Summary
- 2.1. Market Snapshot
- 3. Market Dynamics
- 3.1. Market Drivers
- 3.2. Market Restrains
- 3.3. Market Trends
- 3.4. Market Opportunities
- 4. Market Factor Analysis
- 4.1. Porters Five Forces
- 4.1.1. Bargaining Power of Suppliers
- 4.1.2. Bargaining Power of Buyers
- 4.1.3. Threat of New Entrants
- 4.1.4. Threat of Substitutes
- 4.1.5. Competitive Rivalry
- 4.2. PESTEL analysis
- 4.3. BCG Analysis
- 4.3.1. Stars (High Growth, High Market Share)
- 4.3.2. Cash Cows (Low Growth, High Market Share)
- 4.3.3. Question Mark (High Growth, Low Market Share)
- 4.3.4. Dogs (Low Growth, Low Market Share)
- 4.4. Ansoff Matrix Analysis
- 4.5. Supply Chain Analysis
- 4.6. Regulatory Landscape
- 4.7. Current Market Potential and Opportunity Assessment (TAM–SAM–SOM Framework)
- 4.8. RAX Analyst Note
- 4.1. Porters Five Forces
- 5. Market Analysis, Insights and Forecast 2021-2033
- 5.1. Market Analysis, Insights and Forecast - by Application
- 5.1.1. Oil Industry
- 5.1.2. HVACR
- 5.1.3. Chemical Industry
- 5.1.4. Power Generation
- 5.1.5. Others
- 5.2. Market Analysis, Insights and Forecast - by Flow Type
- 5.2.1. Cross Flow
- 5.2.2. Counter Flow
- 5.3. Market Analysis, Insights and Forecast - by Type
- 5.3.1. Evaporative Cooling Tower
- 5.3.2. Dry Cooling Tower
- 5.3.3. Hybrid Cooling Tower
- 5.4. Market Analysis, Insights and Forecast - by Region
- 5.4.1. North America
- 5.4.2. Europe
- 5.4.3. Asia Pacific
- 5.4.4. Middle East and Africa
- 5.4.5. South America
- 5.1. Market Analysis, Insights and Forecast - by Application
- 6. Global Cooling Tower Market Analysis, Insights and Forecast, 2021-2033
- 6.1. Market Analysis, Insights and Forecast - by Application
- 6.1.1. Oil Industry
- 6.1.2. HVACR
- 6.1.3. Chemical Industry
- 6.1.4. Power Generation
- 6.1.5. Others
- 6.2. Market Analysis, Insights and Forecast - by Flow Type
- 6.2.1. Cross Flow
- 6.2.2. Counter Flow
- 6.3. Market Analysis, Insights and Forecast - by Type
- 6.3.1. Evaporative Cooling Tower
- 6.3.2. Dry Cooling Tower
- 6.3.3. Hybrid Cooling Tower
- 6.1. Market Analysis, Insights and Forecast - by Application
- 7. North America Cooling Tower Market Analysis, Insights and Forecast, 2020-2032
- 7.1. Market Analysis, Insights and Forecast - by Application
- 7.1.1. Oil Industry
- 7.1.2. HVACR
- 7.1.3. Chemical Industry
- 7.1.4. Power Generation
- 7.1.5. Others
- 7.2. Market Analysis, Insights and Forecast - by Flow Type
- 7.2.1. Cross Flow
- 7.2.2. Counter Flow
- 7.3. Market Analysis, Insights and Forecast - by Type
- 7.3.1. Evaporative Cooling Tower
- 7.3.2. Dry Cooling Tower
- 7.3.3. Hybrid Cooling Tower
- 7.1. Market Analysis, Insights and Forecast - by Application
- 8. Europe Cooling Tower Market Analysis, Insights and Forecast, 2020-2032
- 8.1. Market Analysis, Insights and Forecast - by Application
- 8.1.1. Oil Industry
- 8.1.2. HVACR
- 8.1.3. Chemical Industry
- 8.1.4. Power Generation
- 8.1.5. Others
- 8.2. Market Analysis, Insights and Forecast - by Flow Type
- 8.2.1. Cross Flow
- 8.2.2. Counter Flow
- 8.3. Market Analysis, Insights and Forecast - by Type
- 8.3.1. Evaporative Cooling Tower
- 8.3.2. Dry Cooling Tower
- 8.3.3. Hybrid Cooling Tower
- 8.1. Market Analysis, Insights and Forecast - by Application
- 9. Asia Pacific Cooling Tower Market Analysis, Insights and Forecast, 2020-2032
- 9.1. Market Analysis, Insights and Forecast - by Application
- 9.1.1. Oil Industry
- 9.1.2. HVACR
- 9.1.3. Chemical Industry
- 9.1.4. Power Generation
- 9.1.5. Others
- 9.2. Market Analysis, Insights and Forecast - by Flow Type
- 9.2.1. Cross Flow
- 9.2.2. Counter Flow
- 9.3. Market Analysis, Insights and Forecast - by Type
- 9.3.1. Evaporative Cooling Tower
- 9.3.2. Dry Cooling Tower
- 9.3.3. Hybrid Cooling Tower
- 9.1. Market Analysis, Insights and Forecast - by Application
- 10. Middle East and Africa Cooling Tower Market Analysis, Insights and Forecast, 2020-2032
- 10.1. Market Analysis, Insights and Forecast - by Application
- 10.1.1. Oil Industry
- 10.1.2. HVACR
- 10.1.3. Chemical Industry
- 10.1.4. Power Generation
- 10.1.5. Others
- 10.2. Market Analysis, Insights and Forecast - by Flow Type
- 10.2.1. Cross Flow
- 10.2.2. Counter Flow
- 10.3. Market Analysis, Insights and Forecast - by Type
- 10.3.1. Evaporative Cooling Tower
- 10.3.2. Dry Cooling Tower
- 10.3.3. Hybrid Cooling Tower
- 10.1. Market Analysis, Insights and Forecast - by Application
- 11. South America Cooling Tower Market Analysis, Insights and Forecast, 2020-2032
- 11.1. Market Analysis, Insights and Forecast - by Application
- 11.1.1. Oil Industry
- 11.1.2. HVACR
- 11.1.3. Chemical Industry
- 11.1.4. Power Generation
- 11.1.5. Others
- 11.2. Market Analysis, Insights and Forecast - by Flow Type
- 11.2.1. Cross Flow
- 11.2.2. Counter Flow
- 11.3. Market Analysis, Insights and Forecast - by Type
- 11.3.1. Evaporative Cooling Tower
- 11.3.2. Dry Cooling Tower
- 11.3.3. Hybrid Cooling Tower
- 11.1. Market Analysis, Insights and Forecast - by Application
- 12. Competitive Analysis
- 12.1. Company Profiles
- 12.1.1 Brentwood Industries Inc
- 12.1.1.1. Company Overview
- 12.1.1.2. Products
- 12.1.1.3. Company Financials
- 12.1.1.4. SWOT Analysis
- 12.1.2 Babcock and Wilcox Enterprises Inc
- 12.1.2.1. Company Overview
- 12.1.2.2. Products
- 12.1.2.3. Company Financials
- 12.1.2.4. SWOT Analysis
- 12.1.3 Johnson Control
- 12.1.3.1. Company Overview
- 12.1.3.2. Products
- 12.1.3.3. Company Financials
- 12.1.3.4. SWOT Analysis
- 12.1.4 Evapco Inc
- 12.1.4.1. Company Overview
- 12.1.4.2. Products
- 12.1.4.3. Company Financials
- 12.1.4.4. SWOT Analysis
- 12.1.5 Baltimore Aircoil Company Inc
- 12.1.5.1. Company Overview
- 12.1.5.2. Products
- 12.1.5.3. Company Financials
- 12.1.5.4. SWOT Analysis
- 12.1.6 Artech Cooling Towers Pvt Ltd
- 12.1.6.1. Company Overview
- 12.1.6.2. Products
- 12.1.6.3. Company Financials
- 12.1.6.4. SWOT Analysis
- 12.1.7 SPX Cooling Tech LLC
- 12.1.7.1. Company Overview
- 12.1.7.2. Products
- 12.1.7.3. Company Financials
- 12.1.7.4. SWOT Analysis
- 12.1.8 Hamon and CIE
- 12.1.8.1. Company Overview
- 12.1.8.2. Products
- 12.1.8.3. Company Financials
- 12.1.8.4. SWOT Analysis
- 12.1.9 Thermax Limited*List Not Exhaustive
- 12.1.9.1. Company Overview
- 12.1.9.2. Products
- 12.1.9.3. Company Financials
- 12.1.9.4. SWOT Analysis
- 12.1.10 Enexio Management Gmbh
- 12.1.10.1. Company Overview
- 12.1.10.2. Products
- 12.1.10.3. Company Financials
- 12.1.10.4. SWOT Analysis
- 12.1.1 Brentwood Industries Inc
- 12.2. Market Entropy
- 12.2.1 Company's Key Areas Served
- 12.2.2 Recent Developments
- 12.3. Company Market Share Analysis 2025
- 12.3.1 Top 5 Companies Market Share Analysis
- 12.3.2 Top 3 Companies Market Share Analysis
- 12.4. List of Potential Customers
- 13. Research Methodology
List of Figures
- Figure 1: Global Cooling Tower Market Revenue Breakdown (billion, %) by Region 2025 & 2033
- Figure 2: Global Cooling Tower Market Volume Breakdown (K Unit, %) by Region 2025 & 2033
- Figure 3: North America Cooling Tower Market Revenue (billion), by Application 2025 & 2033
- Figure 4: North America Cooling Tower Market Volume (K Unit), by Application 2025 & 2033
- Figure 5: North America Cooling Tower Market Revenue Share (%), by Application 2025 & 2033
- Figure 6: North America Cooling Tower Market Volume Share (%), by Application 2025 & 2033
- Figure 7: North America Cooling Tower Market Revenue (billion), by Flow Type 2025 & 2033
- Figure 8: North America Cooling Tower Market Volume (K Unit), by Flow Type 2025 & 2033
- Figure 9: North America Cooling Tower Market Revenue Share (%), by Flow Type 2025 & 2033
- Figure 10: North America Cooling Tower Market Volume Share (%), by Flow Type 2025 & 2033
- Figure 11: North America Cooling Tower Market Revenue (billion), by Type 2025 & 2033
- Figure 12: North America Cooling Tower Market Volume (K Unit), by Type 2025 & 2033
- Figure 13: North America Cooling Tower Market Revenue Share (%), by Type 2025 & 2033
- Figure 14: North America Cooling Tower Market Volume Share (%), by Type 2025 & 2033
- Figure 15: North America Cooling Tower Market Revenue (billion), by Country 2025 & 2033
- Figure 16: North America Cooling Tower Market Volume (K Unit), by Country 2025 & 2033
- Figure 17: North America Cooling Tower Market Revenue Share (%), by Country 2025 & 2033
- Figure 18: North America Cooling Tower Market Volume Share (%), by Country 2025 & 2033
- Figure 19: Europe Cooling Tower Market Revenue (billion), by Application 2025 & 2033
- Figure 20: Europe Cooling Tower Market Volume (K Unit), by Application 2025 & 2033
- Figure 21: Europe Cooling Tower Market Revenue Share (%), by Application 2025 & 2033
- Figure 22: Europe Cooling Tower Market Volume Share (%), by Application 2025 & 2033
- Figure 23: Europe Cooling Tower Market Revenue (billion), by Flow Type 2025 & 2033
- Figure 24: Europe Cooling Tower Market Volume (K Unit), by Flow Type 2025 & 2033
- Figure 25: Europe Cooling Tower Market Revenue Share (%), by Flow Type 2025 & 2033
- Figure 26: Europe Cooling Tower Market Volume Share (%), by Flow Type 2025 & 2033
- Figure 27: Europe Cooling Tower Market Revenue (billion), by Type 2025 & 2033
- Figure 28: Europe Cooling Tower Market Volume (K Unit), by Type 2025 & 2033
- Figure 29: Europe Cooling Tower Market Revenue Share (%), by Type 2025 & 2033
- Figure 30: Europe Cooling Tower Market Volume Share (%), by Type 2025 & 2033
- Figure 31: Europe Cooling Tower Market Revenue (billion), by Country 2025 & 2033
- Figure 32: Europe Cooling Tower Market Volume (K Unit), by Country 2025 & 2033
- Figure 33: Europe Cooling Tower Market Revenue Share (%), by Country 2025 & 2033
- Figure 34: Europe Cooling Tower Market Volume Share (%), by Country 2025 & 2033
- Figure 35: Asia Pacific Cooling Tower Market Revenue (billion), by Application 2025 & 2033
- Figure 36: Asia Pacific Cooling Tower Market Volume (K Unit), by Application 2025 & 2033
- Figure 37: Asia Pacific Cooling Tower Market Revenue Share (%), by Application 2025 & 2033
- Figure 38: Asia Pacific Cooling Tower Market Volume Share (%), by Application 2025 & 2033
- Figure 39: Asia Pacific Cooling Tower Market Revenue (billion), by Flow Type 2025 & 2033
- Figure 40: Asia Pacific Cooling Tower Market Volume (K Unit), by Flow Type 2025 & 2033
- Figure 41: Asia Pacific Cooling Tower Market Revenue Share (%), by Flow Type 2025 & 2033
- Figure 42: Asia Pacific Cooling Tower Market Volume Share (%), by Flow Type 2025 & 2033
- Figure 43: Asia Pacific Cooling Tower Market Revenue (billion), by Type 2025 & 2033
- Figure 44: Asia Pacific Cooling Tower Market Volume (K Unit), by Type 2025 & 2033
- Figure 45: Asia Pacific Cooling Tower Market Revenue Share (%), by Type 2025 & 2033
- Figure 46: Asia Pacific Cooling Tower Market Volume Share (%), by Type 2025 & 2033
- Figure 47: Asia Pacific Cooling Tower Market Revenue (billion), by Country 2025 & 2033
- Figure 48: Asia Pacific Cooling Tower Market Volume (K Unit), by Country 2025 & 2033
- Figure 49: Asia Pacific Cooling Tower Market Revenue Share (%), by Country 2025 & 2033
- Figure 50: Asia Pacific Cooling Tower Market Volume Share (%), by Country 2025 & 2033
- Figure 51: Middle East and Africa Cooling Tower Market Revenue (billion), by Application 2025 & 2033
- Figure 52: Middle East and Africa Cooling Tower Market Volume (K Unit), by Application 2025 & 2033
- Figure 53: Middle East and Africa Cooling Tower Market Revenue Share (%), by Application 2025 & 2033
- Figure 54: Middle East and Africa Cooling Tower Market Volume Share (%), by Application 2025 & 2033
- Figure 55: Middle East and Africa Cooling Tower Market Revenue (billion), by Flow Type 2025 & 2033
- Figure 56: Middle East and Africa Cooling Tower Market Volume (K Unit), by Flow Type 2025 & 2033
- Figure 57: Middle East and Africa Cooling Tower Market Revenue Share (%), by Flow Type 2025 & 2033
- Figure 58: Middle East and Africa Cooling Tower Market Volume Share (%), by Flow Type 2025 & 2033
- Figure 59: Middle East and Africa Cooling Tower Market Revenue (billion), by Type 2025 & 2033
- Figure 60: Middle East and Africa Cooling Tower Market Volume (K Unit), by Type 2025 & 2033
- Figure 61: Middle East and Africa Cooling Tower Market Revenue Share (%), by Type 2025 & 2033
- Figure 62: Middle East and Africa Cooling Tower Market Volume Share (%), by Type 2025 & 2033
- Figure 63: Middle East and Africa Cooling Tower Market Revenue (billion), by Country 2025 & 2033
- Figure 64: Middle East and Africa Cooling Tower Market Volume (K Unit), by Country 2025 & 2033
- Figure 65: Middle East and Africa Cooling Tower Market Revenue Share (%), by Country 2025 & 2033
- Figure 66: Middle East and Africa Cooling Tower Market Volume Share (%), by Country 2025 & 2033
- Figure 67: South America Cooling Tower Market Revenue (billion), by Application 2025 & 2033
- Figure 68: South America Cooling Tower Market Volume (K Unit), by Application 2025 & 2033
- Figure 69: South America Cooling Tower Market Revenue Share (%), by Application 2025 & 2033
- Figure 70: South America Cooling Tower Market Volume Share (%), by Application 2025 & 2033
- Figure 71: South America Cooling Tower Market Revenue (billion), by Flow Type 2025 & 2033
- Figure 72: South America Cooling Tower Market Volume (K Unit), by Flow Type 2025 & 2033
- Figure 73: South America Cooling Tower Market Revenue Share (%), by Flow Type 2025 & 2033
- Figure 74: South America Cooling Tower Market Volume Share (%), by Flow Type 2025 & 2033
- Figure 75: South America Cooling Tower Market Revenue (billion), by Type 2025 & 2033
- Figure 76: South America Cooling Tower Market Volume (K Unit), by Type 2025 & 2033
- Figure 77: South America Cooling Tower Market Revenue Share (%), by Type 2025 & 2033
- Figure 78: South America Cooling Tower Market Volume Share (%), by Type 2025 & 2033
- Figure 79: South America Cooling Tower Market Revenue (billion), by Country 2025 & 2033
- Figure 80: South America Cooling Tower Market Volume (K Unit), by Country 2025 & 2033
- Figure 81: South America Cooling Tower Market Revenue Share (%), by Country 2025 & 2033
- Figure 82: South America Cooling Tower Market Volume Share (%), by Country 2025 & 2033
List of Tables
- Table 1: Global Cooling Tower Market Revenue billion Forecast, by Application 2020 & 2033
- Table 2: Global Cooling Tower Market Volume K Unit Forecast, by Application 2020 & 2033
- Table 3: Global Cooling Tower Market Revenue billion Forecast, by Flow Type 2020 & 2033
- Table 4: Global Cooling Tower Market Volume K Unit Forecast, by Flow Type 2020 & 2033
- Table 5: Global Cooling Tower Market Revenue billion Forecast, by Type 2020 & 2033
- Table 6: Global Cooling Tower Market Volume K Unit Forecast, by Type 2020 & 2033
- Table 7: Global Cooling Tower Market Revenue billion Forecast, by Region 2020 & 2033
- Table 8: Global Cooling Tower Market Volume K Unit Forecast, by Region 2020 & 2033
- Table 9: Global Cooling Tower Market Revenue billion Forecast, by Application 2020 & 2033
- Table 10: Global Cooling Tower Market Volume K Unit Forecast, by Application 2020 & 2033
- Table 11: Global Cooling Tower Market Revenue billion Forecast, by Flow Type 2020 & 2033
- Table 12: Global Cooling Tower Market Volume K Unit Forecast, by Flow Type 2020 & 2033
- Table 13: Global Cooling Tower Market Revenue billion Forecast, by Type 2020 & 2033
- Table 14: Global Cooling Tower Market Volume K Unit Forecast, by Type 2020 & 2033
- Table 15: Global Cooling Tower Market Revenue billion Forecast, by Country 2020 & 2033
- Table 16: Global Cooling Tower Market Volume K Unit Forecast, by Country 2020 & 2033
- Table 17: United States Cooling Tower Market Revenue (billion) Forecast, by Application 2020 & 2033
- Table 18: United States Cooling Tower Market Volume (K Unit) Forecast, by Application 2020 & 2033
- Table 19: Canada Cooling Tower Market Revenue (billion) Forecast, by Application 2020 & 2033
- Table 20: Canada Cooling Tower Market Volume (K Unit) Forecast, by Application 2020 & 2033
- Table 21: Rest of North America Cooling Tower Market Revenue (billion) Forecast, by Application 2020 & 2033
- Table 22: Rest of North America Cooling Tower Market Volume (K Unit) Forecast, by Application 2020 & 2033
- Table 23: Global Cooling Tower Market Revenue billion Forecast, by Application 2020 & 2033
- Table 24: Global Cooling Tower Market Volume K Unit Forecast, by Application 2020 & 2033
- Table 25: Global Cooling Tower Market Revenue billion Forecast, by Flow Type 2020 & 2033
- Table 26: Global Cooling Tower Market Volume K Unit Forecast, by Flow Type 2020 & 2033
- Table 27: Global Cooling Tower Market Revenue billion Forecast, by Type 2020 & 2033
- Table 28: Global Cooling Tower Market Volume K Unit Forecast, by Type 2020 & 2033
- Table 29: Global Cooling Tower Market Revenue billion Forecast, by Country 2020 & 2033
- Table 30: Global Cooling Tower Market Volume K Unit Forecast, by Country 2020 & 2033
- Table 31: Germany Cooling Tower Market Revenue (billion) Forecast, by Application 2020 & 2033
- Table 32: Germany Cooling Tower Market Volume (K Unit) Forecast, by Application 2020 & 2033
- Table 33: France Cooling Tower Market Revenue (billion) Forecast, by Application 2020 & 2033
- Table 34: France Cooling Tower Market Volume (K Unit) Forecast, by Application 2020 & 2033
- Table 35: United Kingdom Cooling Tower Market Revenue (billion) Forecast, by Application 2020 & 2033
- Table 36: United Kingdom Cooling Tower Market Volume (K Unit) Forecast, by Application 2020 & 2033
- Table 37: Russia Cooling Tower Market Revenue (billion) Forecast, by Application 2020 & 2033
- Table 38: Russia Cooling Tower Market Volume (K Unit) Forecast, by Application 2020 & 2033
- Table 39: Rest of Europe Cooling Tower Market Revenue (billion) Forecast, by Application 2020 & 2033
- Table 40: Rest of Europe Cooling Tower Market Volume (K Unit) Forecast, by Application 2020 & 2033
- Table 41: Global Cooling Tower Market Revenue billion Forecast, by Application 2020 & 2033
- Table 42: Global Cooling Tower Market Volume K Unit Forecast, by Application 2020 & 2033
- Table 43: Global Cooling Tower Market Revenue billion Forecast, by Flow Type 2020 & 2033
- Table 44: Global Cooling Tower Market Volume K Unit Forecast, by Flow Type 2020 & 2033
- Table 45: Global Cooling Tower Market Revenue billion Forecast, by Type 2020 & 2033
- Table 46: Global Cooling Tower Market Volume K Unit Forecast, by Type 2020 & 2033
- Table 47: Global Cooling Tower Market Revenue billion Forecast, by Country 2020 & 2033
- Table 48: Global Cooling Tower Market Volume K Unit Forecast, by Country 2020 & 2033
- Table 49: China Cooling Tower Market Revenue (billion) Forecast, by Application 2020 & 2033
- Table 50: China Cooling Tower Market Volume (K Unit) Forecast, by Application 2020 & 2033
- Table 51: India Cooling Tower Market Revenue (billion) Forecast, by Application 2020 & 2033
- Table 52: India Cooling Tower Market Volume (K Unit) Forecast, by Application 2020 & 2033
- Table 53: Australia Cooling Tower Market Revenue (billion) Forecast, by Application 2020 & 2033
- Table 54: Australia Cooling Tower Market Volume (K Unit) Forecast, by Application 2020 & 2033
- Table 55: Malaysia Cooling Tower Market Revenue (billion) Forecast, by Application 2020 & 2033
- Table 56: Malaysia Cooling Tower Market Volume (K Unit) Forecast, by Application 2020 & 2033
- Table 57: Rest of Asia Pacific Cooling Tower Market Revenue (billion) Forecast, by Application 2020 & 2033
- Table 58: Rest of Asia Pacific Cooling Tower Market Volume (K Unit) Forecast, by Application 2020 & 2033
- Table 59: Global Cooling Tower Market Revenue billion Forecast, by Application 2020 & 2033
- Table 60: Global Cooling Tower Market Volume K Unit Forecast, by Application 2020 & 2033
- Table 61: Global Cooling Tower Market Revenue billion Forecast, by Flow Type 2020 & 2033
- Table 62: Global Cooling Tower Market Volume K Unit Forecast, by Flow Type 2020 & 2033
- Table 63: Global Cooling Tower Market Revenue billion Forecast, by Type 2020 & 2033
- Table 64: Global Cooling Tower Market Volume K Unit Forecast, by Type 2020 & 2033
- Table 65: Global Cooling Tower Market Revenue billion Forecast, by Country 2020 & 2033
- Table 66: Global Cooling Tower Market Volume K Unit Forecast, by Country 2020 & 2033
- Table 67: Saudi Arabia Cooling Tower Market Revenue (billion) Forecast, by Application 2020 & 2033
- Table 68: Saudi Arabia Cooling Tower Market Volume (K Unit) Forecast, by Application 2020 & 2033
- Table 69: United Arab Emirates Cooling Tower Market Revenue (billion) Forecast, by Application 2020 & 2033
- Table 70: United Arab Emirates Cooling Tower Market Volume (K Unit) Forecast, by Application 2020 & 2033
- Table 71: Nigeria Cooling Tower Market Revenue (billion) Forecast, by Application 2020 & 2033
- Table 72: Nigeria Cooling Tower Market Volume (K Unit) Forecast, by Application 2020 & 2033
- Table 73: Rest of Middle East and Africa Cooling Tower Market Revenue (billion) Forecast, by Application 2020 & 2033
- Table 74: Rest of Middle East and Africa Cooling Tower Market Volume (K Unit) Forecast, by Application 2020 & 2033
- Table 75: Global Cooling Tower Market Revenue billion Forecast, by Application 2020 & 2033
- Table 76: Global Cooling Tower Market Volume K Unit Forecast, by Application 2020 & 2033
- Table 77: Global Cooling Tower Market Revenue billion Forecast, by Flow Type 2020 & 2033
- Table 78: Global Cooling Tower Market Volume K Unit Forecast, by Flow Type 2020 & 2033
- Table 79: Global Cooling Tower Market Revenue billion Forecast, by Type 2020 & 2033
- Table 80: Global Cooling Tower Market Volume K Unit Forecast, by Type 2020 & 2033
- Table 81: Global Cooling Tower Market Revenue billion Forecast, by Country 2020 & 2033
- Table 82: Global Cooling Tower Market Volume K Unit Forecast, by Country 2020 & 2033
- Table 83: Brazil Cooling Tower Market Revenue (billion) Forecast, by Application 2020 & 2033
- Table 84: Brazil Cooling Tower Market Volume (K Unit) Forecast, by Application 2020 & 2033
- Table 85: Argentina Cooling Tower Market Revenue (billion) Forecast, by Application 2020 & 2033
- Table 86: Argentina Cooling Tower Market Volume (K Unit) Forecast, by Application 2020 & 2033
- Table 87: Columbia Cooling Tower Market Revenue (billion) Forecast, by Application 2020 & 2033
- Table 88: Columbia Cooling Tower Market Volume (K Unit) Forecast, by Application 2020 & 2033
- Table 89: Rest of South America Cooling Tower Market Revenue (billion) Forecast, by Application 2020 & 2033
- Table 90: Rest of South America Cooling Tower Market Volume (K Unit) Forecast, by Application 2020 & 2033
Frequently Asked Questions
1. What is the projected Compound Annual Growth Rate (CAGR) of the Cooling Tower Market?
The projected CAGR is approximately 5.1%.
2. Which companies are prominent players in the Cooling Tower Market?
Key companies in the market include Brentwood Industries Inc, Babcock and Wilcox Enterprises Inc, Johnson Control, Evapco Inc, Baltimore Aircoil Company Inc, Artech Cooling Towers Pvt Ltd, SPX Cooling Tech LLC, Hamon and CIE, Thermax Limited*List Not Exhaustive, Enexio Management Gmbh.
3. What are the main segments of the Cooling Tower Market?
The market segments include Application, Flow Type, Type.
4. Can you provide details about the market size?
The market size is estimated to be USD 4.4 billion as of 2022.
5. What are some drivers contributing to market growth?
4.; Falling Costs of Green And Blue Hydrogen Generation4.; Rising Demand from The Automotive Sector.
6. What are the notable trends driving market growth?
Power Generation Expected to Witness Growth.
7. Are there any restraints impacting market growth?
4.; Competition for Alternative Energy Source.
8. Can you provide examples of recent developments in the market?
In February 2023, Baltimore Aircoil Company (BAC) revealed its new TrilliumSeries Adiabatic Cooler. This adiabatic cooling Tower is ideal for energy efficiency and limited water use applications. The design maximizes both water and energy efficiency, ultimately minimizing costs. In addition, the TrilliumSeries Cooler is designed to make installation and ongoing maintenance simple.
9. What pricing options are available for accessing the report?
Pricing options include single-user, multi-user, and enterprise licenses priced at USD 4750, USD 5250, and USD 8750 respectively.
10. Is the market size provided in terms of value or volume?
The market size is provided in terms of value, measured in billion and volume, measured in K Unit.
11. Are there any specific market keywords associated with the report?
Yes, the market keyword associated with the report is "Cooling Tower Market," which aids in identifying and referencing the specific market segment covered.
12. How do I determine which pricing option suits my needs best?
The pricing options vary based on user requirements and access needs. Individual users may opt for single-user licenses, while businesses requiring broader access may choose multi-user or enterprise licenses for cost-effective access to the report.
13. Are there any additional resources or data provided in the Cooling Tower Market report?
While the report offers comprehensive insights, it's advisable to review the specific contents or supplementary materials provided to ascertain if additional resources or data are available.
14. How can I stay updated on further developments or reports in the Cooling Tower Market?
To stay informed about further developments, trends, and reports in the Cooling Tower Market, consider subscribing to industry newsletters, following relevant companies and organizations, or regularly checking reputable industry news sources and publications.
Methodology
Step 1 - Identification of Relevant Samples Size from Population Database


Step 2 - Approaches for Defining Global Market Size (Value, Volume* & Price*)

Note*: In applicable scenarios
Step 3 - Data Sources
Primary Research
- Web Analytics
- Survey Reports
- Research Institute
- Latest Research Reports
- Opinion Leaders
Secondary Research
- Annual Reports
- White Paper
- Latest Press Release
- Industry Association
- Paid Database
- Investor Presentations

Step 4 - Data Triangulation
Involves using different sources of information in order to increase the validity of a study
These sources are likely to be stakeholders in a program - participants, other researchers, program staff, other community members, and so on.
Then we put all data in single framework & apply various statistical tools to find out the dynamic on the market.
During the analysis stage, feedback from the stakeholder groups would be compared to determine areas of agreement as well as areas of divergence