

Key Insights
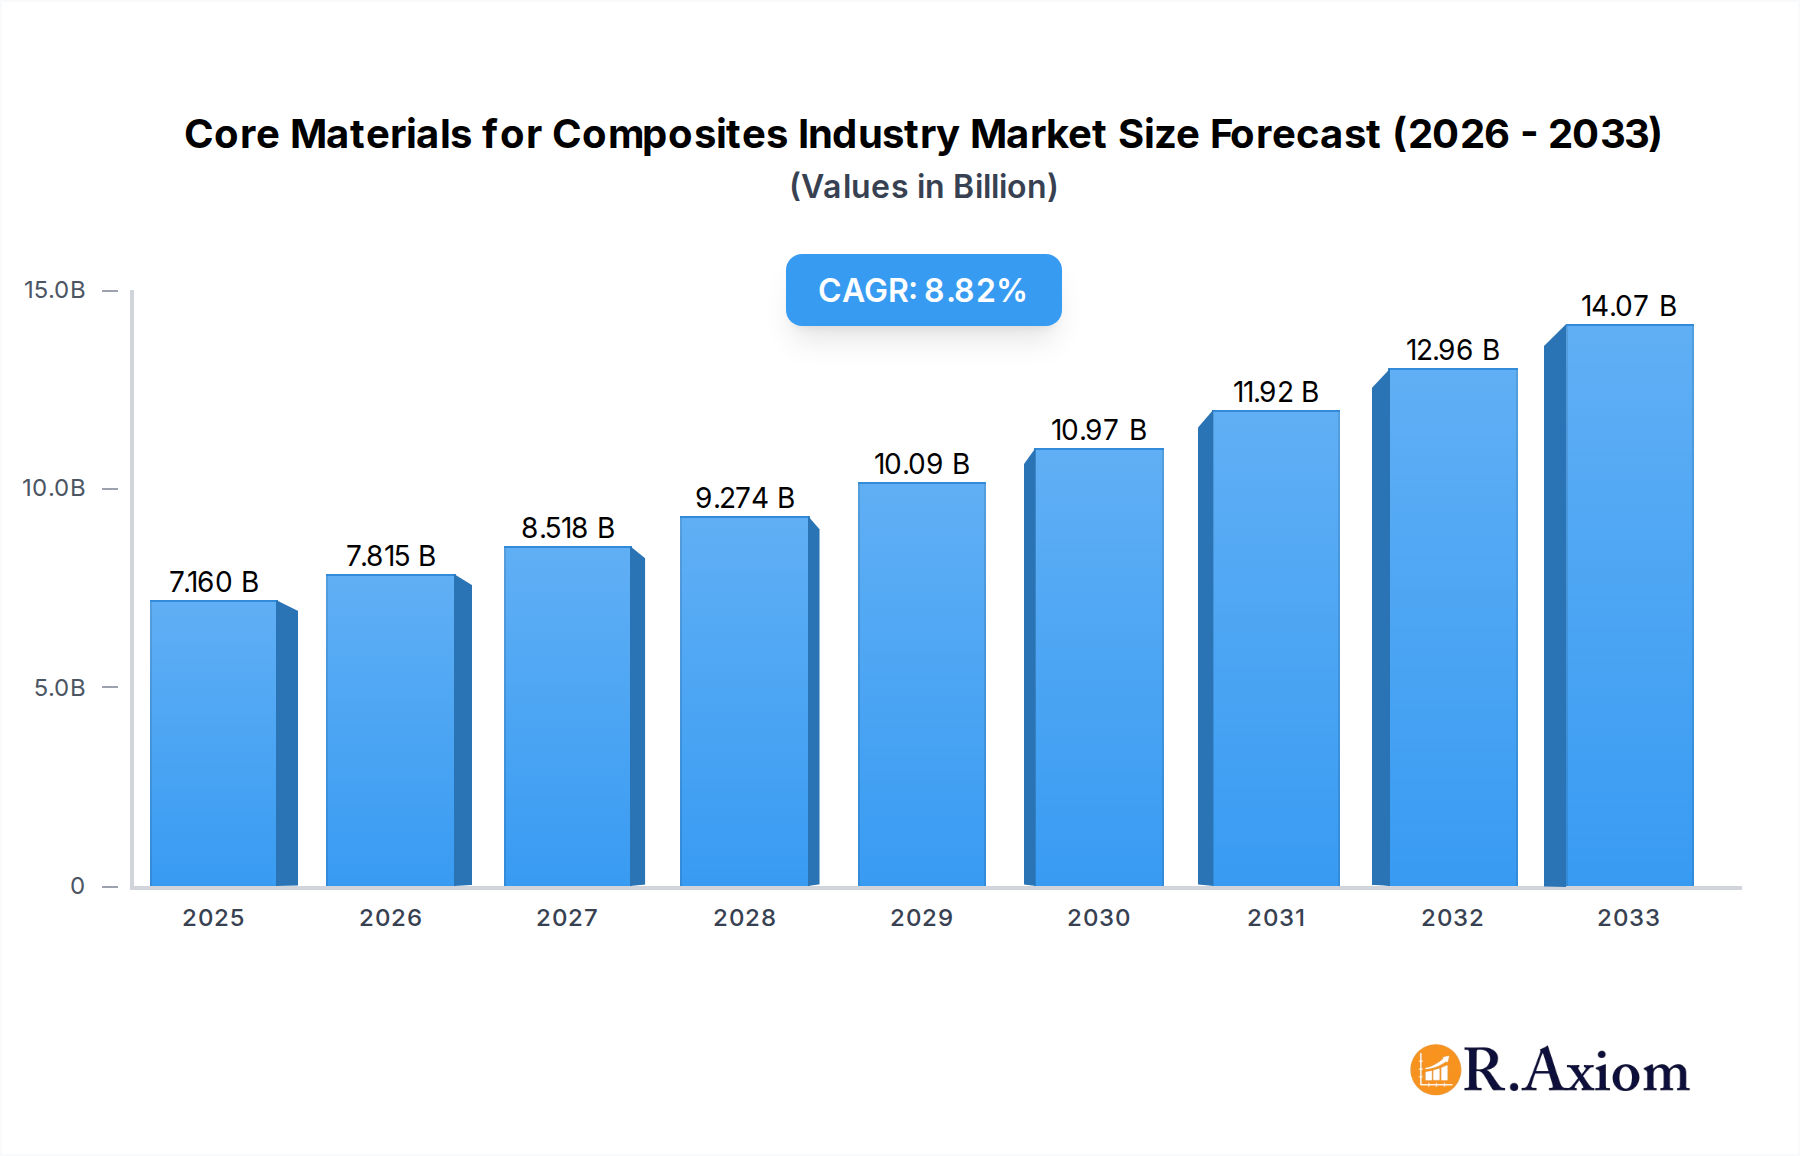
The global market for Core Materials for Composites is poised for substantial growth, projected to reach USD 7.16 billion by 2025. This expansion is driven by a robust Compound Annual Growth Rate (CAGR) of 9.29% expected over the forecast period of 2025-2033. Key growth drivers include the increasing demand for lightweight and high-strength materials across various industries, particularly aerospace and defense, automotive, and wind energy. Advancements in composite material technology and growing environmental consciousness, which favors the use of more sustainable and energy-efficient solutions, are also significant contributors. The market's upward trajectory is further bolstered by the growing adoption of composites in infrastructure and consumer goods, where their durability and performance advantages are increasingly recognized.

Core Materials for Composites Industry Market Size (In Billion)
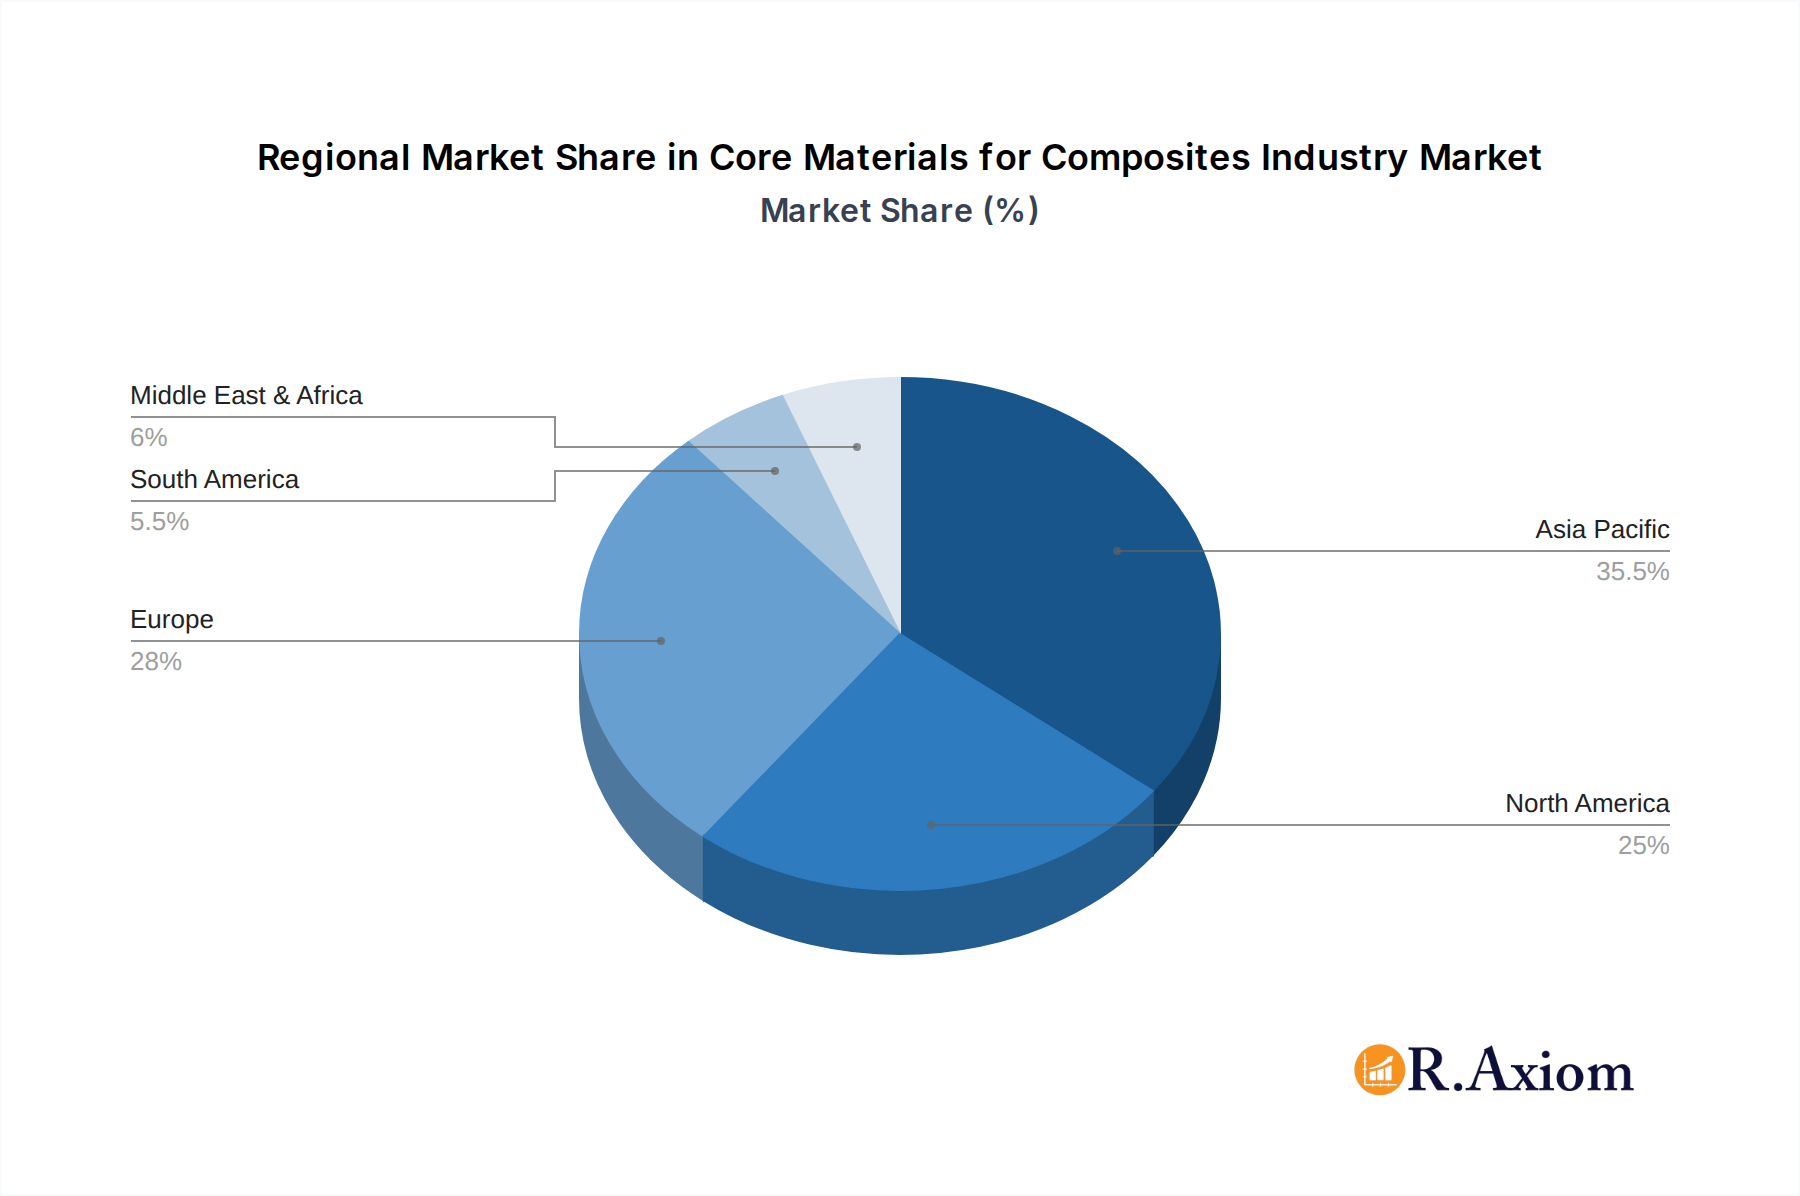
The market segmentation reveals a diverse landscape of core materials, with Foam Core (including PVC Foam, Polystyrene Foam, Polyurethane Foam, PMMA Foam, SAN Co-polymer Foam, and Other Thermoplastics) and Honeycomb (comprising Aluminum Honeycomb, Nomex Honeycomb, and Thermoplastic Honeycomb) holding significant shares. Wood-based cores, such as Balsa and other woods, also play a crucial role. Geographically, the Asia Pacific region is anticipated to dominate market growth, fueled by rapid industrialization and expanding manufacturing capabilities in countries like China and India. North America and Europe remain mature but significant markets, with continuous innovation and demand from established end-user industries. Challenges such as the fluctuating raw material prices and the high initial investment for composite manufacturing facilities could temper growth, but the overall outlook remains exceptionally positive due to the intrinsic advantages of advanced composite materials.
Core Materials for Composites Industry Company Market Share
Core Materials for Composites Industry Market Concentration & Innovation
The global Core Materials for Composites Industry is characterized by a moderate level of market concentration, with a few major players holding significant market share, estimated to be in the billions. Innovation is a key differentiator, driven by the increasing demand for lightweight, high-strength, and sustainable composite materials across diverse end-user industries. Regulatory frameworks, particularly those related to environmental sustainability and safety standards in sectors like aerospace and automotive, are shaping product development and market entry. The threat of product substitutes, while present, is relatively low due to the unique performance characteristics offered by advanced core materials. End-user trends, such as the drive for fuel efficiency and emission reduction, are directly influencing the demand for materials that enable lighter and stronger composite structures. Mergers and acquisitions (M&A) are a strategic tool for market expansion and consolidation, with deal values potentially reaching hundreds of billions.
- Market Share Analysis: Leading companies command substantial market shares, creating a competitive landscape that fosters innovation.
- Innovation Drivers: Growing demand for lightweighting, enhanced performance, and sustainable solutions are paramount.
- Regulatory Impact: Stricter environmental regulations and safety standards are influencing material selection and development.
- Product Substitutes: While some alternatives exist, specialized core materials offer performance advantages that are difficult to replicate.
- End-User Trends: Lightweighting in automotive and aerospace, along with renewable energy growth, are key demand influencers.
- M&A Activities: Strategic acquisitions are enhancing product portfolios, expanding geographical reach, and consolidating market positions.
Core Materials for Composites Industry Industry Trends & Insights
The Core Materials for Composites Industry is poised for robust growth, projected to achieve a Compound Annual Growth Rate (CAGR) of approximately xx% between the forecast period of 2025 and 2033. This expansion is fueled by an escalating demand for advanced composite materials that offer superior strength-to-weight ratios, durability, and corrosion resistance. The aerospace and defense sector continues to be a primary growth engine, driven by the development of next-generation aircraft and defense systems prioritizing fuel efficiency and performance. The wind energy industry presents another significant avenue for growth, with larger and more efficient wind turbine blades increasingly relying on lightweight composite structures. Furthermore, the automotive sector is witnessing a paradigm shift towards lightweighting solutions to meet stringent fuel economy standards and reduce carbon emissions, accelerating the adoption of composite materials in vehicle components.
Technological disruptions are playing a pivotal role in shaping the industry. Advancements in material science are leading to the development of novel core materials with enhanced properties, such as improved thermal insulation, fire resistance, and recyclability. The integration of smart technologies and sensors within composite structures is also an emerging trend, enabling real-time monitoring and predictive maintenance. Consumer preferences are increasingly leaning towards sustainable and eco-friendly products, prompting manufacturers to explore bio-based and recyclable core materials. This shift aligns with global sustainability initiatives and growing environmental consciousness.
Competitive dynamics within the Core Materials for Composites Industry are characterized by a blend of established global players and emerging regional manufacturers. Strategic partnerships, joint ventures, and investments in research and development are crucial for maintaining a competitive edge. Companies are focusing on optimizing their supply chains, enhancing production efficiencies, and expanding their product portfolios to cater to the diverse needs of their clientele. The market penetration of composite materials is expected to deepen across various applications, driven by a favorable cost-benefit analysis and the superior performance offered compared to traditional materials. The overall industry outlook remains exceptionally positive, with sustained innovation and expanding application areas promising significant market expansion in the coming years.
Dominant Markets & Segments in Core Materials for Composites Industry
The aerospace and defense end-user industry stands as a dominant market within the Core Materials for Composites Industry, driven by an unyielding demand for lightweight, high-performance materials. This sector's stringent requirements for structural integrity, fuel efficiency, and safety translate into substantial investments in advanced composite core materials. The forecast for this segment indicates a continued upward trajectory, with market penetration expected to increase significantly.
- Foam Core: Within the Foam Core segment, PVC Foam continues to hold a dominant position due to its excellent mechanical properties, good chemical resistance, and cost-effectiveness.
- PVC Foam: Widely adopted for its balance of strength, stiffness, and ease of processing.
- Polyurethane Foam: Valued for its lightweight properties and excellent insulation capabilities, particularly in applications requiring thermal and acoustic performance.
- SAN Co-polymer Foam: Gaining traction for its superior temperature resistance and structural integrity in demanding applications.
- Honeycomb: The Honeycomb segment is witnessing robust growth, particularly in applications requiring exceptional stiffness and strength at minimal weight.
- Aluminum Honeycomb: Dominates due to its high strength-to-weight ratio and excellent thermal conductivity, extensively used in aerospace interiors and structural components.
- Nomex Honeycomb: Favored in aerospace and defense for its fire resistance, low smoke emission, and excellent mechanical properties at elevated temperatures.
- Wood: While other segments are growing rapidly, Wood, specifically Balsa, maintains a significant presence in niche applications where its natural properties are advantageous.
- Balsa Wood: Remains a preferred choice for its lightweight, excellent insulation, and good compressive strength in specific marine and wind energy applications.
The wind energy sector is another pivotal market segment, propelled by the global push towards renewable energy sources. The increasing size and efficiency of wind turbine blades necessitate the use of lightweight and durable composite materials, driving substantial demand for core materials. Economic policies supporting renewable energy infrastructure and technological advancements in blade design are key drivers for this segment's dominance.
- Key Drivers for Wind Energy Dominance:
- Government Incentives & Subsidies: Favorable policies encouraging renewable energy deployment.
- Growing Demand for Sustainable Energy: Global commitment to reducing carbon emissions.
- Technological Advancements in Turbine Design: Development of larger, more efficient, and lightweight blades.
- Cost Reduction in Composite Manufacturing: Improvements in production processes leading to more competitive pricing.
The automotive industry is rapidly emerging as a key growth driver. The imperative to reduce vehicle weight for improved fuel efficiency and reduced emissions is spurring the adoption of composite materials in structural components, body panels, and interior parts. Regulatory pressures on emissions standards are directly influencing the demand for lightweighting solutions.
- Key Drivers for Automotive Dominance:
- Stringent Fuel Economy Standards: Regulatory mandates driving lightweighting initiatives.
- Electrification of Vehicles: Lightweighting is crucial for extending battery range in electric vehicles.
- Consumer Demand for Performance and Efficiency: Growing preference for fuel-efficient and high-performance vehicles.
- Advancements in Composite Manufacturing for Automotive: Development of high-volume, cost-effective composite solutions.
The construction industry is also presenting significant opportunities, with composite materials being increasingly used for their durability, corrosion resistance, and aesthetic versatility in applications such as facades, roofing, and structural reinforcements. Infrastructure development projects and a focus on sustainable building practices are contributing to the growth in this segment.
Core Materials for Composites Industry Product Developments
Product innovations in the Core Materials for Composites Industry are primarily focused on enhancing performance characteristics, improving sustainability, and reducing manufacturing costs. Key developments include the introduction of high-temperature resistant foams, advanced honeycomb structures with improved impact resistance, and bio-based or recyclable core materials. These advancements are driven by the evolving needs of end-user industries such as aerospace, where lightweighting and fire safety are paramount, and automotive, where fuel efficiency and crashworthiness are critical. The competitive advantage of new products lies in their ability to offer superior strength-to-weight ratios, improved environmental profiles, and ease of integration into complex composite manufacturing processes, thereby enabling the creation of lighter, stronger, and more sustainable composite structures.
Report Scope & Segmentation Analysis
This report provides a comprehensive analysis of the Core Materials for Composites Industry, segmented by Type and End-user Industry. The Type segmentation includes Foam Core (PVC Foam, Polystyrene Foam, Polyurethane Foam, PMMA Foam, SAN Co-polymer Foam, Other Thermoplastics), Honeycomb (Aluminum Honeycomb, Nomex Honeycomb, Thermoplastic Honeycomb), and Wood (Balsa, Other Woods). Each foam type offers distinct properties catering to specific application needs, with projections indicating steady growth driven by demand for lightweighting and insulation. Honeycomb structures, particularly aluminum and Nomex, are expected to see robust expansion due to their superior strength-to-weight ratios in high-performance applications.
The End-user Industry segmentation covers Aerospace and Defense, Marine, Construction, Wind Energy, Automotive, Consumer Goods, and Other End-user Industries. The Aerospace and Defense sector is projected to maintain its leadership position due to stringent performance requirements. Wind Energy and Automotive are anticipated to exhibit the highest growth rates, fueled by sustainability initiatives and lightweighting trends. Marine applications will continue to leverage core materials for durability and weight reduction, while the construction sector will see increasing adoption for sustainable building solutions.
Key Drivers of Core Materials for Composites Industry Growth
The growth of the Core Materials for Composites Industry is propelled by several key factors. Technological advancements in material science are leading to the development of core materials with enhanced performance characteristics, such as higher strength-to-weight ratios, improved fire resistance, and better thermal insulation. Economic factors, including increasing investments in renewable energy infrastructure (wind turbines) and the automotive sector's drive for fuel efficiency, significantly boost demand. Regulatory frameworks mandating reduced emissions and improved safety standards in industries like aerospace and automotive also act as strong growth catalysts. Furthermore, a global emphasis on sustainability and lightweighting across various sectors is fundamentally reshaping material selection, favoring advanced composite core materials.
Challenges in the Core Materials for Composites Industry Sector
Despite its robust growth, the Core Materials for Composites Industry faces several challenges. High raw material costs and their volatility can impact manufacturing expenses and profitability. Complex manufacturing processes and the need for specialized equipment can present barriers to entry for new players and limit scalability for some applications. Recycling and end-of-life management of composite materials remain a significant environmental challenge, requiring further innovation in sustainable disposal and reprocessing methods. Intense competition from established players and the emergence of new technologies can put pressure on pricing and market share. Additionally, stringent certification requirements, particularly in the aerospace sector, can prolong product development cycles and increase compliance costs.
Emerging Opportunities in Core Materials for Composites Industry
The Core Materials for Composites Industry is ripe with emerging opportunities driven by evolving market demands and technological progress. The growing global focus on sustainability and circular economy principles presents a significant opportunity for the development and adoption of bio-based and recyclable core materials. Advancements in additive manufacturing (3D printing) are opening new avenues for creating complex, customized core structures, enabling novel designs and applications. The expansion of electric vehicle (EV) production is creating substantial demand for lightweight materials to optimize battery range and vehicle performance. Furthermore, the increasing application of composites in infrastructure development and civil engineering, such as bridges and buildings, offers untapped market potential. The integration of smart functionalities into composite cores, enabling sensor integration and advanced monitoring, is another promising area for innovation and market growth.
Leading Players in the Core Materials for Composites Industry Market
- 3A Composites
- Armacell International SA
- Changzhou Tiansheng New Materials Co Ltd
- Diab International AB
- Euro-Composites SA
- Evonik Industries AG
- Gurit Holding AG
- Hexcel Corporation
- Plascore Incorporated
- Saertex GmbH & Co KG
- The Gill Corporation
Key Developments in Core Materials for Composites Industry Industry
- March 2024: Hexcel Corporation announced a new generation of lightweight structural adhesives for aerospace composites, enhancing manufacturing efficiency.
- February 2024: Armacell International SA launched an innovative, fire-retardant foam core material for high-performance marine applications.
- January 2024: Diab International AB expanded its production capacity for SAN Co-polymer Foam, responding to increased demand from the automotive sector.
- December 2023: Evonik Industries AG showcased advancements in recyclable thermoplastic core materials for sustainable composite solutions.
- November 2023: Gurit Holding AG acquired a key supplier of advanced composite tooling, strengthening its vertical integration.
- October 2023: 3A Composites introduced a new range of honeycomb panels with enhanced impact resistance for the construction industry.
- September 2023: Euro-Composites SA developed a novel ultra-lightweight honeycomb material for next-generation unmanned aerial vehicles (UAVs).
- August 2023: Saertex GmbH & Co KG partnered with a leading wind turbine manufacturer to supply specialized reinforcement fabrics for larger blades.
- July 2023: The Gill Corporation unveiled a new composite core material with superior thermal insulation properties for aerospace applications.
- June 2023: Plascore Incorporated reported significant growth in its balsa wood core business due to demand from the marine and renewable energy sectors.
Strategic Outlook for Core Materials for Composites Industry Market
The strategic outlook for the Core Materials for Composites Industry remains exceptionally positive, driven by sustained demand for lightweight, high-performance, and sustainable materials. Future growth will be significantly influenced by continuous innovation in material science, focusing on enhanced properties like superior strength-to-weight ratios, improved fire resistance, and advanced thermal management. The increasing adoption of composite materials in the rapidly expanding electric vehicle market, coupled with the ongoing growth in renewable energy sectors like wind power, will act as major growth catalysts. Furthermore, the industry's commitment to developing and integrating sustainable and recyclable core materials will be crucial for long-term success and market expansion, aligning with global environmental regulations and consumer preferences. Strategic collaborations, technological advancements in manufacturing, and a focus on emerging applications will define the competitive landscape and unlock new market opportunities.
Core Materials for Composites Industry Segmentation
-
1. Type
-
1.1. Foam Core
- 1.1.1. PVC Foam
- 1.1.2. Polystyrene Foam
- 1.1.3. Polyurethane Foam
- 1.1.4. PMMA Foam
- 1.1.5. SAN Co-polymer Foam
- 1.1.6. Other Thermoplastics
-
1.2. Honeycomb
- 1.2.1. Aluminum Honeycomb
- 1.2.2. Nomex Honeycomb
- 1.2.3. Thermoplastic Honeycomb
-
1.3. Wood
- 1.3.1. Balsa
- 1.3.2. Other Woods
-
1.1. Foam Core
-
2. End-user Industry
- 2.1. Aerospace and Defense
- 2.2. Marine
- 2.3. Construction
- 2.4. Wind Energy
- 2.5. Automotive
- 2.6. Consumer Goods
- 2.7. Other End-user Industries
Core Materials for Composites Industry Segmentation By Geography
-
1. Asia Pacific
- 1.1. China
- 1.2. India
- 1.3. Japan
- 1.4. South Korea
- 1.5. ASEAN Countries
- 1.6. Rest of Asia Pacific
-
2. North America
- 2.1. United States
- 2.2. Canada
- 2.3. Mexico
-
3. Europe
- 3.1. Germany
- 3.2. United Kingdom
- 3.3. Italy
- 3.4. France
- 3.5. Spain
- 3.6. Rest of Europe
-
4. South America
- 4.1. Brazil
- 4.2. Argentina
- 4.3. Rest of South America
- 5. Middle East
-
6. Saudi Arabia
- 6.1. South Africa
- 6.2. Rest of Middle East
Core Materials for Composites Industry Regional Market Share
Geographic Coverage of Core Materials for Composites Industry
Core Materials for Composites Industry REPORT HIGHLIGHTS
| Aspects | Details |
|---|---|
| Study Period | 2020-2034 |
| Base Year | 2025 |
| Estimated Year | 2026 |
| Forecast Period | 2026-2034 |
| Historical Period | 2020-2025 |
| Growth Rate | CAGR of 9.29% from 2020-2034 |
| Segmentation |
|
Table of Contents
- 1. Introduction
- 1.1. Research Scope
- 1.2. Market Segmentation
- 1.3. Research Objective
- 1.4. Definitions and Assumptions
- 2. Executive Summary
- 2.1. Market Snapshot
- 3. Market Dynamics
- 3.1. Market Drivers
- 3.2. Market Restrains
- 3.3. Market Trends
- 3.4. Market Opportunities
- 4. Market Factor Analysis
- 4.1. Porters Five Forces
- 4.1.1. Bargaining Power of Suppliers
- 4.1.2. Bargaining Power of Buyers
- 4.1.3. Threat of New Entrants
- 4.1.4. Threat of Substitutes
- 4.1.5. Competitive Rivalry
- 4.2. PESTEL analysis
- 4.3. BCG Analysis
- 4.3.1. Stars (High Growth, High Market Share)
- 4.3.2. Cash Cows (Low Growth, High Market Share)
- 4.3.3. Question Mark (High Growth, Low Market Share)
- 4.3.4. Dogs (Low Growth, Low Market Share)
- 4.4. Ansoff Matrix Analysis
- 4.5. Supply Chain Analysis
- 4.6. Regulatory Landscape
- 4.7. Current Market Potential and Opportunity Assessment (TAM–SAM–SOM Framework)
- 4.8. RAX Analyst Note
- 4.1. Porters Five Forces
- 5. Market Analysis, Insights and Forecast 2021-2033
- 5.1. Market Analysis, Insights and Forecast - by Type
- 5.1.1. Foam Core
- 5.1.1.1. PVC Foam
- 5.1.1.2. Polystyrene Foam
- 5.1.1.3. Polyurethane Foam
- 5.1.1.4. PMMA Foam
- 5.1.1.5. SAN Co-polymer Foam
- 5.1.1.6. Other Thermoplastics
- 5.1.2. Honeycomb
- 5.1.2.1. Aluminum Honeycomb
- 5.1.2.2. Nomex Honeycomb
- 5.1.2.3. Thermoplastic Honeycomb
- 5.1.3. Wood
- 5.1.3.1. Balsa
- 5.1.3.2. Other Woods
- 5.1.1. Foam Core
- 5.2. Market Analysis, Insights and Forecast - by End-user Industry
- 5.2.1. Aerospace and Defense
- 5.2.2. Marine
- 5.2.3. Construction
- 5.2.4. Wind Energy
- 5.2.5. Automotive
- 5.2.6. Consumer Goods
- 5.2.7. Other End-user Industries
- 5.3. Market Analysis, Insights and Forecast - by Region
- 5.3.1. Asia Pacific
- 5.3.2. North America
- 5.3.3. Europe
- 5.3.4. South America
- 5.3.5. Middle East
- 5.3.6. Saudi Arabia
- 5.1. Market Analysis, Insights and Forecast - by Type
- 6. Global Core Materials for Composites Industry Analysis, Insights and Forecast, 2021-2033
- 6.1. Market Analysis, Insights and Forecast - by Type
- 6.1.1. Foam Core
- 6.1.1.1. PVC Foam
- 6.1.1.2. Polystyrene Foam
- 6.1.1.3. Polyurethane Foam
- 6.1.1.4. PMMA Foam
- 6.1.1.5. SAN Co-polymer Foam
- 6.1.1.6. Other Thermoplastics
- 6.1.2. Honeycomb
- 6.1.2.1. Aluminum Honeycomb
- 6.1.2.2. Nomex Honeycomb
- 6.1.2.3. Thermoplastic Honeycomb
- 6.1.3. Wood
- 6.1.3.1. Balsa
- 6.1.3.2. Other Woods
- 6.1.1. Foam Core
- 6.2. Market Analysis, Insights and Forecast - by End-user Industry
- 6.2.1. Aerospace and Defense
- 6.2.2. Marine
- 6.2.3. Construction
- 6.2.4. Wind Energy
- 6.2.5. Automotive
- 6.2.6. Consumer Goods
- 6.2.7. Other End-user Industries
- 6.1. Market Analysis, Insights and Forecast - by Type
- 7. Asia Pacific Core Materials for Composites Industry Analysis, Insights and Forecast, 2020-2032
- 7.1. Market Analysis, Insights and Forecast - by Type
- 7.1.1. Foam Core
- 7.1.1.1. PVC Foam
- 7.1.1.2. Polystyrene Foam
- 7.1.1.3. Polyurethane Foam
- 7.1.1.4. PMMA Foam
- 7.1.1.5. SAN Co-polymer Foam
- 7.1.1.6. Other Thermoplastics
- 7.1.2. Honeycomb
- 7.1.2.1. Aluminum Honeycomb
- 7.1.2.2. Nomex Honeycomb
- 7.1.2.3. Thermoplastic Honeycomb
- 7.1.3. Wood
- 7.1.3.1. Balsa
- 7.1.3.2. Other Woods
- 7.1.1. Foam Core
- 7.2. Market Analysis, Insights and Forecast - by End-user Industry
- 7.2.1. Aerospace and Defense
- 7.2.2. Marine
- 7.2.3. Construction
- 7.2.4. Wind Energy
- 7.2.5. Automotive
- 7.2.6. Consumer Goods
- 7.2.7. Other End-user Industries
- 7.1. Market Analysis, Insights and Forecast - by Type
- 8. North America Core Materials for Composites Industry Analysis, Insights and Forecast, 2020-2032
- 8.1. Market Analysis, Insights and Forecast - by Type
- 8.1.1. Foam Core
- 8.1.1.1. PVC Foam
- 8.1.1.2. Polystyrene Foam
- 8.1.1.3. Polyurethane Foam
- 8.1.1.4. PMMA Foam
- 8.1.1.5. SAN Co-polymer Foam
- 8.1.1.6. Other Thermoplastics
- 8.1.2. Honeycomb
- 8.1.2.1. Aluminum Honeycomb
- 8.1.2.2. Nomex Honeycomb
- 8.1.2.3. Thermoplastic Honeycomb
- 8.1.3. Wood
- 8.1.3.1. Balsa
- 8.1.3.2. Other Woods
- 8.1.1. Foam Core
- 8.2. Market Analysis, Insights and Forecast - by End-user Industry
- 8.2.1. Aerospace and Defense
- 8.2.2. Marine
- 8.2.3. Construction
- 8.2.4. Wind Energy
- 8.2.5. Automotive
- 8.2.6. Consumer Goods
- 8.2.7. Other End-user Industries
- 8.1. Market Analysis, Insights and Forecast - by Type
- 9. Europe Core Materials for Composites Industry Analysis, Insights and Forecast, 2020-2032
- 9.1. Market Analysis, Insights and Forecast - by Type
- 9.1.1. Foam Core
- 9.1.1.1. PVC Foam
- 9.1.1.2. Polystyrene Foam
- 9.1.1.3. Polyurethane Foam
- 9.1.1.4. PMMA Foam
- 9.1.1.5. SAN Co-polymer Foam
- 9.1.1.6. Other Thermoplastics
- 9.1.2. Honeycomb
- 9.1.2.1. Aluminum Honeycomb
- 9.1.2.2. Nomex Honeycomb
- 9.1.2.3. Thermoplastic Honeycomb
- 9.1.3. Wood
- 9.1.3.1. Balsa
- 9.1.3.2. Other Woods
- 9.1.1. Foam Core
- 9.2. Market Analysis, Insights and Forecast - by End-user Industry
- 9.2.1. Aerospace and Defense
- 9.2.2. Marine
- 9.2.3. Construction
- 9.2.4. Wind Energy
- 9.2.5. Automotive
- 9.2.6. Consumer Goods
- 9.2.7. Other End-user Industries
- 9.1. Market Analysis, Insights and Forecast - by Type
- 10. South America Core Materials for Composites Industry Analysis, Insights and Forecast, 2020-2032
- 10.1. Market Analysis, Insights and Forecast - by Type
- 10.1.1. Foam Core
- 10.1.1.1. PVC Foam
- 10.1.1.2. Polystyrene Foam
- 10.1.1.3. Polyurethane Foam
- 10.1.1.4. PMMA Foam
- 10.1.1.5. SAN Co-polymer Foam
- 10.1.1.6. Other Thermoplastics
- 10.1.2. Honeycomb
- 10.1.2.1. Aluminum Honeycomb
- 10.1.2.2. Nomex Honeycomb
- 10.1.2.3. Thermoplastic Honeycomb
- 10.1.3. Wood
- 10.1.3.1. Balsa
- 10.1.3.2. Other Woods
- 10.1.1. Foam Core
- 10.2. Market Analysis, Insights and Forecast - by End-user Industry
- 10.2.1. Aerospace and Defense
- 10.2.2. Marine
- 10.2.3. Construction
- 10.2.4. Wind Energy
- 10.2.5. Automotive
- 10.2.6. Consumer Goods
- 10.2.7. Other End-user Industries
- 10.1. Market Analysis, Insights and Forecast - by Type
- 11. Middle East Core Materials for Composites Industry Analysis, Insights and Forecast, 2020-2032
- 11.1. Market Analysis, Insights and Forecast - by Type
- 11.1.1. Foam Core
- 11.1.1.1. PVC Foam
- 11.1.1.2. Polystyrene Foam
- 11.1.1.3. Polyurethane Foam
- 11.1.1.4. PMMA Foam
- 11.1.1.5. SAN Co-polymer Foam
- 11.1.1.6. Other Thermoplastics
- 11.1.2. Honeycomb
- 11.1.2.1. Aluminum Honeycomb
- 11.1.2.2. Nomex Honeycomb
- 11.1.2.3. Thermoplastic Honeycomb
- 11.1.3. Wood
- 11.1.3.1. Balsa
- 11.1.3.2. Other Woods
- 11.1.1. Foam Core
- 11.2. Market Analysis, Insights and Forecast - by End-user Industry
- 11.2.1. Aerospace and Defense
- 11.2.2. Marine
- 11.2.3. Construction
- 11.2.4. Wind Energy
- 11.2.5. Automotive
- 11.2.6. Consumer Goods
- 11.2.7. Other End-user Industries
- 11.1. Market Analysis, Insights and Forecast - by Type
- 12. Saudi Arabia Core Materials for Composites Industry Analysis, Insights and Forecast, 2020-2032
- 12.1. Market Analysis, Insights and Forecast - by Type
- 12.1.1. Foam Core
- 12.1.1.1. PVC Foam
- 12.1.1.2. Polystyrene Foam
- 12.1.1.3. Polyurethane Foam
- 12.1.1.4. PMMA Foam
- 12.1.1.5. SAN Co-polymer Foam
- 12.1.1.6. Other Thermoplastics
- 12.1.2. Honeycomb
- 12.1.2.1. Aluminum Honeycomb
- 12.1.2.2. Nomex Honeycomb
- 12.1.2.3. Thermoplastic Honeycomb
- 12.1.3. Wood
- 12.1.3.1. Balsa
- 12.1.3.2. Other Woods
- 12.1.1. Foam Core
- 12.2. Market Analysis, Insights and Forecast - by End-user Industry
- 12.2.1. Aerospace and Defense
- 12.2.2. Marine
- 12.2.3. Construction
- 12.2.4. Wind Energy
- 12.2.5. Automotive
- 12.2.6. Consumer Goods
- 12.2.7. Other End-user Industries
- 12.1. Market Analysis, Insights and Forecast - by Type
- 13. Competitive Analysis
- 13.1. Company Profiles
- 13.1.1 3A Composites
- 13.1.1.1. Company Overview
- 13.1.1.2. Products
- 13.1.1.3. Company Financials
- 13.1.1.4. SWOT Analysis
- 13.1.2 Armacell International SA
- 13.1.2.1. Company Overview
- 13.1.2.2. Products
- 13.1.2.3. Company Financials
- 13.1.2.4. SWOT Analysis
- 13.1.3 Changzhou Tiansheng New Materials Co Ltd
- 13.1.3.1. Company Overview
- 13.1.3.2. Products
- 13.1.3.3. Company Financials
- 13.1.3.4. SWOT Analysis
- 13.1.4 Diab International AB
- 13.1.4.1. Company Overview
- 13.1.4.2. Products
- 13.1.4.3. Company Financials
- 13.1.4.4. SWOT Analysis
- 13.1.5 Euro-Composites SA
- 13.1.5.1. Company Overview
- 13.1.5.2. Products
- 13.1.5.3. Company Financials
- 13.1.5.4. SWOT Analysis
- 13.1.6 Evonik Industries AG
- 13.1.6.1. Company Overview
- 13.1.6.2. Products
- 13.1.6.3. Company Financials
- 13.1.6.4. SWOT Analysis
- 13.1.7 Gurit Holding AG
- 13.1.7.1. Company Overview
- 13.1.7.2. Products
- 13.1.7.3. Company Financials
- 13.1.7.4. SWOT Analysis
- 13.1.8 Hexcel Corporation
- 13.1.8.1. Company Overview
- 13.1.8.2. Products
- 13.1.8.3. Company Financials
- 13.1.8.4. SWOT Analysis
- 13.1.9 Plascore Incorporated
- 13.1.9.1. Company Overview
- 13.1.9.2. Products
- 13.1.9.3. Company Financials
- 13.1.9.4. SWOT Analysis
- 13.1.10 Saertex GmbH & Co KG
- 13.1.10.1. Company Overview
- 13.1.10.2. Products
- 13.1.10.3. Company Financials
- 13.1.10.4. SWOT Analysis
- 13.1.11 The Gill Corporation*List Not Exhaustive
- 13.1.11.1. Company Overview
- 13.1.11.2. Products
- 13.1.11.3. Company Financials
- 13.1.11.4. SWOT Analysis
- 13.1.1 3A Composites
- 13.2. Market Entropy
- 13.2.1 Company's Key Areas Served
- 13.2.2 Recent Developments
- 13.3. Company Market Share Analysis 2025
- 13.3.1 Top 5 Companies Market Share Analysis
- 13.3.2 Top 3 Companies Market Share Analysis
- 13.4. List of Potential Customers
- 14. Research Methodology
List of Figures
- Figure 1: Global Core Materials for Composites Industry Revenue Breakdown (billion, %) by Region 2025 & 2033
- Figure 2: Asia Pacific Core Materials for Composites Industry Revenue (billion), by Type 2025 & 2033
- Figure 3: Asia Pacific Core Materials for Composites Industry Revenue Share (%), by Type 2025 & 2033
- Figure 4: Asia Pacific Core Materials for Composites Industry Revenue (billion), by End-user Industry 2025 & 2033
- Figure 5: Asia Pacific Core Materials for Composites Industry Revenue Share (%), by End-user Industry 2025 & 2033
- Figure 6: Asia Pacific Core Materials for Composites Industry Revenue (billion), by Country 2025 & 2033
- Figure 7: Asia Pacific Core Materials for Composites Industry Revenue Share (%), by Country 2025 & 2033
- Figure 8: North America Core Materials for Composites Industry Revenue (billion), by Type 2025 & 2033
- Figure 9: North America Core Materials for Composites Industry Revenue Share (%), by Type 2025 & 2033
- Figure 10: North America Core Materials for Composites Industry Revenue (billion), by End-user Industry 2025 & 2033
- Figure 11: North America Core Materials for Composites Industry Revenue Share (%), by End-user Industry 2025 & 2033
- Figure 12: North America Core Materials for Composites Industry Revenue (billion), by Country 2025 & 2033
- Figure 13: North America Core Materials for Composites Industry Revenue Share (%), by Country 2025 & 2033
- Figure 14: Europe Core Materials for Composites Industry Revenue (billion), by Type 2025 & 2033
- Figure 15: Europe Core Materials for Composites Industry Revenue Share (%), by Type 2025 & 2033
- Figure 16: Europe Core Materials for Composites Industry Revenue (billion), by End-user Industry 2025 & 2033
- Figure 17: Europe Core Materials for Composites Industry Revenue Share (%), by End-user Industry 2025 & 2033
- Figure 18: Europe Core Materials for Composites Industry Revenue (billion), by Country 2025 & 2033
- Figure 19: Europe Core Materials for Composites Industry Revenue Share (%), by Country 2025 & 2033
- Figure 20: South America Core Materials for Composites Industry Revenue (billion), by Type 2025 & 2033
- Figure 21: South America Core Materials for Composites Industry Revenue Share (%), by Type 2025 & 2033
- Figure 22: South America Core Materials for Composites Industry Revenue (billion), by End-user Industry 2025 & 2033
- Figure 23: South America Core Materials for Composites Industry Revenue Share (%), by End-user Industry 2025 & 2033
- Figure 24: South America Core Materials for Composites Industry Revenue (billion), by Country 2025 & 2033
- Figure 25: South America Core Materials for Composites Industry Revenue Share (%), by Country 2025 & 2033
- Figure 26: Middle East Core Materials for Composites Industry Revenue (billion), by Type 2025 & 2033
- Figure 27: Middle East Core Materials for Composites Industry Revenue Share (%), by Type 2025 & 2033
- Figure 28: Middle East Core Materials for Composites Industry Revenue (billion), by End-user Industry 2025 & 2033
- Figure 29: Middle East Core Materials for Composites Industry Revenue Share (%), by End-user Industry 2025 & 2033
- Figure 30: Middle East Core Materials for Composites Industry Revenue (billion), by Country 2025 & 2033
- Figure 31: Middle East Core Materials for Composites Industry Revenue Share (%), by Country 2025 & 2033
- Figure 32: Saudi Arabia Core Materials for Composites Industry Revenue (billion), by Type 2025 & 2033
- Figure 33: Saudi Arabia Core Materials for Composites Industry Revenue Share (%), by Type 2025 & 2033
- Figure 34: Saudi Arabia Core Materials for Composites Industry Revenue (billion), by End-user Industry 2025 & 2033
- Figure 35: Saudi Arabia Core Materials for Composites Industry Revenue Share (%), by End-user Industry 2025 & 2033
- Figure 36: Saudi Arabia Core Materials for Composites Industry Revenue (billion), by Country 2025 & 2033
- Figure 37: Saudi Arabia Core Materials for Composites Industry Revenue Share (%), by Country 2025 & 2033
List of Tables
- Table 1: Global Core Materials for Composites Industry Revenue billion Forecast, by Type 2020 & 2033
- Table 2: Global Core Materials for Composites Industry Revenue billion Forecast, by End-user Industry 2020 & 2033
- Table 3: Global Core Materials for Composites Industry Revenue billion Forecast, by Region 2020 & 2033
- Table 4: Global Core Materials for Composites Industry Revenue billion Forecast, by Type 2020 & 2033
- Table 5: Global Core Materials for Composites Industry Revenue billion Forecast, by End-user Industry 2020 & 2033
- Table 6: Global Core Materials for Composites Industry Revenue billion Forecast, by Country 2020 & 2033
- Table 7: China Core Materials for Composites Industry Revenue (billion) Forecast, by Application 2020 & 2033
- Table 8: India Core Materials for Composites Industry Revenue (billion) Forecast, by Application 2020 & 2033
- Table 9: Japan Core Materials for Composites Industry Revenue (billion) Forecast, by Application 2020 & 2033
- Table 10: South Korea Core Materials for Composites Industry Revenue (billion) Forecast, by Application 2020 & 2033
- Table 11: ASEAN Countries Core Materials for Composites Industry Revenue (billion) Forecast, by Application 2020 & 2033
- Table 12: Rest of Asia Pacific Core Materials for Composites Industry Revenue (billion) Forecast, by Application 2020 & 2033
- Table 13: Global Core Materials for Composites Industry Revenue billion Forecast, by Type 2020 & 2033
- Table 14: Global Core Materials for Composites Industry Revenue billion Forecast, by End-user Industry 2020 & 2033
- Table 15: Global Core Materials for Composites Industry Revenue billion Forecast, by Country 2020 & 2033
- Table 16: United States Core Materials for Composites Industry Revenue (billion) Forecast, by Application 2020 & 2033
- Table 17: Canada Core Materials for Composites Industry Revenue (billion) Forecast, by Application 2020 & 2033
- Table 18: Mexico Core Materials for Composites Industry Revenue (billion) Forecast, by Application 2020 & 2033
- Table 19: Global Core Materials for Composites Industry Revenue billion Forecast, by Type 2020 & 2033
- Table 20: Global Core Materials for Composites Industry Revenue billion Forecast, by End-user Industry 2020 & 2033
- Table 21: Global Core Materials for Composites Industry Revenue billion Forecast, by Country 2020 & 2033
- Table 22: Germany Core Materials for Composites Industry Revenue (billion) Forecast, by Application 2020 & 2033
- Table 23: United Kingdom Core Materials for Composites Industry Revenue (billion) Forecast, by Application 2020 & 2033
- Table 24: Italy Core Materials for Composites Industry Revenue (billion) Forecast, by Application 2020 & 2033
- Table 25: France Core Materials for Composites Industry Revenue (billion) Forecast, by Application 2020 & 2033
- Table 26: Spain Core Materials for Composites Industry Revenue (billion) Forecast, by Application 2020 & 2033
- Table 27: Rest of Europe Core Materials for Composites Industry Revenue (billion) Forecast, by Application 2020 & 2033
- Table 28: Global Core Materials for Composites Industry Revenue billion Forecast, by Type 2020 & 2033
- Table 29: Global Core Materials for Composites Industry Revenue billion Forecast, by End-user Industry 2020 & 2033
- Table 30: Global Core Materials for Composites Industry Revenue billion Forecast, by Country 2020 & 2033
- Table 31: Brazil Core Materials for Composites Industry Revenue (billion) Forecast, by Application 2020 & 2033
- Table 32: Argentina Core Materials for Composites Industry Revenue (billion) Forecast, by Application 2020 & 2033
- Table 33: Rest of South America Core Materials for Composites Industry Revenue (billion) Forecast, by Application 2020 & 2033
- Table 34: Global Core Materials for Composites Industry Revenue billion Forecast, by Type 2020 & 2033
- Table 35: Global Core Materials for Composites Industry Revenue billion Forecast, by End-user Industry 2020 & 2033
- Table 36: Global Core Materials for Composites Industry Revenue billion Forecast, by Country 2020 & 2033
- Table 37: Global Core Materials for Composites Industry Revenue billion Forecast, by Type 2020 & 2033
- Table 38: Global Core Materials for Composites Industry Revenue billion Forecast, by End-user Industry 2020 & 2033
- Table 39: Global Core Materials for Composites Industry Revenue billion Forecast, by Country 2020 & 2033
- Table 40: South Africa Core Materials for Composites Industry Revenue (billion) Forecast, by Application 2020 & 2033
- Table 41: Rest of Middle East Core Materials for Composites Industry Revenue (billion) Forecast, by Application 2020 & 2033
Frequently Asked Questions
1. What is the projected Compound Annual Growth Rate (CAGR) of the Core Materials for Composites Industry?
The projected CAGR is approximately 9.29%.
2. Which companies are prominent players in the Core Materials for Composites Industry?
Key companies in the market include 3A Composites, Armacell International SA, Changzhou Tiansheng New Materials Co Ltd, Diab International AB, Euro-Composites SA, Evonik Industries AG, Gurit Holding AG, Hexcel Corporation, Plascore Incorporated, Saertex GmbH & Co KG, The Gill Corporation*List Not Exhaustive.
3. What are the main segments of the Core Materials for Composites Industry?
The market segments include Type, End-user Industry.
4. Can you provide details about the market size?
The market size is estimated to be USD 7.16 billion as of 2022.
5. What are some drivers contributing to market growth?
; Increasing Demand from the Wind Energy Domain; Increasing Use of Composites in the Aerospace Industry; Emerging Applications in the Automotive Market.
6. What are the notable trends driving market growth?
Growing Usage in Aerospace and Defense Sector.
7. Are there any restraints impacting market growth?
; Increasing Demand from the Wind Energy Domain; Increasing Use of Composites in the Aerospace Industry; Emerging Applications in the Automotive Market.
8. Can you provide examples of recent developments in the market?
N/A
9. What pricing options are available for accessing the report?
Pricing options include single-user, multi-user, and enterprise licenses priced at USD 4750, USD 5250, and USD 8750 respectively.
10. Is the market size provided in terms of value or volume?
The market size is provided in terms of value, measured in billion.
11. Are there any specific market keywords associated with the report?
Yes, the market keyword associated with the report is "Core Materials for Composites Industry," which aids in identifying and referencing the specific market segment covered.
12. How do I determine which pricing option suits my needs best?
The pricing options vary based on user requirements and access needs. Individual users may opt for single-user licenses, while businesses requiring broader access may choose multi-user or enterprise licenses for cost-effective access to the report.
13. Are there any additional resources or data provided in the Core Materials for Composites Industry report?
While the report offers comprehensive insights, it's advisable to review the specific contents or supplementary materials provided to ascertain if additional resources or data are available.
14. How can I stay updated on further developments or reports in the Core Materials for Composites Industry?
To stay informed about further developments, trends, and reports in the Core Materials for Composites Industry, consider subscribing to industry newsletters, following relevant companies and organizations, or regularly checking reputable industry news sources and publications.
Methodology
Step 1 - Identification of Relevant Samples Size from Population Database


Step 2 - Approaches for Defining Global Market Size (Value, Volume* & Price*)

Note*: In applicable scenarios
Step 3 - Data Sources
Primary Research
- Web Analytics
- Survey Reports
- Research Institute
- Latest Research Reports
- Opinion Leaders
Secondary Research
- Annual Reports
- White Paper
- Latest Press Release
- Industry Association
- Paid Database
- Investor Presentations

Step 4 - Data Triangulation
Involves using different sources of information in order to increase the validity of a study
These sources are likely to be stakeholders in a program - participants, other researchers, program staff, other community members, and so on.
Then we put all data in single framework & apply various statistical tools to find out the dynamic on the market.
During the analysis stage, feedback from the stakeholder groups would be compared to determine areas of agreement as well as areas of divergence