
Key Insights
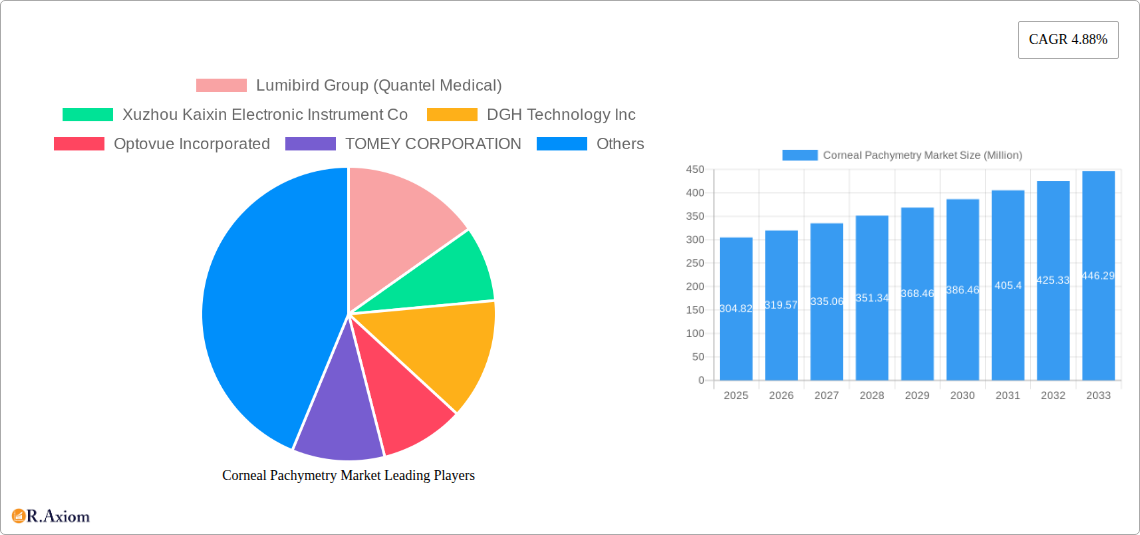
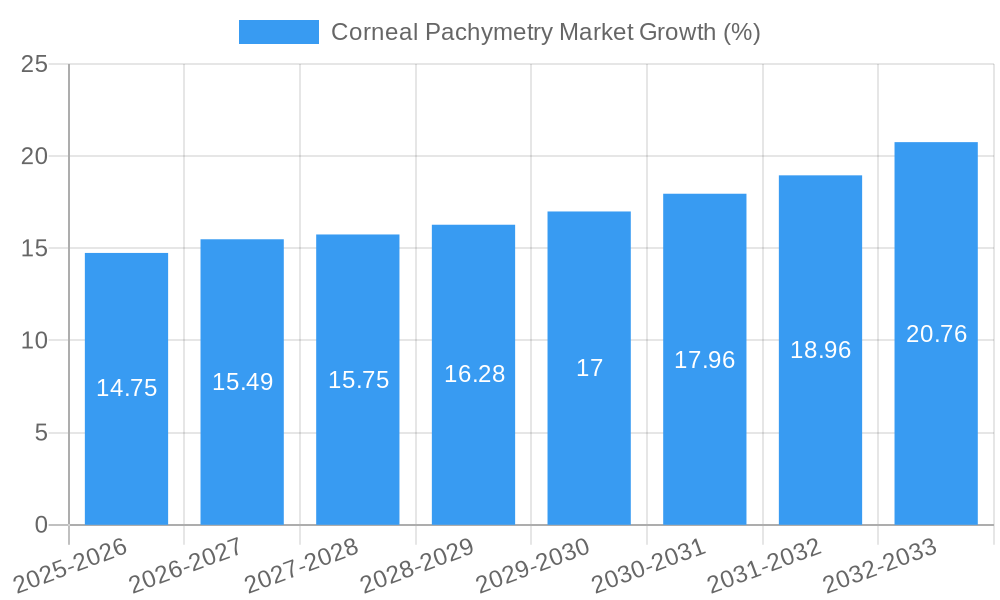
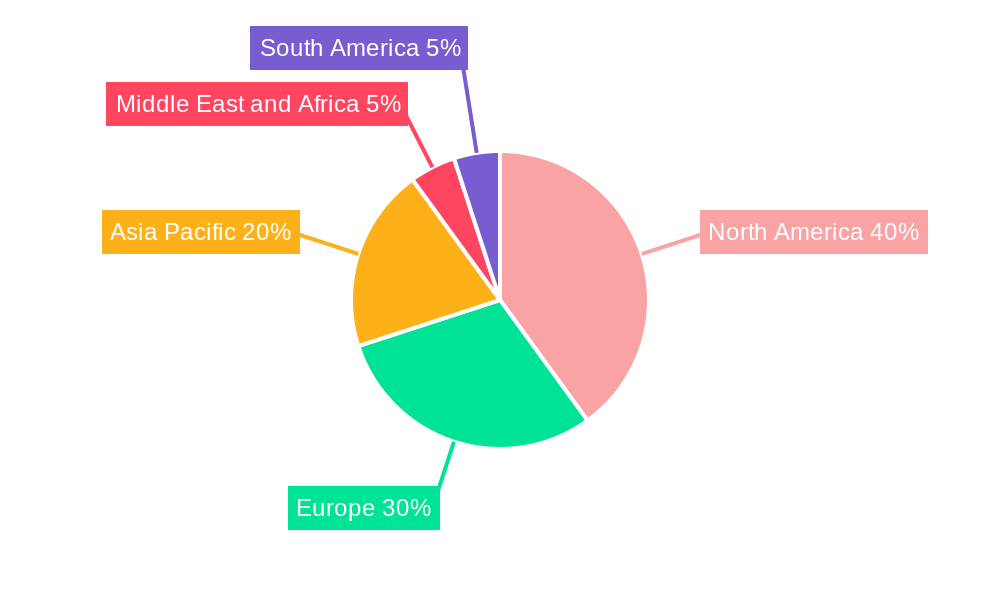
The global corneal pachymetry market, valued at $304.82 million in 2025, is projected to experience robust growth, driven by a rising prevalence of refractive errors and glaucoma, increasing demand for advanced diagnostic tools in ophthalmology, and technological advancements in pachymetry devices offering improved accuracy and efficiency. The market's Compound Annual Growth Rate (CAGR) of 4.88% from 2025 to 2033 signifies a steady expansion, fueled by the adoption of minimally invasive refractive surgeries and the growing geriatric population susceptible to glaucoma. The ultrasonic method currently dominates the market due to its established presence and cost-effectiveness, while the optical method segment is anticipated to witness significant growth owing to its superior image quality and precision. Geographically, North America and Europe currently hold substantial market shares due to advanced healthcare infrastructure and high adoption rates of advanced diagnostic technologies. However, the Asia-Pacific region is expected to demonstrate the fastest growth in the coming years, driven by rising healthcare expenditure, increasing awareness of eye health, and expanding ophthalmology services. Key players, including Lumibird Group (Quantel Medical), Optovue Incorporated, and Topcon Corporation, are actively engaged in research and development, focusing on introducing innovative products to enhance market competitiveness.
The competitive landscape is characterized by both established players and emerging companies striving to enhance their product portfolios and expand their market reach through strategic partnerships and acquisitions. Technological advancements, such as integration of artificial intelligence and improved image processing capabilities, are expected to further refine the accuracy and efficiency of corneal pachymetry devices. Regulatory approvals and reimbursement policies play a significant role in determining market accessibility, and manufacturers are focused on complying with relevant guidelines to ensure market penetration. While challenges such as the relatively high cost of advanced pachymetry systems and the need for skilled professionals to operate these devices exist, the overall market outlook remains positive, anticipating considerable growth driven by the factors mentioned above.
Corneal Pachymetry Market: A Comprehensive Report (2019-2033)
This comprehensive report provides an in-depth analysis of the Corneal Pachymetry market, offering actionable insights for industry stakeholders. Covering the period 2019-2033, with a base year of 2025 and a forecast period of 2025-2033, this report examines market dynamics, competitive landscape, and future growth prospects. The report segments the market by type (Ultrasonic Method, Optical Method) and application (Refractive Surgery, Glaucoma Diagnostics), providing granular data and analysis for strategic decision-making. Key players like Lumibird Group (Quantel Medical), Xuzhou Kaixin Electronic Instrument Co, DGH Technology Inc, Optovue Incorporated, TOMEY CORPORATION, Reichert Inc, Carl Zeiss AG, Sonomed Escalon, Topcon Corporation, and NIDEK CO LTD are profiled, offering a thorough understanding of their market positions and strategies. The report also analyses recent industry developments, providing a clear picture of the market's current state and future trajectory. The projected market size for 2025 is estimated to be xx Million, with a xx% CAGR expected during the forecast period.
Corneal Pachymetry Market Concentration & Innovation
The Corneal Pachymetry market exhibits a moderately concentrated landscape, with the top five players holding an estimated xx% market share in 2024. Innovation is driven by the need for improved accuracy, portability, and integration with other ophthalmic devices. Regulatory frameworks, such as those set by the FDA and equivalent international bodies, significantly influence product development and market access. Substitutes, while limited, include manual pachymetry methods, which are less accurate and less efficient. End-user trends lean towards non-invasive techniques and increased demand for comprehensive diagnostic solutions. M&A activity has been relatively modest in recent years, with deal values averaging xx Million per transaction (2019-2024). However, strategic partnerships and collaborations are increasingly common, driving innovation and market expansion.
- Market Concentration: Top 5 players hold an estimated xx% market share (2024).
- Innovation Drivers: Improved accuracy, portability, integration with other devices.
- Regulatory Landscape: FDA, equivalent international bodies influence product development.
- M&A Activity: Average deal value xx Million (2019-2024).
Corneal Pachymetry Market Industry Trends & Insights
The global Corneal Pachymetry market is experiencing robust growth, driven by increasing prevalence of refractive errors and glaucoma, coupled with rising demand for advanced diagnostic tools. Technological advancements, including the development of optical coherence tomography (OCT) based pachymetry systems, are enhancing accuracy and efficiency. Consumer preferences are shifting towards non-invasive, user-friendly, and cost-effective solutions. Competitive dynamics are characterized by intense rivalry, with companies focusing on product differentiation, technological innovation, and strategic partnerships to gain a competitive edge. The market is witnessing a shift towards integrated platforms combining pachymetry with other diagnostic functionalities. The compound annual growth rate (CAGR) for the period 2025-2033 is projected to be xx%, with significant market penetration anticipated in developing economies.
Dominant Markets & Segments in Corneal Pachymetry Market
North America currently dominates the Corneal Pachymetry market, driven by high healthcare expenditure, advanced technological infrastructure, and a large patient pool. However, Asia-Pacific is expected to witness substantial growth in the coming years, fueled by rising disposable incomes, improved healthcare infrastructure, and growing awareness of ophthalmic diseases.
By Type:
- Ultrasonic Method: This segment holds a larger market share currently due to its established presence and relatively lower cost. However, the optical method is gaining traction due to its superior accuracy and non-invasive nature.
- Optical Method: This segment is experiencing faster growth due to advantages in accuracy and ease of use. Technological advancements in optical coherence tomography (OCT) are further fueling this segment's expansion.
By Application:
- Refractive Surgery: This segment represents a substantial market share, driven by the increasing prevalence of refractive errors and the rising adoption of LASIK and other refractive procedures.
- Glaucoma Diagnostics: This segment is experiencing robust growth, driven by the rising prevalence of glaucoma and the increasing demand for early and accurate diagnosis.
Key Drivers for Dominance:
- North America: High healthcare expenditure, advanced infrastructure, large patient pool.
- Asia-Pacific: Rising disposable incomes, improving healthcare infrastructure, growing awareness.
Corneal Pachymetry Market Product Developments
Recent product innovations focus on enhancing accuracy, speed, and ease of use. Many new devices integrate multiple functionalities, combining pachymetry with other diagnostic tests, creating comprehensive ophthalmic solutions. This trend towards integrated platforms offers significant competitive advantages by streamlining workflows and providing a more holistic patient assessment. The market is also seeing the development of portable and wireless devices, catering to the needs of mobile clinics and remote healthcare settings.
Report Scope & Segmentation Analysis
This report provides a detailed segmentation of the Corneal Pachymetry market by type (Ultrasonic Method and Optical Method) and application (Refractive Surgery and Glaucoma Diagnostics). Growth projections, market sizes, and competitive dynamics are analyzed for each segment. The Ultrasonic Method segment is currently larger but the Optical Method is growing faster, driven by technological advancements. Similarly, the Refractive Surgery application segment holds a significant market share, but the Glaucoma Diagnostics segment is showing high growth potential due to increasing awareness and incidence of glaucoma. Each segment's competitive landscape is analyzed, identifying key players and their market strategies.
Key Drivers of Corneal Pachymetry Market Growth
Several factors are driving the growth of the Corneal Pachymetry market. These include:
- Technological advancements: Development of highly accurate and user-friendly devices.
- Rising prevalence of ophthalmic diseases: Increasing cases of refractive errors and glaucoma.
- Favorable regulatory environment: Approvals and guidelines supporting the adoption of advanced diagnostic technologies.
Challenges in the Corneal Pachymetry Market Sector
The Corneal Pachymetry market faces some challenges, including:
- High initial investment cost: The acquisition cost of advanced pachymetry systems can be substantial, creating barriers to entry for smaller clinics.
- Competitive landscape: Intense competition among established players and new entrants necessitates continuous innovation.
- Reimbursement challenges: Securing adequate reimbursement for pachymetry services can be difficult in some healthcare systems. This can impact market adoption, especially in cost-sensitive markets.
Emerging Opportunities in Corneal Pachymetry Market
Emerging opportunities include:
- Expansion in developing countries: Growing awareness and increased healthcare spending in developing economies.
- Integration with AI and teleophthalmology: Opportunities to improve diagnostic accuracy and accessibility.
- Development of point-of-care devices: Devices for use in remote or resource-limited settings.
Leading Players in the Corneal Pachymetry Market Market
- Lumibird Group (Quantel Medical)
- Xuzhou Kaixin Electronic Instrument Co
- DGH Technology Inc
- Optovue Incorporated
- TOMEY CORPORATION
- Reichert Inc
- Carl Zeiss AG
- Sonomed Escalon
- Topcon Corporation
- NIDEK CO LTD
Key Developments in Corneal Pachymetry Market Industry
- December 2022: Entod Pharmaceuticals launched its GLO division for Glaucoma treatment, expanding its ophthalmic subspecialty division.
- January 2023: Bausch + Lomb Corp. and the Glaucoma Research Foundation (GRF) launched the "Screen, Protect, Cure" campaign to raise glaucoma awareness.
Strategic Outlook for Corneal Pachymetry Market Market
The Corneal Pachymetry market is poised for significant growth, driven by technological innovations, expanding healthcare infrastructure, and rising prevalence of ophthalmic diseases. Opportunities exist for companies to focus on developing cost-effective, portable, and integrated solutions. Strategic partnerships and collaborations can further accelerate market penetration and drive innovation. The market's future potential rests on addressing unmet needs in underserved populations and fostering early disease detection and management.
Corneal Pachymetry Market Segmentation
-
1. Type
- 1.1. Ultrasonic Method
- 1.2. Optical Method
-
2. Application
- 2.1. Refractive Surgery
- 2.2. Glaucoma Diagnostics
Corneal Pachymetry Market Segmentation By Geography
-
1. North America
- 1.1. United States
- 1.2. Canada
- 1.3. Mexico
-
2. Europe
- 2.1. Germany
- 2.2. United Kingdom
- 2.3. France
- 2.4. Italy
- 2.5. Spain
- 2.6. Rest of Europe
-
3. Asia Pacific
- 3.1. China
- 3.2. Japan
- 3.3. India
- 3.4. Australia
- 3.5. South Korea
- 3.6. Rest of Asia Pacific
-
4. Middle East and Africa
- 4.1. GCC
- 4.2. South Africa
- 4.3. Rest of Middle East and Africa
-
5. South America
- 5.1. Brazil
- 5.2. Argentina
- 5.3. Rest of South America
Corneal Pachymetry Market REPORT HIGHLIGHTS
| Aspects | Details |
|---|---|
| Study Period | 2019-2033 |
| Base Year | 2024 |
| Estimated Year | 2025 |
| Forecast Period | 2025-2033 |
| Historical Period | 2019-2024 |
| Growth Rate | CAGR of 4.88% from 2019-2033 |
| Segmentation |
|
Table of Contents
- 1. Introduction
- 1.1. Research Scope
- 1.2. Market Segmentation
- 1.3. Research Methodology
- 1.4. Definitions and Assumptions
- 2. Executive Summary
- 2.1. Introduction
- 3. Market Dynamics
- 3.1. Introduction
- 3.2. Market Drivers
- 3.2.1. Rise in Prevalence of Glaucoma and Eye-related Disorders; Rise in Prevalence of Diabetic Retinopathy
- 3.3. Market Restrains
- 3.3.1. Inadequate Reimbursement Coverage for Pachymetry; Stringent Government Regulations
- 3.4. Market Trends
- 3.4.1. Glaucoma Diagnostics Segment Expects to Register a Significant CAGR Over the Forecast Period
- 4. Market Factor Analysis
- 4.1. Porters Five Forces
- 4.2. Supply/Value Chain
- 4.3. PESTEL analysis
- 4.4. Market Entropy
- 4.5. Patent/Trademark Analysis
- 5. Global Corneal Pachymetry Market Analysis, Insights and Forecast, 2019-2031
- 5.1. Market Analysis, Insights and Forecast - by Type
- 5.1.1. Ultrasonic Method
- 5.1.2. Optical Method
- 5.2. Market Analysis, Insights and Forecast - by Application
- 5.2.1. Refractive Surgery
- 5.2.2. Glaucoma Diagnostics
- 5.3. Market Analysis, Insights and Forecast - by Region
- 5.3.1. North America
- 5.3.2. Europe
- 5.3.3. Asia Pacific
- 5.3.4. Middle East and Africa
- 5.3.5. South America
- 5.1. Market Analysis, Insights and Forecast - by Type
- 6. North America Corneal Pachymetry Market Analysis, Insights and Forecast, 2019-2031
- 6.1. Market Analysis, Insights and Forecast - by Type
- 6.1.1. Ultrasonic Method
- 6.1.2. Optical Method
- 6.2. Market Analysis, Insights and Forecast - by Application
- 6.2.1. Refractive Surgery
- 6.2.2. Glaucoma Diagnostics
- 6.1. Market Analysis, Insights and Forecast - by Type
- 7. Europe Corneal Pachymetry Market Analysis, Insights and Forecast, 2019-2031
- 7.1. Market Analysis, Insights and Forecast - by Type
- 7.1.1. Ultrasonic Method
- 7.1.2. Optical Method
- 7.2. Market Analysis, Insights and Forecast - by Application
- 7.2.1. Refractive Surgery
- 7.2.2. Glaucoma Diagnostics
- 7.1. Market Analysis, Insights and Forecast - by Type
- 8. Asia Pacific Corneal Pachymetry Market Analysis, Insights and Forecast, 2019-2031
- 8.1. Market Analysis, Insights and Forecast - by Type
- 8.1.1. Ultrasonic Method
- 8.1.2. Optical Method
- 8.2. Market Analysis, Insights and Forecast - by Application
- 8.2.1. Refractive Surgery
- 8.2.2. Glaucoma Diagnostics
- 8.1. Market Analysis, Insights and Forecast - by Type
- 9. Middle East and Africa Corneal Pachymetry Market Analysis, Insights and Forecast, 2019-2031
- 9.1. Market Analysis, Insights and Forecast - by Type
- 9.1.1. Ultrasonic Method
- 9.1.2. Optical Method
- 9.2. Market Analysis, Insights and Forecast - by Application
- 9.2.1. Refractive Surgery
- 9.2.2. Glaucoma Diagnostics
- 9.1. Market Analysis, Insights and Forecast - by Type
- 10. South America Corneal Pachymetry Market Analysis, Insights and Forecast, 2019-2031
- 10.1. Market Analysis, Insights and Forecast - by Type
- 10.1.1. Ultrasonic Method
- 10.1.2. Optical Method
- 10.2. Market Analysis, Insights and Forecast - by Application
- 10.2.1. Refractive Surgery
- 10.2.2. Glaucoma Diagnostics
- 10.1. Market Analysis, Insights and Forecast - by Type
- 11. North America Corneal Pachymetry Market Analysis, Insights and Forecast, 2019-2031
- 11.1. Market Analysis, Insights and Forecast - By Country/Sub-region
- 11.1.1 United States
- 11.1.2 Canada
- 11.1.3 Mexico
- 12. Europe Corneal Pachymetry Market Analysis, Insights and Forecast, 2019-2031
- 12.1. Market Analysis, Insights and Forecast - By Country/Sub-region
- 12.1.1 Germany
- 12.1.2 United Kingdom
- 12.1.3 France
- 12.1.4 Italy
- 12.1.5 Spain
- 12.1.6 Rest of Europe
- 13. Asia Pacific Corneal Pachymetry Market Analysis, Insights and Forecast, 2019-2031
- 13.1. Market Analysis, Insights and Forecast - By Country/Sub-region
- 13.1.1 China
- 13.1.2 Japan
- 13.1.3 India
- 13.1.4 Australia
- 13.1.5 South Korea
- 13.1.6 Rest of Asia Pacific
- 14. Middle East and Africa Corneal Pachymetry Market Analysis, Insights and Forecast, 2019-2031
- 14.1. Market Analysis, Insights and Forecast - By Country/Sub-region
- 14.1.1 GCC
- 14.1.2 South Africa
- 14.1.3 Rest of Middle East and Africa
- 15. South America Corneal Pachymetry Market Analysis, Insights and Forecast, 2019-2031
- 15.1. Market Analysis, Insights and Forecast - By Country/Sub-region
- 15.1.1 Brazil
- 15.1.2 Argentina
- 15.1.3 Rest of South America
- 16. Competitive Analysis
- 16.1. Global Market Share Analysis 2024
- 16.2. Company Profiles
- 16.2.1 Lumibird Group (Quantel Medical)
- 16.2.1.1. Overview
- 16.2.1.2. Products
- 16.2.1.3. SWOT Analysis
- 16.2.1.4. Recent Developments
- 16.2.1.5. Financials (Based on Availability)
- 16.2.2 Xuzhou Kaixin Electronic Instrument Co
- 16.2.2.1. Overview
- 16.2.2.2. Products
- 16.2.2.3. SWOT Analysis
- 16.2.2.4. Recent Developments
- 16.2.2.5. Financials (Based on Availability)
- 16.2.3 DGH Technology Inc
- 16.2.3.1. Overview
- 16.2.3.2. Products
- 16.2.3.3. SWOT Analysis
- 16.2.3.4. Recent Developments
- 16.2.3.5. Financials (Based on Availability)
- 16.2.4 Optovue Incorporated
- 16.2.4.1. Overview
- 16.2.4.2. Products
- 16.2.4.3. SWOT Analysis
- 16.2.4.4. Recent Developments
- 16.2.4.5. Financials (Based on Availability)
- 16.2.5 TOMEY CORPORATION
- 16.2.5.1. Overview
- 16.2.5.2. Products
- 16.2.5.3. SWOT Analysis
- 16.2.5.4. Recent Developments
- 16.2.5.5. Financials (Based on Availability)
- 16.2.6 Reichert Inc
- 16.2.6.1. Overview
- 16.2.6.2. Products
- 16.2.6.3. SWOT Analysis
- 16.2.6.4. Recent Developments
- 16.2.6.5. Financials (Based on Availability)
- 16.2.7 Carl Zeiss AG
- 16.2.7.1. Overview
- 16.2.7.2. Products
- 16.2.7.3. SWOT Analysis
- 16.2.7.4. Recent Developments
- 16.2.7.5. Financials (Based on Availability)
- 16.2.8 Sonomed Escalon
- 16.2.8.1. Overview
- 16.2.8.2. Products
- 16.2.8.3. SWOT Analysis
- 16.2.8.4. Recent Developments
- 16.2.8.5. Financials (Based on Availability)
- 16.2.9 Topcon Corporation
- 16.2.9.1. Overview
- 16.2.9.2. Products
- 16.2.9.3. SWOT Analysis
- 16.2.9.4. Recent Developments
- 16.2.9.5. Financials (Based on Availability)
- 16.2.10 NIDEK CO LTD
- 16.2.10.1. Overview
- 16.2.10.2. Products
- 16.2.10.3. SWOT Analysis
- 16.2.10.4. Recent Developments
- 16.2.10.5. Financials (Based on Availability)
- 16.2.1 Lumibird Group (Quantel Medical)
List of Figures
- Figure 1: Global Corneal Pachymetry Market Revenue Breakdown (Million, %) by Region 2024 & 2032
- Figure 2: Global Corneal Pachymetry Market Volume Breakdown (K Unit, %) by Region 2024 & 2032
- Figure 3: North America Corneal Pachymetry Market Revenue (Million), by Country 2024 & 2032
- Figure 4: North America Corneal Pachymetry Market Volume (K Unit), by Country 2024 & 2032
- Figure 5: North America Corneal Pachymetry Market Revenue Share (%), by Country 2024 & 2032
- Figure 6: North America Corneal Pachymetry Market Volume Share (%), by Country 2024 & 2032
- Figure 7: Europe Corneal Pachymetry Market Revenue (Million), by Country 2024 & 2032
- Figure 8: Europe Corneal Pachymetry Market Volume (K Unit), by Country 2024 & 2032
- Figure 9: Europe Corneal Pachymetry Market Revenue Share (%), by Country 2024 & 2032
- Figure 10: Europe Corneal Pachymetry Market Volume Share (%), by Country 2024 & 2032
- Figure 11: Asia Pacific Corneal Pachymetry Market Revenue (Million), by Country 2024 & 2032
- Figure 12: Asia Pacific Corneal Pachymetry Market Volume (K Unit), by Country 2024 & 2032
- Figure 13: Asia Pacific Corneal Pachymetry Market Revenue Share (%), by Country 2024 & 2032
- Figure 14: Asia Pacific Corneal Pachymetry Market Volume Share (%), by Country 2024 & 2032
- Figure 15: Middle East and Africa Corneal Pachymetry Market Revenue (Million), by Country 2024 & 2032
- Figure 16: Middle East and Africa Corneal Pachymetry Market Volume (K Unit), by Country 2024 & 2032
- Figure 17: Middle East and Africa Corneal Pachymetry Market Revenue Share (%), by Country 2024 & 2032
- Figure 18: Middle East and Africa Corneal Pachymetry Market Volume Share (%), by Country 2024 & 2032
- Figure 19: South America Corneal Pachymetry Market Revenue (Million), by Country 2024 & 2032
- Figure 20: South America Corneal Pachymetry Market Volume (K Unit), by Country 2024 & 2032
- Figure 21: South America Corneal Pachymetry Market Revenue Share (%), by Country 2024 & 2032
- Figure 22: South America Corneal Pachymetry Market Volume Share (%), by Country 2024 & 2032
- Figure 23: North America Corneal Pachymetry Market Revenue (Million), by Type 2024 & 2032
- Figure 24: North America Corneal Pachymetry Market Volume (K Unit), by Type 2024 & 2032
- Figure 25: North America Corneal Pachymetry Market Revenue Share (%), by Type 2024 & 2032
- Figure 26: North America Corneal Pachymetry Market Volume Share (%), by Type 2024 & 2032
- Figure 27: North America Corneal Pachymetry Market Revenue (Million), by Application 2024 & 2032
- Figure 28: North America Corneal Pachymetry Market Volume (K Unit), by Application 2024 & 2032
- Figure 29: North America Corneal Pachymetry Market Revenue Share (%), by Application 2024 & 2032
- Figure 30: North America Corneal Pachymetry Market Volume Share (%), by Application 2024 & 2032
- Figure 31: North America Corneal Pachymetry Market Revenue (Million), by Country 2024 & 2032
- Figure 32: North America Corneal Pachymetry Market Volume (K Unit), by Country 2024 & 2032
- Figure 33: North America Corneal Pachymetry Market Revenue Share (%), by Country 2024 & 2032
- Figure 34: North America Corneal Pachymetry Market Volume Share (%), by Country 2024 & 2032
- Figure 35: Europe Corneal Pachymetry Market Revenue (Million), by Type 2024 & 2032
- Figure 36: Europe Corneal Pachymetry Market Volume (K Unit), by Type 2024 & 2032
- Figure 37: Europe Corneal Pachymetry Market Revenue Share (%), by Type 2024 & 2032
- Figure 38: Europe Corneal Pachymetry Market Volume Share (%), by Type 2024 & 2032
- Figure 39: Europe Corneal Pachymetry Market Revenue (Million), by Application 2024 & 2032
- Figure 40: Europe Corneal Pachymetry Market Volume (K Unit), by Application 2024 & 2032
- Figure 41: Europe Corneal Pachymetry Market Revenue Share (%), by Application 2024 & 2032
- Figure 42: Europe Corneal Pachymetry Market Volume Share (%), by Application 2024 & 2032
- Figure 43: Europe Corneal Pachymetry Market Revenue (Million), by Country 2024 & 2032
- Figure 44: Europe Corneal Pachymetry Market Volume (K Unit), by Country 2024 & 2032
- Figure 45: Europe Corneal Pachymetry Market Revenue Share (%), by Country 2024 & 2032
- Figure 46: Europe Corneal Pachymetry Market Volume Share (%), by Country 2024 & 2032
- Figure 47: Asia Pacific Corneal Pachymetry Market Revenue (Million), by Type 2024 & 2032
- Figure 48: Asia Pacific Corneal Pachymetry Market Volume (K Unit), by Type 2024 & 2032
- Figure 49: Asia Pacific Corneal Pachymetry Market Revenue Share (%), by Type 2024 & 2032
- Figure 50: Asia Pacific Corneal Pachymetry Market Volume Share (%), by Type 2024 & 2032
- Figure 51: Asia Pacific Corneal Pachymetry Market Revenue (Million), by Application 2024 & 2032
- Figure 52: Asia Pacific Corneal Pachymetry Market Volume (K Unit), by Application 2024 & 2032
- Figure 53: Asia Pacific Corneal Pachymetry Market Revenue Share (%), by Application 2024 & 2032
- Figure 54: Asia Pacific Corneal Pachymetry Market Volume Share (%), by Application 2024 & 2032
- Figure 55: Asia Pacific Corneal Pachymetry Market Revenue (Million), by Country 2024 & 2032
- Figure 56: Asia Pacific Corneal Pachymetry Market Volume (K Unit), by Country 2024 & 2032
- Figure 57: Asia Pacific Corneal Pachymetry Market Revenue Share (%), by Country 2024 & 2032
- Figure 58: Asia Pacific Corneal Pachymetry Market Volume Share (%), by Country 2024 & 2032
- Figure 59: Middle East and Africa Corneal Pachymetry Market Revenue (Million), by Type 2024 & 2032
- Figure 60: Middle East and Africa Corneal Pachymetry Market Volume (K Unit), by Type 2024 & 2032
- Figure 61: Middle East and Africa Corneal Pachymetry Market Revenue Share (%), by Type 2024 & 2032
- Figure 62: Middle East and Africa Corneal Pachymetry Market Volume Share (%), by Type 2024 & 2032
- Figure 63: Middle East and Africa Corneal Pachymetry Market Revenue (Million), by Application 2024 & 2032
- Figure 64: Middle East and Africa Corneal Pachymetry Market Volume (K Unit), by Application 2024 & 2032
- Figure 65: Middle East and Africa Corneal Pachymetry Market Revenue Share (%), by Application 2024 & 2032
- Figure 66: Middle East and Africa Corneal Pachymetry Market Volume Share (%), by Application 2024 & 2032
- Figure 67: Middle East and Africa Corneal Pachymetry Market Revenue (Million), by Country 2024 & 2032
- Figure 68: Middle East and Africa Corneal Pachymetry Market Volume (K Unit), by Country 2024 & 2032
- Figure 69: Middle East and Africa Corneal Pachymetry Market Revenue Share (%), by Country 2024 & 2032
- Figure 70: Middle East and Africa Corneal Pachymetry Market Volume Share (%), by Country 2024 & 2032
- Figure 71: South America Corneal Pachymetry Market Revenue (Million), by Type 2024 & 2032
- Figure 72: South America Corneal Pachymetry Market Volume (K Unit), by Type 2024 & 2032
- Figure 73: South America Corneal Pachymetry Market Revenue Share (%), by Type 2024 & 2032
- Figure 74: South America Corneal Pachymetry Market Volume Share (%), by Type 2024 & 2032
- Figure 75: South America Corneal Pachymetry Market Revenue (Million), by Application 2024 & 2032
- Figure 76: South America Corneal Pachymetry Market Volume (K Unit), by Application 2024 & 2032
- Figure 77: South America Corneal Pachymetry Market Revenue Share (%), by Application 2024 & 2032
- Figure 78: South America Corneal Pachymetry Market Volume Share (%), by Application 2024 & 2032
- Figure 79: South America Corneal Pachymetry Market Revenue (Million), by Country 2024 & 2032
- Figure 80: South America Corneal Pachymetry Market Volume (K Unit), by Country 2024 & 2032
- Figure 81: South America Corneal Pachymetry Market Revenue Share (%), by Country 2024 & 2032
- Figure 82: South America Corneal Pachymetry Market Volume Share (%), by Country 2024 & 2032
List of Tables
- Table 1: Global Corneal Pachymetry Market Revenue Million Forecast, by Region 2019 & 2032
- Table 2: Global Corneal Pachymetry Market Volume K Unit Forecast, by Region 2019 & 2032
- Table 3: Global Corneal Pachymetry Market Revenue Million Forecast, by Type 2019 & 2032
- Table 4: Global Corneal Pachymetry Market Volume K Unit Forecast, by Type 2019 & 2032
- Table 5: Global Corneal Pachymetry Market Revenue Million Forecast, by Application 2019 & 2032
- Table 6: Global Corneal Pachymetry Market Volume K Unit Forecast, by Application 2019 & 2032
- Table 7: Global Corneal Pachymetry Market Revenue Million Forecast, by Region 2019 & 2032
- Table 8: Global Corneal Pachymetry Market Volume K Unit Forecast, by Region 2019 & 2032
- Table 9: Global Corneal Pachymetry Market Revenue Million Forecast, by Country 2019 & 2032
- Table 10: Global Corneal Pachymetry Market Volume K Unit Forecast, by Country 2019 & 2032
- Table 11: United States Corneal Pachymetry Market Revenue (Million) Forecast, by Application 2019 & 2032
- Table 12: United States Corneal Pachymetry Market Volume (K Unit) Forecast, by Application 2019 & 2032
- Table 13: Canada Corneal Pachymetry Market Revenue (Million) Forecast, by Application 2019 & 2032
- Table 14: Canada Corneal Pachymetry Market Volume (K Unit) Forecast, by Application 2019 & 2032
- Table 15: Mexico Corneal Pachymetry Market Revenue (Million) Forecast, by Application 2019 & 2032
- Table 16: Mexico Corneal Pachymetry Market Volume (K Unit) Forecast, by Application 2019 & 2032
- Table 17: Global Corneal Pachymetry Market Revenue Million Forecast, by Country 2019 & 2032
- Table 18: Global Corneal Pachymetry Market Volume K Unit Forecast, by Country 2019 & 2032
- Table 19: Germany Corneal Pachymetry Market Revenue (Million) Forecast, by Application 2019 & 2032
- Table 20: Germany Corneal Pachymetry Market Volume (K Unit) Forecast, by Application 2019 & 2032
- Table 21: United Kingdom Corneal Pachymetry Market Revenue (Million) Forecast, by Application 2019 & 2032
- Table 22: United Kingdom Corneal Pachymetry Market Volume (K Unit) Forecast, by Application 2019 & 2032
- Table 23: France Corneal Pachymetry Market Revenue (Million) Forecast, by Application 2019 & 2032
- Table 24: France Corneal Pachymetry Market Volume (K Unit) Forecast, by Application 2019 & 2032
- Table 25: Italy Corneal Pachymetry Market Revenue (Million) Forecast, by Application 2019 & 2032
- Table 26: Italy Corneal Pachymetry Market Volume (K Unit) Forecast, by Application 2019 & 2032
- Table 27: Spain Corneal Pachymetry Market Revenue (Million) Forecast, by Application 2019 & 2032
- Table 28: Spain Corneal Pachymetry Market Volume (K Unit) Forecast, by Application 2019 & 2032
- Table 29: Rest of Europe Corneal Pachymetry Market Revenue (Million) Forecast, by Application 2019 & 2032
- Table 30: Rest of Europe Corneal Pachymetry Market Volume (K Unit) Forecast, by Application 2019 & 2032
- Table 31: Global Corneal Pachymetry Market Revenue Million Forecast, by Country 2019 & 2032
- Table 32: Global Corneal Pachymetry Market Volume K Unit Forecast, by Country 2019 & 2032
- Table 33: China Corneal Pachymetry Market Revenue (Million) Forecast, by Application 2019 & 2032
- Table 34: China Corneal Pachymetry Market Volume (K Unit) Forecast, by Application 2019 & 2032
- Table 35: Japan Corneal Pachymetry Market Revenue (Million) Forecast, by Application 2019 & 2032
- Table 36: Japan Corneal Pachymetry Market Volume (K Unit) Forecast, by Application 2019 & 2032
- Table 37: India Corneal Pachymetry Market Revenue (Million) Forecast, by Application 2019 & 2032
- Table 38: India Corneal Pachymetry Market Volume (K Unit) Forecast, by Application 2019 & 2032
- Table 39: Australia Corneal Pachymetry Market Revenue (Million) Forecast, by Application 2019 & 2032
- Table 40: Australia Corneal Pachymetry Market Volume (K Unit) Forecast, by Application 2019 & 2032
- Table 41: South Korea Corneal Pachymetry Market Revenue (Million) Forecast, by Application 2019 & 2032
- Table 42: South Korea Corneal Pachymetry Market Volume (K Unit) Forecast, by Application 2019 & 2032
- Table 43: Rest of Asia Pacific Corneal Pachymetry Market Revenue (Million) Forecast, by Application 2019 & 2032
- Table 44: Rest of Asia Pacific Corneal Pachymetry Market Volume (K Unit) Forecast, by Application 2019 & 2032
- Table 45: Global Corneal Pachymetry Market Revenue Million Forecast, by Country 2019 & 2032
- Table 46: Global Corneal Pachymetry Market Volume K Unit Forecast, by Country 2019 & 2032
- Table 47: GCC Corneal Pachymetry Market Revenue (Million) Forecast, by Application 2019 & 2032
- Table 48: GCC Corneal Pachymetry Market Volume (K Unit) Forecast, by Application 2019 & 2032
- Table 49: South Africa Corneal Pachymetry Market Revenue (Million) Forecast, by Application 2019 & 2032
- Table 50: South Africa Corneal Pachymetry Market Volume (K Unit) Forecast, by Application 2019 & 2032
- Table 51: Rest of Middle East and Africa Corneal Pachymetry Market Revenue (Million) Forecast, by Application 2019 & 2032
- Table 52: Rest of Middle East and Africa Corneal Pachymetry Market Volume (K Unit) Forecast, by Application 2019 & 2032
- Table 53: Global Corneal Pachymetry Market Revenue Million Forecast, by Country 2019 & 2032
- Table 54: Global Corneal Pachymetry Market Volume K Unit Forecast, by Country 2019 & 2032
- Table 55: Brazil Corneal Pachymetry Market Revenue (Million) Forecast, by Application 2019 & 2032
- Table 56: Brazil Corneal Pachymetry Market Volume (K Unit) Forecast, by Application 2019 & 2032
- Table 57: Argentina Corneal Pachymetry Market Revenue (Million) Forecast, by Application 2019 & 2032
- Table 58: Argentina Corneal Pachymetry Market Volume (K Unit) Forecast, by Application 2019 & 2032
- Table 59: Rest of South America Corneal Pachymetry Market Revenue (Million) Forecast, by Application 2019 & 2032
- Table 60: Rest of South America Corneal Pachymetry Market Volume (K Unit) Forecast, by Application 2019 & 2032
- Table 61: Global Corneal Pachymetry Market Revenue Million Forecast, by Type 2019 & 2032
- Table 62: Global Corneal Pachymetry Market Volume K Unit Forecast, by Type 2019 & 2032
- Table 63: Global Corneal Pachymetry Market Revenue Million Forecast, by Application 2019 & 2032
- Table 64: Global Corneal Pachymetry Market Volume K Unit Forecast, by Application 2019 & 2032
- Table 65: Global Corneal Pachymetry Market Revenue Million Forecast, by Country 2019 & 2032
- Table 66: Global Corneal Pachymetry Market Volume K Unit Forecast, by Country 2019 & 2032
- Table 67: United States Corneal Pachymetry Market Revenue (Million) Forecast, by Application 2019 & 2032
- Table 68: United States Corneal Pachymetry Market Volume (K Unit) Forecast, by Application 2019 & 2032
- Table 69: Canada Corneal Pachymetry Market Revenue (Million) Forecast, by Application 2019 & 2032
- Table 70: Canada Corneal Pachymetry Market Volume (K Unit) Forecast, by Application 2019 & 2032
- Table 71: Mexico Corneal Pachymetry Market Revenue (Million) Forecast, by Application 2019 & 2032
- Table 72: Mexico Corneal Pachymetry Market Volume (K Unit) Forecast, by Application 2019 & 2032
- Table 73: Global Corneal Pachymetry Market Revenue Million Forecast, by Type 2019 & 2032
- Table 74: Global Corneal Pachymetry Market Volume K Unit Forecast, by Type 2019 & 2032
- Table 75: Global Corneal Pachymetry Market Revenue Million Forecast, by Application 2019 & 2032
- Table 76: Global Corneal Pachymetry Market Volume K Unit Forecast, by Application 2019 & 2032
- Table 77: Global Corneal Pachymetry Market Revenue Million Forecast, by Country 2019 & 2032
- Table 78: Global Corneal Pachymetry Market Volume K Unit Forecast, by Country 2019 & 2032
- Table 79: Germany Corneal Pachymetry Market Revenue (Million) Forecast, by Application 2019 & 2032
- Table 80: Germany Corneal Pachymetry Market Volume (K Unit) Forecast, by Application 2019 & 2032
- Table 81: United Kingdom Corneal Pachymetry Market Revenue (Million) Forecast, by Application 2019 & 2032
- Table 82: United Kingdom Corneal Pachymetry Market Volume (K Unit) Forecast, by Application 2019 & 2032
- Table 83: France Corneal Pachymetry Market Revenue (Million) Forecast, by Application 2019 & 2032
- Table 84: France Corneal Pachymetry Market Volume (K Unit) Forecast, by Application 2019 & 2032
- Table 85: Italy Corneal Pachymetry Market Revenue (Million) Forecast, by Application 2019 & 2032
- Table 86: Italy Corneal Pachymetry Market Volume (K Unit) Forecast, by Application 2019 & 2032
- Table 87: Spain Corneal Pachymetry Market Revenue (Million) Forecast, by Application 2019 & 2032
- Table 88: Spain Corneal Pachymetry Market Volume (K Unit) Forecast, by Application 2019 & 2032
- Table 89: Rest of Europe Corneal Pachymetry Market Revenue (Million) Forecast, by Application 2019 & 2032
- Table 90: Rest of Europe Corneal Pachymetry Market Volume (K Unit) Forecast, by Application 2019 & 2032
- Table 91: Global Corneal Pachymetry Market Revenue Million Forecast, by Type 2019 & 2032
- Table 92: Global Corneal Pachymetry Market Volume K Unit Forecast, by Type 2019 & 2032
- Table 93: Global Corneal Pachymetry Market Revenue Million Forecast, by Application 2019 & 2032
- Table 94: Global Corneal Pachymetry Market Volume K Unit Forecast, by Application 2019 & 2032
- Table 95: Global Corneal Pachymetry Market Revenue Million Forecast, by Country 2019 & 2032
- Table 96: Global Corneal Pachymetry Market Volume K Unit Forecast, by Country 2019 & 2032
- Table 97: China Corneal Pachymetry Market Revenue (Million) Forecast, by Application 2019 & 2032
- Table 98: China Corneal Pachymetry Market Volume (K Unit) Forecast, by Application 2019 & 2032
- Table 99: Japan Corneal Pachymetry Market Revenue (Million) Forecast, by Application 2019 & 2032
- Table 100: Japan Corneal Pachymetry Market Volume (K Unit) Forecast, by Application 2019 & 2032
- Table 101: India Corneal Pachymetry Market Revenue (Million) Forecast, by Application 2019 & 2032
- Table 102: India Corneal Pachymetry Market Volume (K Unit) Forecast, by Application 2019 & 2032
- Table 103: Australia Corneal Pachymetry Market Revenue (Million) Forecast, by Application 2019 & 2032
- Table 104: Australia Corneal Pachymetry Market Volume (K Unit) Forecast, by Application 2019 & 2032
- Table 105: South Korea Corneal Pachymetry Market Revenue (Million) Forecast, by Application 2019 & 2032
- Table 106: South Korea Corneal Pachymetry Market Volume (K Unit) Forecast, by Application 2019 & 2032
- Table 107: Rest of Asia Pacific Corneal Pachymetry Market Revenue (Million) Forecast, by Application 2019 & 2032
- Table 108: Rest of Asia Pacific Corneal Pachymetry Market Volume (K Unit) Forecast, by Application 2019 & 2032
- Table 109: Global Corneal Pachymetry Market Revenue Million Forecast, by Type 2019 & 2032
- Table 110: Global Corneal Pachymetry Market Volume K Unit Forecast, by Type 2019 & 2032
- Table 111: Global Corneal Pachymetry Market Revenue Million Forecast, by Application 2019 & 2032
- Table 112: Global Corneal Pachymetry Market Volume K Unit Forecast, by Application 2019 & 2032
- Table 113: Global Corneal Pachymetry Market Revenue Million Forecast, by Country 2019 & 2032
- Table 114: Global Corneal Pachymetry Market Volume K Unit Forecast, by Country 2019 & 2032
- Table 115: GCC Corneal Pachymetry Market Revenue (Million) Forecast, by Application 2019 & 2032
- Table 116: GCC Corneal Pachymetry Market Volume (K Unit) Forecast, by Application 2019 & 2032
- Table 117: South Africa Corneal Pachymetry Market Revenue (Million) Forecast, by Application 2019 & 2032
- Table 118: South Africa Corneal Pachymetry Market Volume (K Unit) Forecast, by Application 2019 & 2032
- Table 119: Rest of Middle East and Africa Corneal Pachymetry Market Revenue (Million) Forecast, by Application 2019 & 2032
- Table 120: Rest of Middle East and Africa Corneal Pachymetry Market Volume (K Unit) Forecast, by Application 2019 & 2032
- Table 121: Global Corneal Pachymetry Market Revenue Million Forecast, by Type 2019 & 2032
- Table 122: Global Corneal Pachymetry Market Volume K Unit Forecast, by Type 2019 & 2032
- Table 123: Global Corneal Pachymetry Market Revenue Million Forecast, by Application 2019 & 2032
- Table 124: Global Corneal Pachymetry Market Volume K Unit Forecast, by Application 2019 & 2032
- Table 125: Global Corneal Pachymetry Market Revenue Million Forecast, by Country 2019 & 2032
- Table 126: Global Corneal Pachymetry Market Volume K Unit Forecast, by Country 2019 & 2032
- Table 127: Brazil Corneal Pachymetry Market Revenue (Million) Forecast, by Application 2019 & 2032
- Table 128: Brazil Corneal Pachymetry Market Volume (K Unit) Forecast, by Application 2019 & 2032
- Table 129: Argentina Corneal Pachymetry Market Revenue (Million) Forecast, by Application 2019 & 2032
- Table 130: Argentina Corneal Pachymetry Market Volume (K Unit) Forecast, by Application 2019 & 2032
- Table 131: Rest of South America Corneal Pachymetry Market Revenue (Million) Forecast, by Application 2019 & 2032
- Table 132: Rest of South America Corneal Pachymetry Market Volume (K Unit) Forecast, by Application 2019 & 2032
Frequently Asked Questions
1. What is the projected Compound Annual Growth Rate (CAGR) of the Corneal Pachymetry Market?
The projected CAGR is approximately 4.88%.
2. Which companies are prominent players in the Corneal Pachymetry Market?
Key companies in the market include Lumibird Group (Quantel Medical), Xuzhou Kaixin Electronic Instrument Co , DGH Technology Inc, Optovue Incorporated, TOMEY CORPORATION, Reichert Inc, Carl Zeiss AG, Sonomed Escalon, Topcon Corporation, NIDEK CO LTD.
3. What are the main segments of the Corneal Pachymetry Market?
The market segments include Type, Application.
4. Can you provide details about the market size?
The market size is estimated to be USD 304.82 Million as of 2022.
5. What are some drivers contributing to market growth?
Rise in Prevalence of Glaucoma and Eye-related Disorders; Rise in Prevalence of Diabetic Retinopathy.
6. What are the notable trends driving market growth?
Glaucoma Diagnostics Segment Expects to Register a Significant CAGR Over the Forecast Period.
7. Are there any restraints impacting market growth?
Inadequate Reimbursement Coverage for Pachymetry; Stringent Government Regulations.
8. Can you provide examples of recent developments in the market?
January 2023: Bausch + Lomb Corp. and the Glaucoma Research Foundation (GRF) launched "Screen, Protect, Cure," a campaign designed to provide educational resources and raise awareness of glaucoma in the United States.
9. What pricing options are available for accessing the report?
Pricing options include single-user, multi-user, and enterprise licenses priced at USD 4750, USD 5250, and USD 8750 respectively.
10. Is the market size provided in terms of value or volume?
The market size is provided in terms of value, measured in Million and volume, measured in K Unit.
11. Are there any specific market keywords associated with the report?
Yes, the market keyword associated with the report is "Corneal Pachymetry Market," which aids in identifying and referencing the specific market segment covered.
12. How do I determine which pricing option suits my needs best?
The pricing options vary based on user requirements and access needs. Individual users may opt for single-user licenses, while businesses requiring broader access may choose multi-user or enterprise licenses for cost-effective access to the report.
13. Are there any additional resources or data provided in the Corneal Pachymetry Market report?
While the report offers comprehensive insights, it's advisable to review the specific contents or supplementary materials provided to ascertain if additional resources or data are available.
14. How can I stay updated on further developments or reports in the Corneal Pachymetry Market?
To stay informed about further developments, trends, and reports in the Corneal Pachymetry Market, consider subscribing to industry newsletters, following relevant companies and organizations, or regularly checking reputable industry news sources and publications.
Methodology
Step 1 - Identification of Relevant Samples Size from Population Database


Step 2 - Approaches for Defining Global Market Size (Value, Volume* & Price*)

Note*: In applicable scenarios
Step 3 - Data Sources
Primary Research
- Web Analytics
- Survey Reports
- Research Institute
- Latest Research Reports
- Opinion Leaders
Secondary Research
- Annual Reports
- White Paper
- Latest Press Release
- Industry Association
- Paid Database
- Investor Presentations

Step 4 - Data Triangulation
Involves using different sources of information in order to increase the validity of a study
These sources are likely to be stakeholders in a program - participants, other researchers, program staff, other community members, and so on.
Then we put all data in single framework & apply various statistical tools to find out the dynamic on the market.
During the analysis stage, feedback from the stakeholder groups would be compared to determine areas of agreement as well as areas of divergence


