Cotton Industry Unlocking Growth Potential: Analysis and Forecasts 2025-2033

Cotton Industry by Production Analysis, by Consumption Analysis, by Import Market Analysis (Value & Volume), by Export Market Analysis (Value & Volume), by Price Trend Analysis, by North America (United States, Canada, Mexico), by Europe (Germany, France, Russia, Greece, Italy), by Asia Pacific (China, India, Australia, Pakistan, Bangladesh), by South America (Brazil, Argentina), by Middle East, by South Africa (Turkey, Egypt) Forecast 2025-2033

Jun 30 2025
Base Year: 2024

180 Pages
Main Logo

Cotton Industry Unlocking Growth Potential: Analysis and Forecasts 2025-2033


Home
Industries
Agriculture
sponsor image

Tailored for you

  • In-depth Analysis Tailored to Specified Regions or Segments
  • Company Profiles Customized to User Preferences
  • Comprehensive Insights Focused on Specific Segments or Regions
  • Customized Evaluation of Competitive Landscape to Meet Your Needs
  • Tailored Customization to Address Other Specific Requirements
Ask for customization


Key Insights

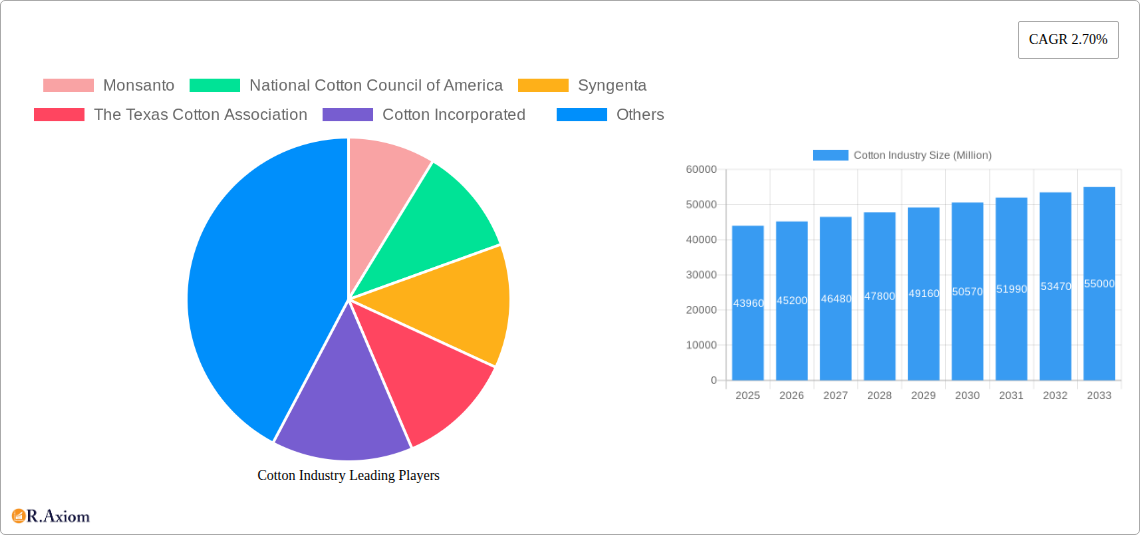
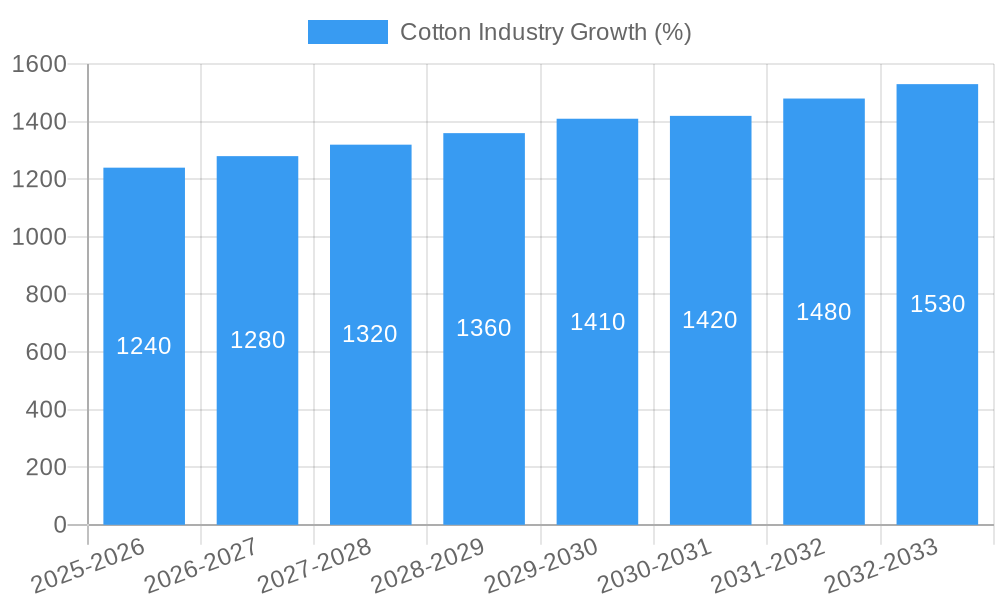
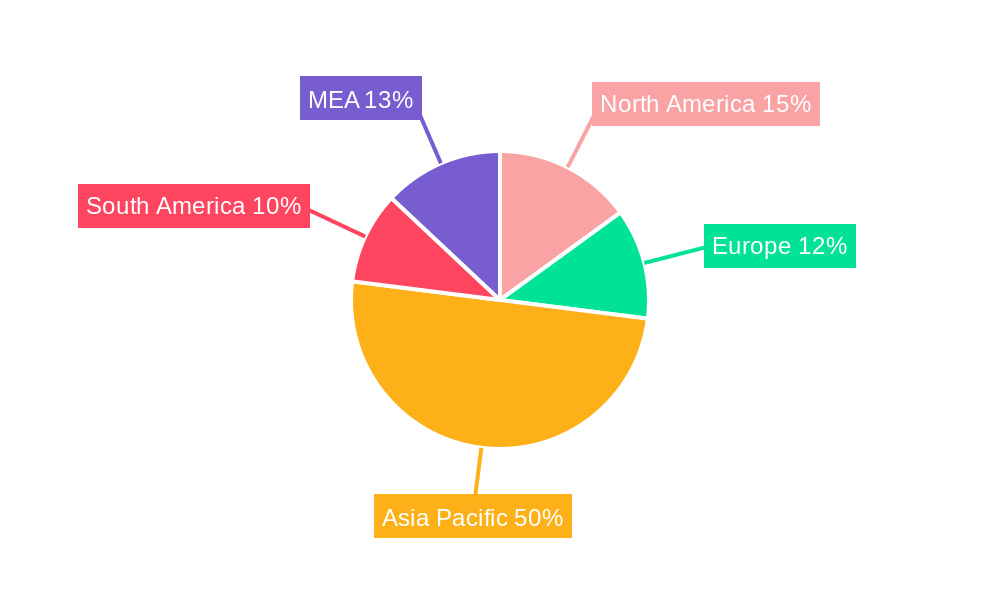
The global cotton industry, valued at $43.96 billion in 2025, is projected to experience steady growth with a Compound Annual Growth Rate (CAGR) of 2.70% from 2025 to 2033. This growth is driven by increasing demand from the apparel sector, particularly in developing economies experiencing rising middle classes and a consequent increase in clothing consumption. Furthermore, the expanding home textile market, fueled by urbanization and changing lifestyle preferences, contributes significantly to cotton's demand. Technological advancements in cotton farming, including improved seed varieties and precision agriculture techniques, are enhancing yields and efficiency, while sustainable cotton farming practices are gaining traction in response to growing environmental concerns. However, fluctuating cotton prices due to weather patterns and global economic conditions pose a significant challenge. Competition from synthetic fibers, requiring strategic adaptation by the industry to emphasize cotton's natural and sustainable attributes, represents another restraint on growth. Segmentation analysis reveals that the apparel segment holds the largest market share within the end-use categories. Within the fiber length segment, medium-staple cotton currently enjoys the highest demand due to its versatility and cost-effectiveness. The dominance of white cotton in the color segment underscores the industry’s focus on traditional applications. Key players, including Monsanto, Syngenta, and Bayer CropScience, are actively involved in research and development, influencing the overall market trajectory. Regional analysis shows strong growth potential in the Asia-Pacific region, driven primarily by India and China, due to their large populations and burgeoning textile industries.

The forecast period (2025-2033) anticipates continued growth in the cotton market, although the pace may fluctuate depending on factors like global economic conditions and climate change impacts on cotton production. The industry's future hinges on addressing challenges such as price volatility and competition from synthetic alternatives while capitalizing on opportunities presented by sustainable cotton initiatives and growing demand from emerging markets. Strategic investments in research and development, coupled with sustainable farming practices, will be pivotal for long-term growth and profitability within the global cotton market. Furthermore, initiatives to promote the unique qualities of cotton – its breathability, softness, and sustainability – will be key to maintaining its competitive edge against substitute materials.

Cotton Industry Research Report - Market Size, Growth & Forecast

Cotton Industry: A Comprehensive Market Report (2019-2033)

This in-depth report provides a comprehensive analysis of the global cotton industry, covering market dynamics, key players, emerging trends, and future growth prospects. The study period spans from 2019 to 2033, with 2025 serving as the base and estimated year. The forecast period is 2025-2033, and the historical period encompasses 2019-2024. This report is essential for industry stakeholders, investors, and researchers seeking actionable insights into this vital sector. The global cotton market is estimated at $xx Million in 2025, projected to reach $xx Million by 2033, exhibiting a CAGR of xx%.

Cotton Industry Market Concentration & Innovation

The global cotton industry is characterized by a moderately concentrated market structure, with a few large players dominating seed production and technology while numerous smaller entities focus on cultivation and processing. Major players like Monsanto, Syngenta, Bayer CropScience, and Cotton Incorporated hold significant market share in specific segments. Market concentration is further influenced by regional variations in production and consumption patterns.

  • Market Share: Monsanto and Syngenta together hold an estimated xx% market share in seed production. Cotton Incorporated’s influence lies primarily in research and development and market promotion. Precise market share figures for other players are commercially sensitive and not publicly available.
  • M&A Activity: The industry has witnessed significant M&A activity in recent years, driven by the consolidation of seed companies and the integration of agricultural technology. Total M&A deal values for the period 2019-2024 are estimated at $xx Million. Several acquisitions of smaller seed companies by larger players are expected in the coming years.
  • Innovation Drivers: Technological advancements in seed breeding, pest management, and irrigation technologies continue to drive innovation. This includes the development of genetically modified (GM) cotton varieties and improved farming practices.
  • Regulatory Frameworks: Government policies and regulations concerning GM crops, pesticide use, and trade significantly impact market dynamics. Variations in these regulations across regions create challenges and opportunities for industry players.
  • Product Substitutes: Synthetic fibers such as polyester and nylon pose a competitive threat to cotton, particularly in certain applications. The development of sustainable and eco-friendly alternatives to cotton is also emerging as a disruptive factor.
  • End-User Trends: Growing demand for sustainable and ethically sourced cotton is driving changes in supply chains and increasing consumer awareness of cotton production practices. This, in turn, influences the industry to adopt more sustainable practices.

Cotton Industry Industry Trends & Insights

The cotton industry is undergoing a period of significant transformation, driven by several key factors. Growth is propelled by increasing global demand for apparel and home textiles, particularly in developing economies. However, challenges such as fluctuating cotton prices, climate change impacts on yields, and competition from synthetic fibers present headwinds. Technological disruptions, such as precision agriculture technologies and improved genetic engineering techniques, are enhancing productivity and sustainability.

Consumer preferences are shifting towards sustainable and ethically sourced cotton, driving a movement towards organic and Fairtrade cotton. This increased demand for organic cotton is also fostering innovation in the organic cotton seed market, which has seen the introduction of new varieties. Competitive dynamics are intensifying, with companies investing heavily in research and development, brand building, and supply chain optimization. The industry is seeing the emergence of new business models focusing on sustainability and traceability, along with increasing adoption of digital technologies across the value chain.

Cotton Industry Growth

Dominant Markets & Segments in Cotton Industry

  • Leading Regions: India, China, and the United States remain the leading cotton-producing countries, accounting for a combined xx% of global production. This dominance is based on extensive cultivation areas, favourable climatic conditions, and established infrastructure.

  • Fiber Length: Medium-staple cotton dominates the market due to its versatility and cost-effectiveness. Short-staple cotton is primarily used for lower-end applications, while long-staple cotton commands premium prices for its superior quality and use in high-value products.

  • Grade: Middling (M) and Strict Middling (SM) grades account for the largest share of the market due to their balance between quality and price.

  • Color: White cotton represents the bulk of the market, with colored cotton accounting for a smaller, but growing, niche segment, primarily used in specialty applications.

  • End Use: Apparel remains the dominant end-use segment, consuming xx% of global cotton production. Home textiles and industrial applications represent significant, albeit smaller, segments.

  • Key Drivers (India, as an example):

    • Supportive government policies incentivizing cotton cultivation.
    • Large land area suitable for cotton farming.
    • Established infrastructure for cotton processing and export.
    • Growing domestic demand for cotton textiles.

The dominance of certain regions, fiber lengths, and grades reflects the interplay of environmental factors, consumer demand, and production capabilities.

Cotton Industry Product Developments

Recent product innovations focus on improving fiber quality, yield, pest resistance, and sustainability. The development of GM cotton varieties with enhanced traits, such as insect resistance and herbicide tolerance, has improved efficiency and reduced production costs. The introduction of organic cotton varieties represents a significant development in addressing environmental concerns and meeting consumer demand for sustainable products. These innovations are crucial to maintaining the competitiveness of cotton in the face of increasing competition from synthetic fibers.

Report Scope & Segmentation Analysis

This report segments the cotton market based on fiber length (short-staple, medium-staple, long-staple), grade (SLM, M, SM), color (white, colored), and end-use (apparel, home textiles, industrial applications). Each segment is analyzed in terms of market size, growth projections, and competitive dynamics. For example, the apparel segment is projected to exhibit robust growth driven by rising global apparel consumption, while the home textiles segment experiences steady growth. The market size and growth projections for each segment are detailed within the full report.

Key Drivers of Cotton Industry Growth

Several factors drive the growth of the cotton industry. Increasing global population and rising disposable incomes fuel demand for clothing and textiles. Technological advancements in cotton production, such as improved seed varieties and precision agriculture techniques, boost yields and efficiency. Favorable government policies supporting cotton cultivation in key producing regions also contribute to growth. Finally, the growing demand for sustainable and ethically sourced cotton opens up new market opportunities and encourages innovation within the industry.

Challenges in the Cotton Industry Sector

The cotton industry faces several challenges. Fluctuations in cotton prices create uncertainty for farmers and processors. Climate change impacts on crop yields pose a significant threat to production stability. The growing competition from synthetic fibers, particularly in certain applications, necessitates innovation and diversification. Lastly, regulatory hurdles and supply chain disruptions can impact market efficiency and profitability. The combined impact of these challenges is estimated to reduce potential market growth by xx% during the forecast period.

Emerging Opportunities in Cotton Industry

Emerging opportunities include the growing demand for organic and sustainable cotton, which presents a significant market for eco-conscious consumers. Technological innovations in textile processing and finishing offer potential to enhance the performance and value of cotton products. The increasing adoption of precision agriculture techniques and digital technologies for farm management improve efficiency and productivity. Finally, expanding into new markets in developing economies presents further growth potential.

Leading Players in the Cotton Industry Market

  • Monsanto
  • National Cotton Council of America
  • Syngenta
  • The Texas Cotton Association
  • Cotton Incorporated
  • International Cotton Association
  • Bayer CropScience

Key Developments in Cotton Industry Industry

  • September 2022: Two new organic cotton varieties were made available to farmers in India, boosting the organic cotton segment's growth potential.

  • August 2022: Several major apparel brands joined the Organic Cotton Accelerator (OCA), signaling growing industry commitment to sustainable practices.

  • March 2022: Armor seed company launched two new cotton varieties with improved characteristics, enhancing competitiveness and production efficiency.

Strategic Outlook for Cotton Industry Market

The future of the cotton industry is characterized by a mix of challenges and opportunities. Sustainable practices and technological advancements will be crucial for ensuring long-term growth. The industry must adapt to changing consumer preferences and address environmental concerns to maintain its market share. The demand for high-quality, sustainably produced cotton is expected to drive future growth, presenting significant opportunities for companies that embrace innovation and sustainability.

Cotton Industry Segmentation

  • 1. Production Analysis
  • 2. Consumption Analysis
  • 3. Import Market Analysis (Value & Volume)
  • 4. Export Market Analysis (Value & Volume)
  • 5. Price Trend Analysis

Cotton Industry Segmentation By Geography

  • 1. North America
    • 1.1. United States
    • 1.2. Canada
    • 1.3. Mexico
  • 2. Europe
    • 2.1. Germany
    • 2.2. France
    • 2.3. Russia
    • 2.4. Greece
    • 2.5. Italy
  • 3. Asia Pacific
    • 3.1. China
    • 3.2. India
    • 3.3. Australia
    • 3.4. Pakistan
    • 3.5. Bangladesh
  • 4. South America
    • 4.1. Brazil
    • 4.2. Argentina
  • 5. Middle East
  • 6. South Africa
    • 6.1. Turkey
    • 6.2. Egypt
Cotton Industry Regional Share


Cotton Industry REPORT HIGHLIGHTS

AspectsDetails
Study Period 2019-2033
Base Year 2024
Estimated Year 2025
Forecast Period2025-2033
Historical Period2019-2024
Growth RateCAGR of 2.70% from 2019-2033
Segmentation
    • By Production Analysis
    • By Consumption Analysis
    • By Import Market Analysis (Value & Volume)
    • By Export Market Analysis (Value & Volume)
    • By Price Trend Analysis
  • By Geography
    • North America
      • United States
      • Canada
      • Mexico
    • Europe
      • Germany
      • France
      • Russia
      • Greece
      • Italy
    • Asia Pacific
      • China
      • India
      • Australia
      • Pakistan
      • Bangladesh
    • South America
      • Brazil
      • Argentina
    • Middle East
    • South Africa
      • Turkey
      • Egypt


Table of Contents

  1. 1. Introduction
    • 1.1. Research Scope
    • 1.2. Market Segmentation
    • 1.3. Research Methodology
    • 1.4. Definitions and Assumptions
  2. 2. Executive Summary
    • 2.1. Introduction
  3. 3. Market Dynamics
    • 3.1. Introduction
      • 3.2. Market Drivers
        • 3.2.1. Rising Demand for Milled and Broken Rice; Growing Preference for Speciality Rice Variety; Government Initiatives Supports Rice Production
      • 3.3. Market Restrains
        • 3.3.1. Lack of Supply Chain for Rice; Growing Agricultural Labor Crisis
      • 3.4. Market Trends
        • 3.4.1. Increasing demand for the cotton exports
  4. 4. Market Factor Analysis
    • 4.1. Porters Five Forces
    • 4.2. Supply/Value Chain
    • 4.3. PESTEL analysis
    • 4.4. Market Entropy
    • 4.5. Patent/Trademark Analysis
  5. 5. Global Cotton Industry Analysis, Insights and Forecast, 2019-2031
    • 5.1. Market Analysis, Insights and Forecast - by Production Analysis
      • 5.2. Market Analysis, Insights and Forecast - by Consumption Analysis
        • 5.3. Market Analysis, Insights and Forecast - by Import Market Analysis (Value & Volume)
          • 5.4. Market Analysis, Insights and Forecast - by Export Market Analysis (Value & Volume)
            • 5.5. Market Analysis, Insights and Forecast - by Price Trend Analysis
              • 5.6. Market Analysis, Insights and Forecast - by Region
                • 5.6.1. North America
                • 5.6.2. Europe
                • 5.6.3. Asia Pacific
                • 5.6.4. South America
                • 5.6.5. Middle East
                • 5.6.6. South Africa
            • 6. North America Cotton Industry Analysis, Insights and Forecast, 2019-2031
              • 6.1. Market Analysis, Insights and Forecast - by Production Analysis
                • 6.2. Market Analysis, Insights and Forecast - by Consumption Analysis
                  • 6.3. Market Analysis, Insights and Forecast - by Import Market Analysis (Value & Volume)
                    • 6.4. Market Analysis, Insights and Forecast - by Export Market Analysis (Value & Volume)
                      • 6.5. Market Analysis, Insights and Forecast - by Price Trend Analysis
                      • 7. Europe Cotton Industry Analysis, Insights and Forecast, 2019-2031
                        • 7.1. Market Analysis, Insights and Forecast - by Production Analysis
                          • 7.2. Market Analysis, Insights and Forecast - by Consumption Analysis
                            • 7.3. Market Analysis, Insights and Forecast - by Import Market Analysis (Value & Volume)
                              • 7.4. Market Analysis, Insights and Forecast - by Export Market Analysis (Value & Volume)
                                • 7.5. Market Analysis, Insights and Forecast - by Price Trend Analysis
                                • 8. Asia Pacific Cotton Industry Analysis, Insights and Forecast, 2019-2031
                                  • 8.1. Market Analysis, Insights and Forecast - by Production Analysis
                                    • 8.2. Market Analysis, Insights and Forecast - by Consumption Analysis
                                      • 8.3. Market Analysis, Insights and Forecast - by Import Market Analysis (Value & Volume)
                                        • 8.4. Market Analysis, Insights and Forecast - by Export Market Analysis (Value & Volume)
                                          • 8.5. Market Analysis, Insights and Forecast - by Price Trend Analysis
                                          • 9. South America Cotton Industry Analysis, Insights and Forecast, 2019-2031
                                            • 9.1. Market Analysis, Insights and Forecast - by Production Analysis
                                              • 9.2. Market Analysis, Insights and Forecast - by Consumption Analysis
                                                • 9.3. Market Analysis, Insights and Forecast - by Import Market Analysis (Value & Volume)
                                                  • 9.4. Market Analysis, Insights and Forecast - by Export Market Analysis (Value & Volume)
                                                    • 9.5. Market Analysis, Insights and Forecast - by Price Trend Analysis
                                                    • 10. Middle East Cotton Industry Analysis, Insights and Forecast, 2019-2031
                                                      • 10.1. Market Analysis, Insights and Forecast - by Production Analysis
                                                        • 10.2. Market Analysis, Insights and Forecast - by Consumption Analysis
                                                          • 10.3. Market Analysis, Insights and Forecast - by Import Market Analysis (Value & Volume)
                                                            • 10.4. Market Analysis, Insights and Forecast - by Export Market Analysis (Value & Volume)
                                                              • 10.5. Market Analysis, Insights and Forecast - by Price Trend Analysis
                                                              • 11. South Africa Cotton Industry Analysis, Insights and Forecast, 2019-2031
                                                                • 11.1. Market Analysis, Insights and Forecast - by Production Analysis
                                                                  • 11.2. Market Analysis, Insights and Forecast - by Consumption Analysis
                                                                    • 11.3. Market Analysis, Insights and Forecast - by Import Market Analysis (Value & Volume)
                                                                      • 11.4. Market Analysis, Insights and Forecast - by Export Market Analysis (Value & Volume)
                                                                        • 11.5. Market Analysis, Insights and Forecast - by Price Trend Analysis
                                                                        • 12. South America Cotton Industry Analysis, Insights and Forecast, 2019-2031
                                                                            • 12.1. Market Analysis, Insights and Forecast - By Country/Sub-region
                                                                              • 12.1.1 Brazil
                                                                              • 12.1.2 Argentina
                                                                              • 12.1.3 Rest of South America
                                                                        • 13. North America Cotton Industry Analysis, Insights and Forecast, 2019-2031
                                                                            • 13.1. Market Analysis, Insights and Forecast - By Country/Sub-region
                                                                              • 13.1.1 United States
                                                                              • 13.1.2 Canada
                                                                              • 13.1.3 Mexico
                                                                        • 14. Asia Pacific Cotton Industry Analysis, Insights and Forecast, 2019-2031
                                                                            • 14.1. Market Analysis, Insights and Forecast - By Country/Sub-region
                                                                              • 14.1.1 China
                                                                              • 14.1.2 Japan
                                                                              • 14.1.3 India
                                                                              • 14.1.4 South Korea
                                                                              • 14.1.5 Taiwan
                                                                              • 14.1.6 Australia
                                                                              • 14.1.7 Rest of Asia-Pacific
                                                                        • 15. Europe Cotton Industry Analysis, Insights and Forecast, 2019-2031
                                                                            • 15.1. Market Analysis, Insights and Forecast - By Country/Sub-region
                                                                              • 15.1.1 Germany
                                                                              • 15.1.2 France
                                                                              • 15.1.3 Italy
                                                                              • 15.1.4 United Kingdom
                                                                              • 15.1.5 Netherlands
                                                                              • 15.1.6 Rest of Europe
                                                                        • 16. MEA Cotton Industry Analysis, Insights and Forecast, 2019-2031
                                                                            • 16.1. Market Analysis, Insights and Forecast - By Country/Sub-region
                                                                              • 16.1.1 Middle East
                                                                              • 16.1.2 Africa
                                                                        • 17. Competitive Analysis
                                                                          • 17.1. Global Market Share Analysis 2024
                                                                            • 17.2. Company Profiles
                                                                              • 17.2.1 Monsanto
                                                                                • 17.2.1.1. Overview
                                                                                • 17.2.1.2. Products
                                                                                • 17.2.1.3. SWOT Analysis
                                                                                • 17.2.1.4. Recent Developments
                                                                                • 17.2.1.5. Financials (Based on Availability)
                                                                              • 17.2.2 National Cotton Council of America
                                                                                • 17.2.2.1. Overview
                                                                                • 17.2.2.2. Products
                                                                                • 17.2.2.3. SWOT Analysis
                                                                                • 17.2.2.4. Recent Developments
                                                                                • 17.2.2.5. Financials (Based on Availability)
                                                                              • 17.2.3 Syngenta
                                                                                • 17.2.3.1. Overview
                                                                                • 17.2.3.2. Products
                                                                                • 17.2.3.3. SWOT Analysis
                                                                                • 17.2.3.4. Recent Developments
                                                                                • 17.2.3.5. Financials (Based on Availability)
                                                                              • 17.2.4 The Texas Cotton Association
                                                                                • 17.2.4.1. Overview
                                                                                • 17.2.4.2. Products
                                                                                • 17.2.4.3. SWOT Analysis
                                                                                • 17.2.4.4. Recent Developments
                                                                                • 17.2.4.5. Financials (Based on Availability)
                                                                              • 17.2.5 Cotton Incorporated
                                                                                • 17.2.5.1. Overview
                                                                                • 17.2.5.2. Products
                                                                                • 17.2.5.3. SWOT Analysis
                                                                                • 17.2.5.4. Recent Developments
                                                                                • 17.2.5.5. Financials (Based on Availability)
                                                                              • 17.2.6 International Cotton Association
                                                                                • 17.2.6.1. Overview
                                                                                • 17.2.6.2. Products
                                                                                • 17.2.6.3. SWOT Analysis
                                                                                • 17.2.6.4. Recent Developments
                                                                                • 17.2.6.5. Financials (Based on Availability)
                                                                              • 17.2.7 Bayer CropScience
                                                                                • 17.2.7.1. Overview
                                                                                • 17.2.7.2. Products
                                                                                • 17.2.7.3. SWOT Analysis
                                                                                • 17.2.7.4. Recent Developments
                                                                                • 17.2.7.5. Financials (Based on Availability)

                                                                        List of Figures

                                                                        1. Figure 1: Global Cotton Industry Revenue Breakdown (Million, %) by Region 2024 & 2032
                                                                        2. Figure 2: Global Cotton Industry Volume Breakdown (Kiloton, %) by Region 2024 & 2032
                                                                        3. Figure 3: South America Cotton Industry Revenue (Million), by Country 2024 & 2032
                                                                        4. Figure 4: South America Cotton Industry Volume (Kiloton), by Country 2024 & 2032
                                                                        5. Figure 5: South America Cotton Industry Revenue Share (%), by Country 2024 & 2032
                                                                        6. Figure 6: South America Cotton Industry Volume Share (%), by Country 2024 & 2032
                                                                        7. Figure 7: North America Cotton Industry Revenue (Million), by Country 2024 & 2032
                                                                        8. Figure 8: North America Cotton Industry Volume (Kiloton), by Country 2024 & 2032
                                                                        9. Figure 9: North America Cotton Industry Revenue Share (%), by Country 2024 & 2032
                                                                        10. Figure 10: North America Cotton Industry Volume Share (%), by Country 2024 & 2032
                                                                        11. Figure 11: Asia Pacific Cotton Industry Revenue (Million), by Country 2024 & 2032
                                                                        12. Figure 12: Asia Pacific Cotton Industry Volume (Kiloton), by Country 2024 & 2032
                                                                        13. Figure 13: Asia Pacific Cotton Industry Revenue Share (%), by Country 2024 & 2032
                                                                        14. Figure 14: Asia Pacific Cotton Industry Volume Share (%), by Country 2024 & 2032
                                                                        15. Figure 15: Europe Cotton Industry Revenue (Million), by Country 2024 & 2032
                                                                        16. Figure 16: Europe Cotton Industry Volume (Kiloton), by Country 2024 & 2032
                                                                        17. Figure 17: Europe Cotton Industry Revenue Share (%), by Country 2024 & 2032
                                                                        18. Figure 18: Europe Cotton Industry Volume Share (%), by Country 2024 & 2032
                                                                        19. Figure 19: MEA Cotton Industry Revenue (Million), by Country 2024 & 2032
                                                                        20. Figure 20: MEA Cotton Industry Volume (Kiloton), by Country 2024 & 2032
                                                                        21. Figure 21: MEA Cotton Industry Revenue Share (%), by Country 2024 & 2032
                                                                        22. Figure 22: MEA Cotton Industry Volume Share (%), by Country 2024 & 2032
                                                                        23. Figure 23: North America Cotton Industry Revenue (Million), by Production Analysis 2024 & 2032
                                                                        24. Figure 24: North America Cotton Industry Volume (Kiloton), by Production Analysis 2024 & 2032
                                                                        25. Figure 25: North America Cotton Industry Revenue Share (%), by Production Analysis 2024 & 2032
                                                                        26. Figure 26: North America Cotton Industry Volume Share (%), by Production Analysis 2024 & 2032
                                                                        27. Figure 27: North America Cotton Industry Revenue (Million), by Consumption Analysis 2024 & 2032
                                                                        28. Figure 28: North America Cotton Industry Volume (Kiloton), by Consumption Analysis 2024 & 2032
                                                                        29. Figure 29: North America Cotton Industry Revenue Share (%), by Consumption Analysis 2024 & 2032
                                                                        30. Figure 30: North America Cotton Industry Volume Share (%), by Consumption Analysis 2024 & 2032
                                                                        31. Figure 31: North America Cotton Industry Revenue (Million), by Import Market Analysis (Value & Volume) 2024 & 2032
                                                                        32. Figure 32: North America Cotton Industry Volume (Kiloton), by Import Market Analysis (Value & Volume) 2024 & 2032
                                                                        33. Figure 33: North America Cotton Industry Revenue Share (%), by Import Market Analysis (Value & Volume) 2024 & 2032
                                                                        34. Figure 34: North America Cotton Industry Volume Share (%), by Import Market Analysis (Value & Volume) 2024 & 2032
                                                                        35. Figure 35: North America Cotton Industry Revenue (Million), by Export Market Analysis (Value & Volume) 2024 & 2032
                                                                        36. Figure 36: North America Cotton Industry Volume (Kiloton), by Export Market Analysis (Value & Volume) 2024 & 2032
                                                                        37. Figure 37: North America Cotton Industry Revenue Share (%), by Export Market Analysis (Value & Volume) 2024 & 2032
                                                                        38. Figure 38: North America Cotton Industry Volume Share (%), by Export Market Analysis (Value & Volume) 2024 & 2032
                                                                        39. Figure 39: North America Cotton Industry Revenue (Million), by Price Trend Analysis 2024 & 2032
                                                                        40. Figure 40: North America Cotton Industry Volume (Kiloton), by Price Trend Analysis 2024 & 2032
                                                                        41. Figure 41: North America Cotton Industry Revenue Share (%), by Price Trend Analysis 2024 & 2032
                                                                        42. Figure 42: North America Cotton Industry Volume Share (%), by Price Trend Analysis 2024 & 2032
                                                                        43. Figure 43: North America Cotton Industry Revenue (Million), by Country 2024 & 2032
                                                                        44. Figure 44: North America Cotton Industry Volume (Kiloton), by Country 2024 & 2032
                                                                        45. Figure 45: North America Cotton Industry Revenue Share (%), by Country 2024 & 2032
                                                                        46. Figure 46: North America Cotton Industry Volume Share (%), by Country 2024 & 2032
                                                                        47. Figure 47: Europe Cotton Industry Revenue (Million), by Production Analysis 2024 & 2032
                                                                        48. Figure 48: Europe Cotton Industry Volume (Kiloton), by Production Analysis 2024 & 2032
                                                                        49. Figure 49: Europe Cotton Industry Revenue Share (%), by Production Analysis 2024 & 2032
                                                                        50. Figure 50: Europe Cotton Industry Volume Share (%), by Production Analysis 2024 & 2032
                                                                        51. Figure 51: Europe Cotton Industry Revenue (Million), by Consumption Analysis 2024 & 2032
                                                                        52. Figure 52: Europe Cotton Industry Volume (Kiloton), by Consumption Analysis 2024 & 2032
                                                                        53. Figure 53: Europe Cotton Industry Revenue Share (%), by Consumption Analysis 2024 & 2032
                                                                        54. Figure 54: Europe Cotton Industry Volume Share (%), by Consumption Analysis 2024 & 2032
                                                                        55. Figure 55: Europe Cotton Industry Revenue (Million), by Import Market Analysis (Value & Volume) 2024 & 2032
                                                                        56. Figure 56: Europe Cotton Industry Volume (Kiloton), by Import Market Analysis (Value & Volume) 2024 & 2032
                                                                        57. Figure 57: Europe Cotton Industry Revenue Share (%), by Import Market Analysis (Value & Volume) 2024 & 2032
                                                                        58. Figure 58: Europe Cotton Industry Volume Share (%), by Import Market Analysis (Value & Volume) 2024 & 2032
                                                                        59. Figure 59: Europe Cotton Industry Revenue (Million), by Export Market Analysis (Value & Volume) 2024 & 2032
                                                                        60. Figure 60: Europe Cotton Industry Volume (Kiloton), by Export Market Analysis (Value & Volume) 2024 & 2032
                                                                        61. Figure 61: Europe Cotton Industry Revenue Share (%), by Export Market Analysis (Value & Volume) 2024 & 2032
                                                                        62. Figure 62: Europe Cotton Industry Volume Share (%), by Export Market Analysis (Value & Volume) 2024 & 2032
                                                                        63. Figure 63: Europe Cotton Industry Revenue (Million), by Price Trend Analysis 2024 & 2032
                                                                        64. Figure 64: Europe Cotton Industry Volume (Kiloton), by Price Trend Analysis 2024 & 2032
                                                                        65. Figure 65: Europe Cotton Industry Revenue Share (%), by Price Trend Analysis 2024 & 2032
                                                                        66. Figure 66: Europe Cotton Industry Volume Share (%), by Price Trend Analysis 2024 & 2032
                                                                        67. Figure 67: Europe Cotton Industry Revenue (Million), by Country 2024 & 2032
                                                                        68. Figure 68: Europe Cotton Industry Volume (Kiloton), by Country 2024 & 2032
                                                                        69. Figure 69: Europe Cotton Industry Revenue Share (%), by Country 2024 & 2032
                                                                        70. Figure 70: Europe Cotton Industry Volume Share (%), by Country 2024 & 2032
                                                                        71. Figure 71: Asia Pacific Cotton Industry Revenue (Million), by Production Analysis 2024 & 2032
                                                                        72. Figure 72: Asia Pacific Cotton Industry Volume (Kiloton), by Production Analysis 2024 & 2032
                                                                        73. Figure 73: Asia Pacific Cotton Industry Revenue Share (%), by Production Analysis 2024 & 2032
                                                                        74. Figure 74: Asia Pacific Cotton Industry Volume Share (%), by Production Analysis 2024 & 2032
                                                                        75. Figure 75: Asia Pacific Cotton Industry Revenue (Million), by Consumption Analysis 2024 & 2032
                                                                        76. Figure 76: Asia Pacific Cotton Industry Volume (Kiloton), by Consumption Analysis 2024 & 2032
                                                                        77. Figure 77: Asia Pacific Cotton Industry Revenue Share (%), by Consumption Analysis 2024 & 2032
                                                                        78. Figure 78: Asia Pacific Cotton Industry Volume Share (%), by Consumption Analysis 2024 & 2032
                                                                        79. Figure 79: Asia Pacific Cotton Industry Revenue (Million), by Import Market Analysis (Value & Volume) 2024 & 2032
                                                                        80. Figure 80: Asia Pacific Cotton Industry Volume (Kiloton), by Import Market Analysis (Value & Volume) 2024 & 2032
                                                                        81. Figure 81: Asia Pacific Cotton Industry Revenue Share (%), by Import Market Analysis (Value & Volume) 2024 & 2032
                                                                        82. Figure 82: Asia Pacific Cotton Industry Volume Share (%), by Import Market Analysis (Value & Volume) 2024 & 2032
                                                                        83. Figure 83: Asia Pacific Cotton Industry Revenue (Million), by Export Market Analysis (Value & Volume) 2024 & 2032
                                                                        84. Figure 84: Asia Pacific Cotton Industry Volume (Kiloton), by Export Market Analysis (Value & Volume) 2024 & 2032
                                                                        85. Figure 85: Asia Pacific Cotton Industry Revenue Share (%), by Export Market Analysis (Value & Volume) 2024 & 2032
                                                                        86. Figure 86: Asia Pacific Cotton Industry Volume Share (%), by Export Market Analysis (Value & Volume) 2024 & 2032
                                                                        87. Figure 87: Asia Pacific Cotton Industry Revenue (Million), by Price Trend Analysis 2024 & 2032
                                                                        88. Figure 88: Asia Pacific Cotton Industry Volume (Kiloton), by Price Trend Analysis 2024 & 2032
                                                                        89. Figure 89: Asia Pacific Cotton Industry Revenue Share (%), by Price Trend Analysis 2024 & 2032
                                                                        90. Figure 90: Asia Pacific Cotton Industry Volume Share (%), by Price Trend Analysis 2024 & 2032
                                                                        91. Figure 91: Asia Pacific Cotton Industry Revenue (Million), by Country 2024 & 2032
                                                                        92. Figure 92: Asia Pacific Cotton Industry Volume (Kiloton), by Country 2024 & 2032
                                                                        93. Figure 93: Asia Pacific Cotton Industry Revenue Share (%), by Country 2024 & 2032
                                                                        94. Figure 94: Asia Pacific Cotton Industry Volume Share (%), by Country 2024 & 2032
                                                                        95. Figure 95: South America Cotton Industry Revenue (Million), by Production Analysis 2024 & 2032
                                                                        96. Figure 96: South America Cotton Industry Volume (Kiloton), by Production Analysis 2024 & 2032
                                                                        97. Figure 97: South America Cotton Industry Revenue Share (%), by Production Analysis 2024 & 2032
                                                                        98. Figure 98: South America Cotton Industry Volume Share (%), by Production Analysis 2024 & 2032
                                                                        99. Figure 99: South America Cotton Industry Revenue (Million), by Consumption Analysis 2024 & 2032
                                                                        100. Figure 100: South America Cotton Industry Volume (Kiloton), by Consumption Analysis 2024 & 2032
                                                                        101. Figure 101: South America Cotton Industry Revenue Share (%), by Consumption Analysis 2024 & 2032
                                                                        102. Figure 102: South America Cotton Industry Volume Share (%), by Consumption Analysis 2024 & 2032
                                                                        103. Figure 103: South America Cotton Industry Revenue (Million), by Import Market Analysis (Value & Volume) 2024 & 2032
                                                                        104. Figure 104: South America Cotton Industry Volume (Kiloton), by Import Market Analysis (Value & Volume) 2024 & 2032
                                                                        105. Figure 105: South America Cotton Industry Revenue Share (%), by Import Market Analysis (Value & Volume) 2024 & 2032
                                                                        106. Figure 106: South America Cotton Industry Volume Share (%), by Import Market Analysis (Value & Volume) 2024 & 2032
                                                                        107. Figure 107: South America Cotton Industry Revenue (Million), by Export Market Analysis (Value & Volume) 2024 & 2032
                                                                        108. Figure 108: South America Cotton Industry Volume (Kiloton), by Export Market Analysis (Value & Volume) 2024 & 2032
                                                                        109. Figure 109: South America Cotton Industry Revenue Share (%), by Export Market Analysis (Value & Volume) 2024 & 2032
                                                                        110. Figure 110: South America Cotton Industry Volume Share (%), by Export Market Analysis (Value & Volume) 2024 & 2032
                                                                        111. Figure 111: South America Cotton Industry Revenue (Million), by Price Trend Analysis 2024 & 2032
                                                                        112. Figure 112: South America Cotton Industry Volume (Kiloton), by Price Trend Analysis 2024 & 2032
                                                                        113. Figure 113: South America Cotton Industry Revenue Share (%), by Price Trend Analysis 2024 & 2032
                                                                        114. Figure 114: South America Cotton Industry Volume Share (%), by Price Trend Analysis 2024 & 2032
                                                                        115. Figure 115: South America Cotton Industry Revenue (Million), by Country 2024 & 2032
                                                                        116. Figure 116: South America Cotton Industry Volume (Kiloton), by Country 2024 & 2032
                                                                        117. Figure 117: South America Cotton Industry Revenue Share (%), by Country 2024 & 2032
                                                                        118. Figure 118: South America Cotton Industry Volume Share (%), by Country 2024 & 2032
                                                                        119. Figure 119: Middle East Cotton Industry Revenue (Million), by Production Analysis 2024 & 2032
                                                                        120. Figure 120: Middle East Cotton Industry Volume (Kiloton), by Production Analysis 2024 & 2032
                                                                        121. Figure 121: Middle East Cotton Industry Revenue Share (%), by Production Analysis 2024 & 2032
                                                                        122. Figure 122: Middle East Cotton Industry Volume Share (%), by Production Analysis 2024 & 2032
                                                                        123. Figure 123: Middle East Cotton Industry Revenue (Million), by Consumption Analysis 2024 & 2032
                                                                        124. Figure 124: Middle East Cotton Industry Volume (Kiloton), by Consumption Analysis 2024 & 2032
                                                                        125. Figure 125: Middle East Cotton Industry Revenue Share (%), by Consumption Analysis 2024 & 2032
                                                                        126. Figure 126: Middle East Cotton Industry Volume Share (%), by Consumption Analysis 2024 & 2032
                                                                        127. Figure 127: Middle East Cotton Industry Revenue (Million), by Import Market Analysis (Value & Volume) 2024 & 2032
                                                                        128. Figure 128: Middle East Cotton Industry Volume (Kiloton), by Import Market Analysis (Value & Volume) 2024 & 2032
                                                                        129. Figure 129: Middle East Cotton Industry Revenue Share (%), by Import Market Analysis (Value & Volume) 2024 & 2032
                                                                        130. Figure 130: Middle East Cotton Industry Volume Share (%), by Import Market Analysis (Value & Volume) 2024 & 2032
                                                                        131. Figure 131: Middle East Cotton Industry Revenue (Million), by Export Market Analysis (Value & Volume) 2024 & 2032
                                                                        132. Figure 132: Middle East Cotton Industry Volume (Kiloton), by Export Market Analysis (Value & Volume) 2024 & 2032
                                                                        133. Figure 133: Middle East Cotton Industry Revenue Share (%), by Export Market Analysis (Value & Volume) 2024 & 2032
                                                                        134. Figure 134: Middle East Cotton Industry Volume Share (%), by Export Market Analysis (Value & Volume) 2024 & 2032
                                                                        135. Figure 135: Middle East Cotton Industry Revenue (Million), by Price Trend Analysis 2024 & 2032
                                                                        136. Figure 136: Middle East Cotton Industry Volume (Kiloton), by Price Trend Analysis 2024 & 2032
                                                                        137. Figure 137: Middle East Cotton Industry Revenue Share (%), by Price Trend Analysis 2024 & 2032
                                                                        138. Figure 138: Middle East Cotton Industry Volume Share (%), by Price Trend Analysis 2024 & 2032
                                                                        139. Figure 139: Middle East Cotton Industry Revenue (Million), by Country 2024 & 2032
                                                                        140. Figure 140: Middle East Cotton Industry Volume (Kiloton), by Country 2024 & 2032
                                                                        141. Figure 141: Middle East Cotton Industry Revenue Share (%), by Country 2024 & 2032
                                                                        142. Figure 142: Middle East Cotton Industry Volume Share (%), by Country 2024 & 2032
                                                                        143. Figure 143: South Africa Cotton Industry Revenue (Million), by Production Analysis 2024 & 2032
                                                                        144. Figure 144: South Africa Cotton Industry Volume (Kiloton), by Production Analysis 2024 & 2032
                                                                        145. Figure 145: South Africa Cotton Industry Revenue Share (%), by Production Analysis 2024 & 2032
                                                                        146. Figure 146: South Africa Cotton Industry Volume Share (%), by Production Analysis 2024 & 2032
                                                                        147. Figure 147: South Africa Cotton Industry Revenue (Million), by Consumption Analysis 2024 & 2032
                                                                        148. Figure 148: South Africa Cotton Industry Volume (Kiloton), by Consumption Analysis 2024 & 2032
                                                                        149. Figure 149: South Africa Cotton Industry Revenue Share (%), by Consumption Analysis 2024 & 2032
                                                                        150. Figure 150: South Africa Cotton Industry Volume Share (%), by Consumption Analysis 2024 & 2032
                                                                        151. Figure 151: South Africa Cotton Industry Revenue (Million), by Import Market Analysis (Value & Volume) 2024 & 2032
                                                                        152. Figure 152: South Africa Cotton Industry Volume (Kiloton), by Import Market Analysis (Value & Volume) 2024 & 2032
                                                                        153. Figure 153: South Africa Cotton Industry Revenue Share (%), by Import Market Analysis (Value & Volume) 2024 & 2032
                                                                        154. Figure 154: South Africa Cotton Industry Volume Share (%), by Import Market Analysis (Value & Volume) 2024 & 2032
                                                                        155. Figure 155: South Africa Cotton Industry Revenue (Million), by Export Market Analysis (Value & Volume) 2024 & 2032
                                                                        156. Figure 156: South Africa Cotton Industry Volume (Kiloton), by Export Market Analysis (Value & Volume) 2024 & 2032
                                                                        157. Figure 157: South Africa Cotton Industry Revenue Share (%), by Export Market Analysis (Value & Volume) 2024 & 2032
                                                                        158. Figure 158: South Africa Cotton Industry Volume Share (%), by Export Market Analysis (Value & Volume) 2024 & 2032
                                                                        159. Figure 159: South Africa Cotton Industry Revenue (Million), by Price Trend Analysis 2024 & 2032
                                                                        160. Figure 160: South Africa Cotton Industry Volume (Kiloton), by Price Trend Analysis 2024 & 2032
                                                                        161. Figure 161: South Africa Cotton Industry Revenue Share (%), by Price Trend Analysis 2024 & 2032
                                                                        162. Figure 162: South Africa Cotton Industry Volume Share (%), by Price Trend Analysis 2024 & 2032
                                                                        163. Figure 163: South Africa Cotton Industry Revenue (Million), by Country 2024 & 2032
                                                                        164. Figure 164: South Africa Cotton Industry Volume (Kiloton), by Country 2024 & 2032
                                                                        165. Figure 165: South Africa Cotton Industry Revenue Share (%), by Country 2024 & 2032
                                                                        166. Figure 166: South Africa Cotton Industry Volume Share (%), by Country 2024 & 2032

                                                                        List of Tables

                                                                        1. Table 1: Global Cotton Industry Revenue Million Forecast, by Region 2019 & 2032
                                                                        2. Table 2: Global Cotton Industry Volume Kiloton Forecast, by Region 2019 & 2032
                                                                        3. Table 3: Global Cotton Industry Revenue Million Forecast, by Production Analysis 2019 & 2032
                                                                        4. Table 4: Global Cotton Industry Volume Kiloton Forecast, by Production Analysis 2019 & 2032
                                                                        5. Table 5: Global Cotton Industry Revenue Million Forecast, by Consumption Analysis 2019 & 2032
                                                                        6. Table 6: Global Cotton Industry Volume Kiloton Forecast, by Consumption Analysis 2019 & 2032
                                                                        7. Table 7: Global Cotton Industry Revenue Million Forecast, by Import Market Analysis (Value & Volume) 2019 & 2032
                                                                        8. Table 8: Global Cotton Industry Volume Kiloton Forecast, by Import Market Analysis (Value & Volume) 2019 & 2032
                                                                        9. Table 9: Global Cotton Industry Revenue Million Forecast, by Export Market Analysis (Value & Volume) 2019 & 2032
                                                                        10. Table 10: Global Cotton Industry Volume Kiloton Forecast, by Export Market Analysis (Value & Volume) 2019 & 2032
                                                                        11. Table 11: Global Cotton Industry Revenue Million Forecast, by Price Trend Analysis 2019 & 2032
                                                                        12. Table 12: Global Cotton Industry Volume Kiloton Forecast, by Price Trend Analysis 2019 & 2032
                                                                        13. Table 13: Global Cotton Industry Revenue Million Forecast, by Region 2019 & 2032
                                                                        14. Table 14: Global Cotton Industry Volume Kiloton Forecast, by Region 2019 & 2032
                                                                        15. Table 15: Global Cotton Industry Revenue Million Forecast, by Country 2019 & 2032
                                                                        16. Table 16: Global Cotton Industry Volume Kiloton Forecast, by Country 2019 & 2032
                                                                        17. Table 17: Brazil Cotton Industry Revenue (Million) Forecast, by Application 2019 & 2032
                                                                        18. Table 18: Brazil Cotton Industry Volume (Kiloton) Forecast, by Application 2019 & 2032
                                                                        19. Table 19: Argentina Cotton Industry Revenue (Million) Forecast, by Application 2019 & 2032
                                                                        20. Table 20: Argentina Cotton Industry Volume (Kiloton) Forecast, by Application 2019 & 2032
                                                                        21. Table 21: Rest of South America Cotton Industry Revenue (Million) Forecast, by Application 2019 & 2032
                                                                        22. Table 22: Rest of South America Cotton Industry Volume (Kiloton) Forecast, by Application 2019 & 2032
                                                                        23. Table 23: Global Cotton Industry Revenue Million Forecast, by Country 2019 & 2032
                                                                        24. Table 24: Global Cotton Industry Volume Kiloton Forecast, by Country 2019 & 2032
                                                                        25. Table 25: United States Cotton Industry Revenue (Million) Forecast, by Application 2019 & 2032
                                                                        26. Table 26: United States Cotton Industry Volume (Kiloton) Forecast, by Application 2019 & 2032
                                                                        27. Table 27: Canada Cotton Industry Revenue (Million) Forecast, by Application 2019 & 2032
                                                                        28. Table 28: Canada Cotton Industry Volume (Kiloton) Forecast, by Application 2019 & 2032
                                                                        29. Table 29: Mexico Cotton Industry Revenue (Million) Forecast, by Application 2019 & 2032
                                                                        30. Table 30: Mexico Cotton Industry Volume (Kiloton) Forecast, by Application 2019 & 2032
                                                                        31. Table 31: Global Cotton Industry Revenue Million Forecast, by Country 2019 & 2032
                                                                        32. Table 32: Global Cotton Industry Volume Kiloton Forecast, by Country 2019 & 2032
                                                                        33. Table 33: China Cotton Industry Revenue (Million) Forecast, by Application 2019 & 2032
                                                                        34. Table 34: China Cotton Industry Volume (Kiloton) Forecast, by Application 2019 & 2032
                                                                        35. Table 35: Japan Cotton Industry Revenue (Million) Forecast, by Application 2019 & 2032
                                                                        36. Table 36: Japan Cotton Industry Volume (Kiloton) Forecast, by Application 2019 & 2032
                                                                        37. Table 37: India Cotton Industry Revenue (Million) Forecast, by Application 2019 & 2032
                                                                        38. Table 38: India Cotton Industry Volume (Kiloton) Forecast, by Application 2019 & 2032
                                                                        39. Table 39: South Korea Cotton Industry Revenue (Million) Forecast, by Application 2019 & 2032
                                                                        40. Table 40: South Korea Cotton Industry Volume (Kiloton) Forecast, by Application 2019 & 2032
                                                                        41. Table 41: Taiwan Cotton Industry Revenue (Million) Forecast, by Application 2019 & 2032
                                                                        42. Table 42: Taiwan Cotton Industry Volume (Kiloton) Forecast, by Application 2019 & 2032
                                                                        43. Table 43: Australia Cotton Industry Revenue (Million) Forecast, by Application 2019 & 2032
                                                                        44. Table 44: Australia Cotton Industry Volume (Kiloton) Forecast, by Application 2019 & 2032
                                                                        45. Table 45: Rest of Asia-Pacific Cotton Industry Revenue (Million) Forecast, by Application 2019 & 2032
                                                                        46. Table 46: Rest of Asia-Pacific Cotton Industry Volume (Kiloton) Forecast, by Application 2019 & 2032
                                                                        47. Table 47: Global Cotton Industry Revenue Million Forecast, by Country 2019 & 2032
                                                                        48. Table 48: Global Cotton Industry Volume Kiloton Forecast, by Country 2019 & 2032
                                                                        49. Table 49: Germany Cotton Industry Revenue (Million) Forecast, by Application 2019 & 2032
                                                                        50. Table 50: Germany Cotton Industry Volume (Kiloton) Forecast, by Application 2019 & 2032
                                                                        51. Table 51: France Cotton Industry Revenue (Million) Forecast, by Application 2019 & 2032
                                                                        52. Table 52: France Cotton Industry Volume (Kiloton) Forecast, by Application 2019 & 2032
                                                                        53. Table 53: Italy Cotton Industry Revenue (Million) Forecast, by Application 2019 & 2032
                                                                        54. Table 54: Italy Cotton Industry Volume (Kiloton) Forecast, by Application 2019 & 2032
                                                                        55. Table 55: United Kingdom Cotton Industry Revenue (Million) Forecast, by Application 2019 & 2032
                                                                        56. Table 56: United Kingdom Cotton Industry Volume (Kiloton) Forecast, by Application 2019 & 2032
                                                                        57. Table 57: Netherlands Cotton Industry Revenue (Million) Forecast, by Application 2019 & 2032
                                                                        58. Table 58: Netherlands Cotton Industry Volume (Kiloton) Forecast, by Application 2019 & 2032
                                                                        59. Table 59: Rest of Europe Cotton Industry Revenue (Million) Forecast, by Application 2019 & 2032
                                                                        60. Table 60: Rest of Europe Cotton Industry Volume (Kiloton) Forecast, by Application 2019 & 2032
                                                                        61. Table 61: Global Cotton Industry Revenue Million Forecast, by Country 2019 & 2032
                                                                        62. Table 62: Global Cotton Industry Volume Kiloton Forecast, by Country 2019 & 2032
                                                                        63. Table 63: Middle East Cotton Industry Revenue (Million) Forecast, by Application 2019 & 2032
                                                                        64. Table 64: Middle East Cotton Industry Volume (Kiloton) Forecast, by Application 2019 & 2032
                                                                        65. Table 65: Africa Cotton Industry Revenue (Million) Forecast, by Application 2019 & 2032
                                                                        66. Table 66: Africa Cotton Industry Volume (Kiloton) Forecast, by Application 2019 & 2032
                                                                        67. Table 67: Global Cotton Industry Revenue Million Forecast, by Production Analysis 2019 & 2032
                                                                        68. Table 68: Global Cotton Industry Volume Kiloton Forecast, by Production Analysis 2019 & 2032
                                                                        69. Table 69: Global Cotton Industry Revenue Million Forecast, by Consumption Analysis 2019 & 2032
                                                                        70. Table 70: Global Cotton Industry Volume Kiloton Forecast, by Consumption Analysis 2019 & 2032
                                                                        71. Table 71: Global Cotton Industry Revenue Million Forecast, by Import Market Analysis (Value & Volume) 2019 & 2032
                                                                        72. Table 72: Global Cotton Industry Volume Kiloton Forecast, by Import Market Analysis (Value & Volume) 2019 & 2032
                                                                        73. Table 73: Global Cotton Industry Revenue Million Forecast, by Export Market Analysis (Value & Volume) 2019 & 2032
                                                                        74. Table 74: Global Cotton Industry Volume Kiloton Forecast, by Export Market Analysis (Value & Volume) 2019 & 2032
                                                                        75. Table 75: Global Cotton Industry Revenue Million Forecast, by Price Trend Analysis 2019 & 2032
                                                                        76. Table 76: Global Cotton Industry Volume Kiloton Forecast, by Price Trend Analysis 2019 & 2032
                                                                        77. Table 77: Global Cotton Industry Revenue Million Forecast, by Country 2019 & 2032
                                                                        78. Table 78: Global Cotton Industry Volume Kiloton Forecast, by Country 2019 & 2032
                                                                        79. Table 79: United States Cotton Industry Revenue (Million) Forecast, by Application 2019 & 2032
                                                                        80. Table 80: United States Cotton Industry Volume (Kiloton) Forecast, by Application 2019 & 2032
                                                                        81. Table 81: Canada Cotton Industry Revenue (Million) Forecast, by Application 2019 & 2032
                                                                        82. Table 82: Canada Cotton Industry Volume (Kiloton) Forecast, by Application 2019 & 2032
                                                                        83. Table 83: Mexico Cotton Industry Revenue (Million) Forecast, by Application 2019 & 2032
                                                                        84. Table 84: Mexico Cotton Industry Volume (Kiloton) Forecast, by Application 2019 & 2032
                                                                        85. Table 85: Global Cotton Industry Revenue Million Forecast, by Production Analysis 2019 & 2032
                                                                        86. Table 86: Global Cotton Industry Volume Kiloton Forecast, by Production Analysis 2019 & 2032
                                                                        87. Table 87: Global Cotton Industry Revenue Million Forecast, by Consumption Analysis 2019 & 2032
                                                                        88. Table 88: Global Cotton Industry Volume Kiloton Forecast, by Consumption Analysis 2019 & 2032
                                                                        89. Table 89: Global Cotton Industry Revenue Million Forecast, by Import Market Analysis (Value & Volume) 2019 & 2032
                                                                        90. Table 90: Global Cotton Industry Volume Kiloton Forecast, by Import Market Analysis (Value & Volume) 2019 & 2032
                                                                        91. Table 91: Global Cotton Industry Revenue Million Forecast, by Export Market Analysis (Value & Volume) 2019 & 2032
                                                                        92. Table 92: Global Cotton Industry Volume Kiloton Forecast, by Export Market Analysis (Value & Volume) 2019 & 2032
                                                                        93. Table 93: Global Cotton Industry Revenue Million Forecast, by Price Trend Analysis 2019 & 2032
                                                                        94. Table 94: Global Cotton Industry Volume Kiloton Forecast, by Price Trend Analysis 2019 & 2032
                                                                        95. Table 95: Global Cotton Industry Revenue Million Forecast, by Country 2019 & 2032
                                                                        96. Table 96: Global Cotton Industry Volume Kiloton Forecast, by Country 2019 & 2032
                                                                        97. Table 97: Germany Cotton Industry Revenue (Million) Forecast, by Application 2019 & 2032
                                                                        98. Table 98: Germany Cotton Industry Volume (Kiloton) Forecast, by Application 2019 & 2032
                                                                        99. Table 99: France Cotton Industry Revenue (Million) Forecast, by Application 2019 & 2032
                                                                        100. Table 100: France Cotton Industry Volume (Kiloton) Forecast, by Application 2019 & 2032
                                                                        101. Table 101: Russia Cotton Industry Revenue (Million) Forecast, by Application 2019 & 2032
                                                                        102. Table 102: Russia Cotton Industry Volume (Kiloton) Forecast, by Application 2019 & 2032
                                                                        103. Table 103: Greece Cotton Industry Revenue (Million) Forecast, by Application 2019 & 2032
                                                                        104. Table 104: Greece Cotton Industry Volume (Kiloton) Forecast, by Application 2019 & 2032
                                                                        105. Table 105: Italy Cotton Industry Revenue (Million) Forecast, by Application 2019 & 2032
                                                                        106. Table 106: Italy Cotton Industry Volume (Kiloton) Forecast, by Application 2019 & 2032
                                                                        107. Table 107: Global Cotton Industry Revenue Million Forecast, by Production Analysis 2019 & 2032
                                                                        108. Table 108: Global Cotton Industry Volume Kiloton Forecast, by Production Analysis 2019 & 2032
                                                                        109. Table 109: Global Cotton Industry Revenue Million Forecast, by Consumption Analysis 2019 & 2032
                                                                        110. Table 110: Global Cotton Industry Volume Kiloton Forecast, by Consumption Analysis 2019 & 2032
                                                                        111. Table 111: Global Cotton Industry Revenue Million Forecast, by Import Market Analysis (Value & Volume) 2019 & 2032
                                                                        112. Table 112: Global Cotton Industry Volume Kiloton Forecast, by Import Market Analysis (Value & Volume) 2019 & 2032
                                                                        113. Table 113: Global Cotton Industry Revenue Million Forecast, by Export Market Analysis (Value & Volume) 2019 & 2032
                                                                        114. Table 114: Global Cotton Industry Volume Kiloton Forecast, by Export Market Analysis (Value & Volume) 2019 & 2032
                                                                        115. Table 115: Global Cotton Industry Revenue Million Forecast, by Price Trend Analysis 2019 & 2032
                                                                        116. Table 116: Global Cotton Industry Volume Kiloton Forecast, by Price Trend Analysis 2019 & 2032
                                                                        117. Table 117: Global Cotton Industry Revenue Million Forecast, by Country 2019 & 2032
                                                                        118. Table 118: Global Cotton Industry Volume Kiloton Forecast, by Country 2019 & 2032
                                                                        119. Table 119: China Cotton Industry Revenue (Million) Forecast, by Application 2019 & 2032
                                                                        120. Table 120: China Cotton Industry Volume (Kiloton) Forecast, by Application 2019 & 2032
                                                                        121. Table 121: India Cotton Industry Revenue (Million) Forecast, by Application 2019 & 2032
                                                                        122. Table 122: India Cotton Industry Volume (Kiloton) Forecast, by Application 2019 & 2032
                                                                        123. Table 123: Australia Cotton Industry Revenue (Million) Forecast, by Application 2019 & 2032
                                                                        124. Table 124: Australia Cotton Industry Volume (Kiloton) Forecast, by Application 2019 & 2032
                                                                        125. Table 125: Pakistan Cotton Industry Revenue (Million) Forecast, by Application 2019 & 2032
                                                                        126. Table 126: Pakistan Cotton Industry Volume (Kiloton) Forecast, by Application 2019 & 2032
                                                                        127. Table 127: Bangladesh Cotton Industry Revenue (Million) Forecast, by Application 2019 & 2032
                                                                        128. Table 128: Bangladesh Cotton Industry Volume (Kiloton) Forecast, by Application 2019 & 2032
                                                                        129. Table 129: Global Cotton Industry Revenue Million Forecast, by Production Analysis 2019 & 2032
                                                                        130. Table 130: Global Cotton Industry Volume Kiloton Forecast, by Production Analysis 2019 & 2032
                                                                        131. Table 131: Global Cotton Industry Revenue Million Forecast, by Consumption Analysis 2019 & 2032
                                                                        132. Table 132: Global Cotton Industry Volume Kiloton Forecast, by Consumption Analysis 2019 & 2032
                                                                        133. Table 133: Global Cotton Industry Revenue Million Forecast, by Import Market Analysis (Value & Volume) 2019 & 2032
                                                                        134. Table 134: Global Cotton Industry Volume Kiloton Forecast, by Import Market Analysis (Value & Volume) 2019 & 2032
                                                                        135. Table 135: Global Cotton Industry Revenue Million Forecast, by Export Market Analysis (Value & Volume) 2019 & 2032
                                                                        136. Table 136: Global Cotton Industry Volume Kiloton Forecast, by Export Market Analysis (Value & Volume) 2019 & 2032
                                                                        137. Table 137: Global Cotton Industry Revenue Million Forecast, by Price Trend Analysis 2019 & 2032
                                                                        138. Table 138: Global Cotton Industry Volume Kiloton Forecast, by Price Trend Analysis 2019 & 2032
                                                                        139. Table 139: Global Cotton Industry Revenue Million Forecast, by Country 2019 & 2032
                                                                        140. Table 140: Global Cotton Industry Volume Kiloton Forecast, by Country 2019 & 2032
                                                                        141. Table 141: Brazil Cotton Industry Revenue (Million) Forecast, by Application 2019 & 2032
                                                                        142. Table 142: Brazil Cotton Industry Volume (Kiloton) Forecast, by Application 2019 & 2032
                                                                        143. Table 143: Argentina Cotton Industry Revenue (Million) Forecast, by Application 2019 & 2032
                                                                        144. Table 144: Argentina Cotton Industry Volume (Kiloton) Forecast, by Application 2019 & 2032
                                                                        145. Table 145: Global Cotton Industry Revenue Million Forecast, by Production Analysis 2019 & 2032
                                                                        146. Table 146: Global Cotton Industry Volume Kiloton Forecast, by Production Analysis 2019 & 2032
                                                                        147. Table 147: Global Cotton Industry Revenue Million Forecast, by Consumption Analysis 2019 & 2032
                                                                        148. Table 148: Global Cotton Industry Volume Kiloton Forecast, by Consumption Analysis 2019 & 2032
                                                                        149. Table 149: Global Cotton Industry Revenue Million Forecast, by Import Market Analysis (Value & Volume) 2019 & 2032
                                                                        150. Table 150: Global Cotton Industry Volume Kiloton Forecast, by Import Market Analysis (Value & Volume) 2019 & 2032
                                                                        151. Table 151: Global Cotton Industry Revenue Million Forecast, by Export Market Analysis (Value & Volume) 2019 & 2032
                                                                        152. Table 152: Global Cotton Industry Volume Kiloton Forecast, by Export Market Analysis (Value & Volume) 2019 & 2032
                                                                        153. Table 153: Global Cotton Industry Revenue Million Forecast, by Price Trend Analysis 2019 & 2032
                                                                        154. Table 154: Global Cotton Industry Volume Kiloton Forecast, by Price Trend Analysis 2019 & 2032
                                                                        155. Table 155: Global Cotton Industry Revenue Million Forecast, by Country 2019 & 2032
                                                                        156. Table 156: Global Cotton Industry Volume Kiloton Forecast, by Country 2019 & 2032
                                                                        157. Table 157: Global Cotton Industry Revenue Million Forecast, by Production Analysis 2019 & 2032
                                                                        158. Table 158: Global Cotton Industry Volume Kiloton Forecast, by Production Analysis 2019 & 2032
                                                                        159. Table 159: Global Cotton Industry Revenue Million Forecast, by Consumption Analysis 2019 & 2032
                                                                        160. Table 160: Global Cotton Industry Volume Kiloton Forecast, by Consumption Analysis 2019 & 2032
                                                                        161. Table 161: Global Cotton Industry Revenue Million Forecast, by Import Market Analysis (Value & Volume) 2019 & 2032
                                                                        162. Table 162: Global Cotton Industry Volume Kiloton Forecast, by Import Market Analysis (Value & Volume) 2019 & 2032
                                                                        163. Table 163: Global Cotton Industry Revenue Million Forecast, by Export Market Analysis (Value & Volume) 2019 & 2032
                                                                        164. Table 164: Global Cotton Industry Volume Kiloton Forecast, by Export Market Analysis (Value & Volume) 2019 & 2032
                                                                        165. Table 165: Global Cotton Industry Revenue Million Forecast, by Price Trend Analysis 2019 & 2032
                                                                        166. Table 166: Global Cotton Industry Volume Kiloton Forecast, by Price Trend Analysis 2019 & 2032
                                                                        167. Table 167: Global Cotton Industry Revenue Million Forecast, by Country 2019 & 2032
                                                                        168. Table 168: Global Cotton Industry Volume Kiloton Forecast, by Country 2019 & 2032
                                                                        169. Table 169: Turkey Cotton Industry Revenue (Million) Forecast, by Application 2019 & 2032
                                                                        170. Table 170: Turkey Cotton Industry Volume (Kiloton) Forecast, by Application 2019 & 2032
                                                                        171. Table 171: Egypt Cotton Industry Revenue (Million) Forecast, by Application 2019 & 2032
                                                                        172. Table 172: Egypt Cotton Industry Volume (Kiloton) Forecast, by Application 2019 & 2032


                                                                        Frequently Asked Questions

                                                                        1. What is the projected Compound Annual Growth Rate (CAGR) of the Cotton Industry?

                                                                        The projected CAGR is approximately 2.70%.

                                                                        2. Which companies are prominent players in the Cotton Industry?

                                                                        Key companies in the market include Monsanto, National Cotton Council of America, Syngenta , The Texas Cotton Association, Cotton Incorporated , International Cotton Association , Bayer CropScience .

                                                                        3. What are the main segments of the Cotton Industry?

                                                                        The market segments include Production Analysis, Consumption Analysis, Import Market Analysis (Value & Volume), Export Market Analysis (Value & Volume), Price Trend Analysis.

                                                                        4. Can you provide details about the market size?

                                                                        The market size is estimated to be USD 43.96 Million as of 2022.

                                                                        5. What are some drivers contributing to market growth?

                                                                        Rising Demand for Milled and Broken Rice; Growing Preference for Speciality Rice Variety; Government Initiatives Supports Rice Production.

                                                                        6. What are the notable trends driving market growth?

                                                                        Increasing demand for the cotton exports.

                                                                        7. Are there any restraints impacting market growth?

                                                                        Lack of Supply Chain for Rice; Growing Agricultural Labor Crisis.

                                                                        8. Can you provide examples of recent developments in the market?

                                                                        September 2022: The two first-ever new organic cotton varieties have been made available to farmers in India. These varieties were developed through a decentralized organic participatory breeding program of FiBL Switzerland and their partners.

                                                                        9. What pricing options are available for accessing the report?

                                                                        Pricing options include single-user, multi-user, and enterprise licenses priced at USD 4750, USD 5250, and USD 8750 respectively.

                                                                        10. Is the market size provided in terms of value or volume?

                                                                        The market size is provided in terms of value, measured in Million and volume, measured in Kiloton.

                                                                        11. Are there any specific market keywords associated with the report?

                                                                        Yes, the market keyword associated with the report is "Cotton Industry," which aids in identifying and referencing the specific market segment covered.

                                                                        12. How do I determine which pricing option suits my needs best?

                                                                        The pricing options vary based on user requirements and access needs. Individual users may opt for single-user licenses, while businesses requiring broader access may choose multi-user or enterprise licenses for cost-effective access to the report.

                                                                        13. Are there any additional resources or data provided in the Cotton Industry report?

                                                                        While the report offers comprehensive insights, it's advisable to review the specific contents or supplementary materials provided to ascertain if additional resources or data are available.

                                                                        14. How can I stay updated on further developments or reports in the Cotton Industry?

                                                                        To stay informed about further developments, trends, and reports in the Cotton Industry, consider subscribing to industry newsletters, following relevant companies and organizations, or regularly checking reputable industry news sources and publications.


                                                                        Methodology

                                                                        Step 1 - Identification of Relevant Samples Size from Population Database

                                                                        Step Chart
                                                                        Bar Chart
                                                                        Method Chart

                                                                        Step 2 - Approaches for Defining Global Market Size (Value, Volume* & Price*)

                                                                        Approach Chart
                                                                        Top-down and bottom-up approaches are used to validate the global market size and estimate the market size for manufactures, regional segments, product, and application.

                                                                        Note*: In applicable scenarios

                                                                        Step 3 - Data Sources

                                                                        Primary Research

                                                                        • Web Analytics
                                                                        • Survey Reports
                                                                        • Research Institute
                                                                        • Latest Research Reports
                                                                        • Opinion Leaders

                                                                        Secondary Research

                                                                        • Annual Reports
                                                                        • White Paper
                                                                        • Latest Press Release
                                                                        • Industry Association
                                                                        • Paid Database
                                                                        • Investor Presentations
                                                                        Analyst Chart

                                                                        Step 4 - Data Triangulation

                                                                        Involves using different sources of information in order to increase the validity of a study

                                                                        These sources are likely to be stakeholders in a program - participants, other researchers, program staff, other community members, and so on.

                                                                        Then we put all data in single framework & apply various statistical tools to find out the dynamic on the market.

                                                                        During the analysis stage, feedback from the stakeholder groups would be compared to determine areas of agreement as well as areas of divergence

                                                                        Additionally, after gathering mixed and scattered data from a wide range of sources, data is triangulated and correlated to come up with estimated figures which are further validated through primary mediums or industry experts, opinion leaders.

                                                                        About Research Axiom

                                                                        Research Axiom delivers in-depth market research, industry analysis, and consulting for pharmaceuticals, automotive, IT, and consumer goods. Our reports provide the clarity you need to make informed decisions and drive innovation.

                                                                        Our team combines primary research, advanced analytics, and sector expertise to deliver actionable intelligence. We offer syndicated reports, custom research, and consulting services tailored to your business needs.

                                                                        At Research Axiom, we are committed to quality, transparency, and client satisfaction. Every report is rigorously validated to ensure accuracy and relevance. Our global perspective and local expertise help you understand both the big picture and the finer details of your market.

                                                                        Stay informed with Research Axiom. Subscribe to our newsletter for the latest updates and research highlights, and follow us on social media for real-time insights. Research Axiom – Turning Data into Business Advantage.

                                                                        artwork spiralartwork spiralRelated Reports
                                                                        artwork underline

                                                                        Strategic Planning for North America Agricultural Irrigation Machinery Market Industry Expansion

                                                                        Discover the booming North American agricultural irrigation machinery market. This in-depth analysis reveals a 5.10% CAGR, driven by water scarcity, precision agriculture, and smart irrigation technology. Learn about key players, market trends, and future projections for 2025-2033.

                                                                        July 2025
                                                                        Base Year: 2024
                                                                        No Of Pages: 234
                                                                        Price: $4750

                                                                        Qatar Aquaculture and Fisheries Market Analysis Uncovered: Market Drivers and Forecasts 2025-2033

                                                                        Discover the booming Qatar aquaculture and fisheries market, projected to reach \$252.74 million by 2033 with a 5% CAGR. This in-depth analysis covers market size, key players (Al-Khaleej Seafoods, Al Rayan Shrimp Trading), segments (pelagic fish, shrimp, caviar), and future growth drivers.

                                                                        July 2025
                                                                        Base Year: 2024
                                                                        No Of Pages: 150
                                                                        Price: $3800

                                                                        U.S. Maize Industry Market Trends and Strategic Roadmap

                                                                        Discover the dynamic U.S. maize industry outlook with our comprehensive market analysis. Explore key trends, regional breakdowns, and leading companies shaping this multi-billion dollar sector. Projecting steady growth through 2033, understand the factors driving expansion and the challenges ahead for maize producers and stakeholders.

                                                                        July 2025
                                                                        Base Year: 2024
                                                                        No Of Pages: 180
                                                                        Price: $3800

                                                                        Alfalfa Hay Market in Italy Future-proof Strategies: Trends, Competitor Dynamics, and Opportunities 2025-2033

                                                                        Discover the latest insights into Italy's thriving alfalfa hay market. Explore market size, CAGR, key drivers, trends, and competitive landscape analysis for 2025-2033. Learn about segment growth in bales, pellets, and cubes across animal feed applications.

                                                                        July 2025
                                                                        Base Year: 2024
                                                                        No Of Pages: 150
                                                                        Price: $3800

                                                                        India Biopesticides Industry Market Disruption: Competitor Insights and Trends 2025-2033

                                                                        The India biopesticides market is booming, projected to reach ₹237.3 Billion (USD 2847.6 million) by 2033, driven by growing demand for sustainable agriculture and stricter regulations. Learn about key market trends, leading companies, and regional growth forecasts in this comprehensive analysis.

                                                                        July 2025
                                                                        Base Year: 2024
                                                                        No Of Pages: 197
                                                                        Price: $3800

                                                                        Decoding Almond Market Consumer Preferences 2025-2033

                                                                        Discover the booming almond market! Explore its $10.12B valuation (2025), 5.55% CAGR, key drivers, trends, and regional insights. Learn about leading companies and diverse product types including almond butter, flour, and oil. Uncover future growth projections for the almond industry until 2033.

                                                                        July 2025
                                                                        Base Year: 2024
                                                                        No Of Pages: 234
                                                                        Price: $4750

                                                                        Bio Organic Fertilizer Market Insightful Market Analysis: Trends and Opportunities 2025-2033

                                                                        The global bio organic fertilizer market is booming, projected to reach [estimated 2033 value] by 2033 with a CAGR of 5.90%. Discover key market trends, drivers, restraints, and leading companies shaping this sustainable agriculture sector. Learn more about organic fertilizer types, applications, and regional market analysis.

                                                                        July 2025
                                                                        Base Year: 2024
                                                                        No Of Pages: 150
                                                                        Price: $4750

                                                                        Exploring Saudi Arabia Agriculture Market’s Market Size Dynamics 2025-2033

                                                                        Discover the booming Saudi Arabia agriculture market! Projected to reach \$28.3 billion by 2033 with a 5.2% CAGR, this report analyzes market size, key players (Carrefour, Lulu Group), regional trends, and growth drivers. Learn about opportunities and challenges in this dynamic sector.

                                                                        July 2025
                                                                        Base Year: 2024
                                                                        No Of Pages: 197
                                                                        Price: $3800

                                                                        Lentil Industry Charting Growth Trajectories 2025-2033: Strategic Insights and Forecasts

                                                                        Discover the booming lentil market! Explore key trends, regional insights, and leading companies driving growth in this $X billion industry (2025 estimate) projected to reach $X billion by 2033. Learn about the rising demand for whole, split, and dehulled lentils in dry, canned, and frozen forms. Get the complete market analysis now!

                                                                        July 2025
                                                                        Base Year: 2024
                                                                        No Of Pages: 234
                                                                        Price: $4750

                                                                        USA Agricultural Irrigation Machinery Market Soars to XXX Million, witnessing a CAGR of XX during the forecast period 2025-2033

                                                                        Discover the booming US agricultural irrigation machinery market! This in-depth analysis reveals key trends, growth drivers, and leading companies from 2025-2033. Learn about the impact of precision agriculture, water scarcity, and government initiatives on the market's future. Explore segments like drip, sprinkler, and pivot irrigation systems.

                                                                        July 2025
                                                                        Base Year: 2024
                                                                        No Of Pages: 150
                                                                        Price: $3800

                                                                        South America Biological Organic Fertilizers Industry 2025 to Grow at XX CAGR with XXX Million Market Size: Analysis and Forecasts 2033

                                                                        Discover the booming South American biological organic fertilizer market! Projected to reach [estimated 2033 value based on CAGR] by 2033, this market is driven by sustainable agriculture trends and growing demand for eco-friendly farming. Learn about key players, market segments (cereals, legumes, fruits & vegetables), and growth opportunities in Brazil, Argentina, and beyond.

                                                                        July 2025
                                                                        Base Year: 2024
                                                                        No Of Pages: 150
                                                                        Price: $4750

                                                                        Exploring Barriers in North American Olives Market Market: Trends and Analysis 2025-2033

                                                                        Discover the booming North American olives market! This comprehensive analysis reveals a $6.9B market with a 5.74% CAGR (2025-2033), driven by health trends & Mediterranean diet popularity. Explore market segmentation, key players (Napa Valley Olive Oil, Musco Family Olive Co., etc.), and future growth projections for olive oil, table olives, and more.

                                                                        July 2025
                                                                        Base Year: 2024
                                                                        No Of Pages: 180
                                                                        Price: $4750

                                                                        Analyzing Competitor Moves: Iran Agricultural Sector Analysis Growth Outlook 2025-2033

                                                                        Discover the growth opportunities and challenges within Iran's agricultural sector. This comprehensive analysis covers market size, CAGR, key drivers, trends, and regional variations across food crops, cash crops, fruits, vegetables, dairy, and fishery from 2019-2033. Gain valuable insights into this dynamic market.

                                                                        July 2025
                                                                        Base Year: 2024
                                                                        No Of Pages: 150
                                                                        Price: $3800

                                                                        South America Agricultual Films Market Market’s Drivers and Challenges: Strategic Overview 2025-2033

                                                                        Discover the booming South American agricultural films market! This in-depth analysis reveals a CAGR of 6.10% to 2033, driven by growing demand for modern farming techniques and food security. Explore key trends, leading companies (Dow, Agroflex, etc.), and regional insights for Brazil, Argentina, and beyond. Learn how this expanding market presents lucrative opportunities.

                                                                        July 2025
                                                                        Base Year: 2024
                                                                        No Of Pages: 150
                                                                        Price: $4750

                                                                        Analyzing Coffee Trade Analysis Industry: Opportunities and Growth Patterns 2025-2033

                                                                        Discover the latest insights into the booming global coffee trade market. This comprehensive analysis reveals key trends, growth drivers, and market segmentation for Arabica, Robusta, and various coffee processing methods. Explore regional market shares and leading companies like Starbucks & Nestlé. Project your business strategy with our 2025-2033 forecast.

                                                                        July 2025
                                                                        Base Year: 2024
                                                                        No Of Pages: 150
                                                                        Price: $4750

                                                                        Kiwi Fruit Market Insightful Market Analysis: Trends and Opportunities 2025-2033

                                                                        Discover the booming kiwi fruit market! This comprehensive analysis reveals a $1.89B market in 2025, projected to reach significant heights by 2033 with a 5.02% CAGR. Explore key drivers, regional trends, and leading companies shaping this dynamic industry.

                                                                        July 2025
                                                                        Base Year: 2024
                                                                        No Of Pages: 180
                                                                        Price: $4750

                                                                        Africa Chia Seeds Industry: Growth Opportunities and Competitive Landscape Overview 2025-2033

                                                                        Discover the booming Africa chia seeds market! Explore its $13.87M valuation (2025), 2.10% CAGR, key segments (organic, food & beverage, supplements), and leading companies. Learn about growth drivers, trends, and regional insights (South Africa, UAE) in this comprehensive market analysis.

                                                                        July 2025
                                                                        Base Year: 2024
                                                                        No Of Pages: 180
                                                                        Price: $4750

                                                                        China Pesticide Industry Market Report: Strategic Insights

                                                                        Discover the booming China pesticide market, projected to reach $XX million by 2025 and grow at a CAGR of 6.60% until 2033. Analyze key trends, leading companies (Bayer, Syngenta, UPL), and market segmentation (fungicides, herbicides, insecticides, etc.) impacting this dynamic sector.

                                                                        July 2025
                                                                        Base Year: 2024
                                                                        No Of Pages: 197
                                                                        Price: $3800

                                                                        Global Metal Chelates Market Future-proof Strategies: Trends, Competitor Dynamics, and Opportunities 2025-2033

                                                                        Discover the booming global metal chelates market! This comprehensive analysis reveals a CAGR of 10.20%, driven by surging demand for efficient micronutrient delivery in agriculture. Explore market size, segmentation (crop type, product type, application), key players, and regional trends for 2025-2033.

                                                                        July 2025
                                                                        Base Year: 2024
                                                                        No Of Pages: 197
                                                                        Price: $3800

                                                                        Fresh Cherries Industry CAGR Trends: Growth Outlook 2025-2033

                                                                        Discover the booming fresh cherries market! This in-depth analysis reveals key trends, drivers, and restraints, along with regional market share data and projections to 2033. Learn about leading companies and explore growth opportunities in this lucrative sector.

                                                                        July 2025
                                                                        Base Year: 2024
                                                                        No Of Pages: 180
                                                                        Price: $4750

                                                                        Business Address

                                                                        Head Office

                                                                        Office no. A 5010, fifth floor, Solitaire Business Hub, Near Phoenix mall, Pune, Maharashtra 411014

                                                                        Contact Information

                                                                        Craig Francis

                                                                        Business Development Head

                                                                        +17162654855

                                                                        [email protected]

                                                                        Connect With Us

                                                                        Secure Payment Partners

                                                                        payment image
                                                                        RetailLogisticsPackagingAutomotiveHealthcareAgricultureEnergy & PowerFood & BeverageAerospace & DefenseChemicals & MaterialsHospitality and TourismAnimal Nutrition & WellnessConsumer Goods and ServicesReal Estate and ConstructionHome and Property ImprovementTechnology, Media and TelecomManufacturing Products and ServicesFinancial Services and Investment Intelligence

                                                                        © 2025 All rights reserved


                                                                        Privacy Policy
                                                                        Terms and Conditions
                                                                        FAQ
                                                                        • Home
                                                                        • About Us
                                                                        • Industries
                                                                          • Aerospace & Defense
                                                                          • Agriculture
                                                                          • Animal Nutrition & Wellness
                                                                          • Automotive
                                                                          • Chemicals & Materials
                                                                          • Consumer Goods and Services
                                                                          • Energy & Power
                                                                          • Financial Services and Investment Intelligence
                                                                          • Food & Beverage
                                                                          • Home and Property Improvement
                                                                          • Hospitality and Tourism
                                                                          • Logistics
                                                                          • Manufacturing Products and Services
                                                                          • Packaging
                                                                          • Professional and Commercial Services
                                                                          • Real Estate and Construction
                                                                          • Retail
                                                                          • Technology, Media and Telecom
                                                                          • Healthcare
                                                                        • Services
                                                                        • Contact
                                                                        Main Logo
                                                                        • Home
                                                                        • About Us
                                                                        • Industries
                                                                          • Aerospace & Defense
                                                                          • Agriculture
                                                                          • Animal Nutrition & Wellness
                                                                          • Automotive
                                                                          • Chemicals & Materials
                                                                          • Consumer Goods and Services
                                                                          • Energy & Power
                                                                          • Financial Services and Investment Intelligence
                                                                          • Food & Beverage
                                                                          • Home and Property Improvement
                                                                          • Hospitality and Tourism
                                                                          • Logistics
                                                                          • Manufacturing Products and Services
                                                                          • Packaging
                                                                          • Professional and Commercial Services
                                                                          • Real Estate and Construction
                                                                          • Retail
                                                                          • Technology, Media and Telecom
                                                                          • Healthcare
                                                                        • Services
                                                                        • Contact
                                                                        +17162654855
                                                                        [email protected]

                                                                        +17162654855

                                                                        [email protected]