


Key Insights
The Crime Risk Report market is experiencing significant expansion, fueled by heightened regulatory oversight, the escalating incidence of financial crimes, and the widespread adoption of advanced analytics and AI in risk management. Projected to reach $12.8 billion by 2033, the market is anticipated to grow at a Compound Annual Growth Rate (CAGR) of 20.6% from the base year 2025 through 2033. Key growth drivers include the increasing need for robust Know Your Customer (KYC) and Anti-Money Laundering (AML) compliance, growing concerns regarding fraud and money laundering, and the evolving sophistication of cyber threats. The financial services sector, encompassing banking and insurance, represents a substantial market share, followed by real estate and other applications. Cloud-based deployment models are gaining prominence due to their scalability, cost-effectiveness, and accessibility. However, challenges such as data privacy concerns, high implementation costs for advanced technologies, and a shortage of skilled professionals may temper market expansion.
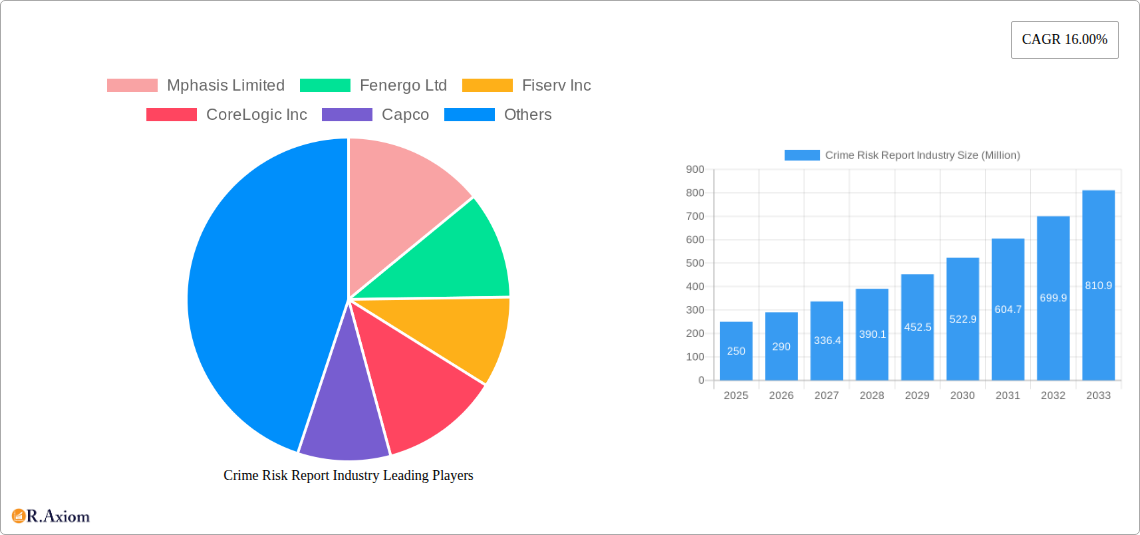
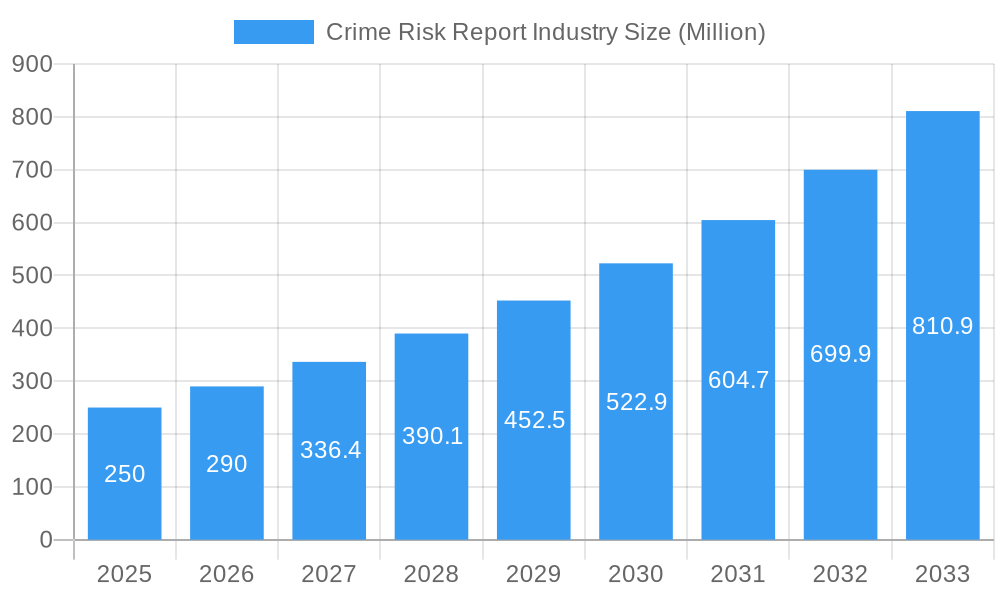
Crime Risk Report Industry Market Size (In Billion)

The competitive landscape is dynamic, with established entities such as Mphasis, Fenergo, Fiserv, and IBM competing alongside specialized fintech firms. Geographic expansion is also a key driver, with North America and Europe currently leading the market, while the Asia-Pacific region shows considerable growth potential.
Crime Risk Report Industry Company Market Share
Future industry developments will be characterized by continuous innovation, including the integration of big data analytics for enhanced risk assessment, the development of AI-powered fraud detection systems, and the increased utilization of blockchain technology for improved data security and transparency. The focus will likely shift towards predictive analytics and real-time risk monitoring, enabling organizations to proactively mitigate potential threats. Evolving regulatory changes and compliance standards will continue to drive demand for sophisticated crime risk report solutions. The market's fragmentation presents opportunities for both established players and emerging companies to capture market share through specialized solutions or niche application focus. The consistent demand for effective risk management and enhanced regulatory compliance across all sectors ensures sustained market growth.
This comprehensive report offers an in-depth analysis of the Crime Risk Report industry, providing critical insights for stakeholders, investors, and businesses within this dynamic sector. The study period spans from 2019 to 2033, with 2025 as the base year and a forecast period from 2025 to 2033. Leveraging extensive market research and data analysis, the report presents a clear overview of current market dynamics and future growth projections, including a detailed assessment of key players and emerging trends. The total market size is estimated at $12.8 billion in 2025.
Crime Risk Report Industry Market Concentration & Innovation
The Crime Risk Report industry exhibits a moderately concentrated market structure, with a few major players holding significant market share. In 2025, the top five companies – Mphasis Limited, Fiserv Inc, CoreLogic Inc, IBM Corp, and Oracle Corporation – are estimated to collectively control approximately xx% of the market. Market concentration is influenced by factors such as technological advancements, regulatory compliance, and the high capital expenditure needed for development and maintenance of robust risk assessment platforms.
Innovation within the industry is driven by the need for more sophisticated risk assessment tools capable of handling ever-increasing data volumes and identifying increasingly complex crime patterns. The integration of AI, machine learning, and big data analytics is revolutionizing crime risk assessment, leading to more accurate predictions and proactive mitigation strategies. Regulatory frameworks, particularly those focused on KYC/AML compliance, are significant drivers of innovation, pushing companies to develop more robust and efficient solutions. Product substitutes are limited; however, internal risk management departments may partially substitute specialized crime risk report services in some sectors. Mergers and acquisitions (M&A) activity has been significant, with deal values exceeding $xx Million in the last five years. Several key M&A deals have resulted in enhanced product portfolios and market reach for acquiring companies.
- Top 5 Companies Market Share (2025): xx%
- M&A Deal Value (2020-2024): $xx Million
- Key Innovation Drivers: AI, Machine Learning, Big Data Analytics, Regulatory Compliance
Crime Risk Report Industry Industry Trends & Insights
The Crime Risk Report industry is experiencing robust growth, driven by escalating concerns over financial crimes, increasing regulatory scrutiny, and the growing adoption of advanced analytical techniques. The Compound Annual Growth Rate (CAGR) for the period 2025-2033 is projected to be xx%, indicating a significant expansion of the market. This growth is fueled by rising digitalization, leading to a surge in cybercrimes, and the need for proactive risk management measures. Consumer preferences are shifting towards cloud-based solutions due to their scalability, cost-effectiveness, and ease of access. Competitive dynamics are intense, with companies focusing on product differentiation, strategic partnerships, and technological innovation to gain market share. Market penetration of advanced analytical tools is increasing steadily, with adoption rates expected to reach xx% by 2033. The increasing integration of blockchain technology promises to further enhance security and transparency in the crime risk management ecosystem.
Dominant Markets & Segments in Crime Risk Report Industry
The Banking segment currently dominates the Crime Risk Report market, accounting for approximately xx% of the total market revenue in 2025. This dominance is attributed to stringent regulatory requirements in the banking sector, the high volume of financial transactions, and the considerable financial losses associated with crime. The Cloud deployment segment is also experiencing significant growth, driven by the benefits of scalability, flexibility, and reduced infrastructure costs. North America is the leading geographical market, owing to robust financial infrastructure, stringent regulations, and a high concentration of financial institutions.
- Dominant Application Segment (2025): Banking (xx%)
- Dominant Deployment Segment (2025): Cloud (xx%)
- Leading Geographical Market: North America
- Key Drivers for Banking Segment: Stringent Regulations, High Transaction Volumes, Financial Loss Prevention
- Key Drivers for Cloud Deployment: Scalability, Cost-Effectiveness, Ease of Access
- Key Drivers for North America: Robust Financial Infrastructure, Stringent Regulations, High Concentration of Financial Institutions
Crime Risk Report Industry Product Developments
Recent product developments focus on integrating advanced analytics, AI, and machine learning to enhance the accuracy and efficiency of crime risk assessments. New products offer real-time risk scoring, predictive analytics, and automated reporting functionalities, improving compliance and reducing operational costs. These advancements enable quicker identification of suspicious activities, reducing fraud and enhancing overall security. The market is seeing a shift toward more user-friendly interfaces and comprehensive dashboards, making the information readily accessible to a wider range of users.
Report Scope & Segmentation Analysis
This report segments the Crime Risk Report market based on application (Banking, Insurance, Real Estate, Other Applications) and deployment (On-Premise, Cloud). The Banking segment is expected to witness the highest CAGR during the forecast period due to stringent regulatory compliance requirements and higher financial crime risks. The Insurance segment is also growing significantly, driven by increasing fraud cases and the need for improved risk assessment. The Cloud deployment model is expected to show robust growth due to its flexibility and cost-effectiveness compared to on-premise solutions. Competitive dynamics vary across segments, with specialized players focusing on niche applications while large vendors offer comprehensive solutions across multiple segments.
Key Drivers of Crime Risk Report Industry Growth
The growth of the Crime Risk Report industry is propelled by several key factors: increasingly sophisticated financial crimes, stricter regulatory compliance mandates (e.g., KYC/AML), the rising adoption of digital technologies and the associated cybersecurity risks, and the growing need for proactive risk management strategies among organizations. The advancements in AI and machine learning are further contributing to the sophistication and efficiency of crime risk assessment tools, driving industry expansion.
Challenges in the Crime Risk Report Industry Sector
The industry faces challenges including the high cost of implementing and maintaining advanced analytical tools, the complexity of integrating diverse data sources, the evolving nature of financial crimes, and the need to stay abreast of ever-changing regulatory requirements. Data privacy concerns and the risk of false positives also pose significant challenges. These hurdles can impede the adoption of innovative solutions and limit market expansion, although the overall market trend remains positive.
Emerging Opportunities in Crime Risk Report Industry
Emerging opportunities lie in the integration of blockchain technology for enhanced security and transparency, the expansion into new geographic markets, and the development of specialized solutions for niche industries. The increasing demand for real-time risk assessments and predictive analytics will drive further innovation. The growing awareness of cybersecurity risks in the digital age will also create further opportunities for vendors offering enhanced security solutions.
Leading Players in the Crime Risk Report Industry Market
- Mphasis Limited
- Fenergo Ltd
- Fiserv Inc
- CoreLogic Inc
- Capco
- Refinitiv US Holdings Inc
- RiskScreen (KYC Global Technologies)
- IBM Corp
- NICE Ltd
- Oracle Corporation
- ACI Worldwide Inc
Key Developments in Crime Risk Report Industry Industry
- 2023 Q4: Fiserv Inc launched a new AI-powered fraud detection solution.
- 2022 Q3: Mphasis Limited acquired a specialized cybersecurity firm to enhance its risk assessment capabilities.
- 2021 Q2: CoreLogic Inc partnered with a leading data analytics provider to improve data integration capabilities. (Further key developments can be added here)
Strategic Outlook for Crime Risk Report Industry Market
The Crime Risk Report industry is poised for continued growth, driven by technological advancements, increasing regulatory scrutiny, and the ever-evolving landscape of financial crime. The market is expected to witness the adoption of more sophisticated analytical tools, the integration of new technologies (like blockchain), and the expansion into new geographical markets and industry verticals. This positive outlook presents significant opportunities for both established players and new entrants to participate in this expanding and critical sector.
Crime Risk Report Industry Segmentation
-
1. Deployment
- 1.1. On-Premise
- 1.2. Cloud
-
2. Application
- 2.1. Banking
- 2.2. Insurance
- 2.3. Real Estate
- 2.4. Other Applications
Crime Risk Report Industry Segmentation By Geography
-
1. North America
- 1.1. United States
- 1.2. Canada
-
2. Europe
- 2.1. Germany
- 2.2. United Kingdom
- 2.3. Rest of Europe
-
3. Asia Pacific
- 3.1. China
- 3.2. Japan
- 3.3. India
- 3.4. Rest of Asia Pacific
-
4. Rest of the World
- 4.1. Latin America
- 4.2. Middle East
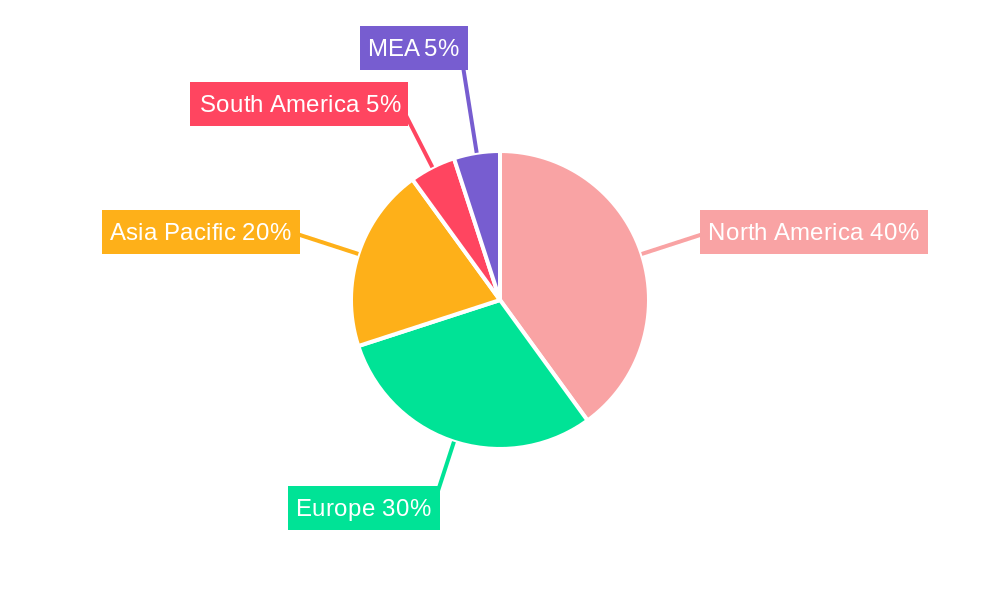
Crime Risk Report Industry Regional Market Share
Geographic Coverage of Crime Risk Report Industry
Crime Risk Report Industry REPORT HIGHLIGHTS
| Aspects | Details |
|---|---|
| Study Period | 2020-2034 |
| Base Year | 2025 |
| Estimated Year | 2026 |
| Forecast Period | 2026-2034 |
| Historical Period | 2020-2025 |
| Growth Rate | CAGR of 20.6% from 2020-2034 |
| Segmentation |
|
Table of Contents
- 1. Introduction
- 1.1. Research Scope
- 1.2. Market Segmentation
- 1.3. Research Methodology
- 1.4. Definitions and Assumptions
- 2. Executive Summary
- 2.1. Introduction
- 3. Market Dynamics
- 3.1. Introduction
- 3.2. Market Drivers
- 3.2.1. ; Increased Digitalization in Banking Sector; Concern for Data Security and Fraud Detection
- 3.3. Market Restrains
- 3.3.1. ; Sceptical View on Data Privacy
- 3.4. Market Trends
- 3.4.1. Growth in Digitalization and Cloud Adoption is Influencing the Market Demand
- 4. Market Factor Analysis
- 4.1. Porters Five Forces
- 4.2. Supply/Value Chain
- 4.3. PESTEL analysis
- 4.4. Market Entropy
- 4.5. Patent/Trademark Analysis
- 5. Global Crime Risk Report Industry Analysis, Insights and Forecast, 2020-2032
- 5.1. Market Analysis, Insights and Forecast - by Deployment
- 5.1.1. On-Premise
- 5.1.2. Cloud
- 5.2. Market Analysis, Insights and Forecast - by Application
- 5.2.1. Banking
- 5.2.2. Insurance
- 5.2.3. Real Estate
- 5.2.4. Other Applications
- 5.3. Market Analysis, Insights and Forecast - by Region
- 5.3.1. North America
- 5.3.2. Europe
- 5.3.3. Asia Pacific
- 5.3.4. Rest of the World
- 5.1. Market Analysis, Insights and Forecast - by Deployment
- 6. North America Crime Risk Report Industry Analysis, Insights and Forecast, 2020-2032
- 6.1. Market Analysis, Insights and Forecast - by Deployment
- 6.1.1. On-Premise
- 6.1.2. Cloud
- 6.2. Market Analysis, Insights and Forecast - by Application
- 6.2.1. Banking
- 6.2.2. Insurance
- 6.2.3. Real Estate
- 6.2.4. Other Applications
- 6.1. Market Analysis, Insights and Forecast - by Deployment
- 7. Europe Crime Risk Report Industry Analysis, Insights and Forecast, 2020-2032
- 7.1. Market Analysis, Insights and Forecast - by Deployment
- 7.1.1. On-Premise
- 7.1.2. Cloud
- 7.2. Market Analysis, Insights and Forecast - by Application
- 7.2.1. Banking
- 7.2.2. Insurance
- 7.2.3. Real Estate
- 7.2.4. Other Applications
- 7.1. Market Analysis, Insights and Forecast - by Deployment
- 8. Asia Pacific Crime Risk Report Industry Analysis, Insights and Forecast, 2020-2032
- 8.1. Market Analysis, Insights and Forecast - by Deployment
- 8.1.1. On-Premise
- 8.1.2. Cloud
- 8.2. Market Analysis, Insights and Forecast - by Application
- 8.2.1. Banking
- 8.2.2. Insurance
- 8.2.3. Real Estate
- 8.2.4. Other Applications
- 8.1. Market Analysis, Insights and Forecast - by Deployment
- 9. Rest of the World Crime Risk Report Industry Analysis, Insights and Forecast, 2020-2032
- 9.1. Market Analysis, Insights and Forecast - by Deployment
- 9.1.1. On-Premise
- 9.1.2. Cloud
- 9.2. Market Analysis, Insights and Forecast - by Application
- 9.2.1. Banking
- 9.2.2. Insurance
- 9.2.3. Real Estate
- 9.2.4. Other Applications
- 9.1. Market Analysis, Insights and Forecast - by Deployment
- 10. Competitive Analysis
- 10.1. Global Market Share Analysis 2025
- 10.2. Company Profiles
- 10.2.1 Mphasis Limited
- 10.2.1.1. Overview
- 10.2.1.2. Products
- 10.2.1.3. SWOT Analysis
- 10.2.1.4. Recent Developments
- 10.2.1.5. Financials (Based on Availability)
- 10.2.2 Fenergo Ltd
- 10.2.2.1. Overview
- 10.2.2.2. Products
- 10.2.2.3. SWOT Analysis
- 10.2.2.4. Recent Developments
- 10.2.2.5. Financials (Based on Availability)
- 10.2.3 Fiserv Inc
- 10.2.3.1. Overview
- 10.2.3.2. Products
- 10.2.3.3. SWOT Analysis
- 10.2.3.4. Recent Developments
- 10.2.3.5. Financials (Based on Availability)
- 10.2.4 CoreLogic Inc
- 10.2.4.1. Overview
- 10.2.4.2. Products
- 10.2.4.3. SWOT Analysis
- 10.2.4.4. Recent Developments
- 10.2.4.5. Financials (Based on Availability)
- 10.2.5 Capco
- 10.2.5.1. Overview
- 10.2.5.2. Products
- 10.2.5.3. SWOT Analysis
- 10.2.5.4. Recent Developments
- 10.2.5.5. Financials (Based on Availability)
- 10.2.6 Refinitiv US Holdings Inc
- 10.2.6.1. Overview
- 10.2.6.2. Products
- 10.2.6.3. SWOT Analysis
- 10.2.6.4. Recent Developments
- 10.2.6.5. Financials (Based on Availability)
- 10.2.7 RiskScreen (KYC Global Technologies)
- 10.2.7.1. Overview
- 10.2.7.2. Products
- 10.2.7.3. SWOT Analysis
- 10.2.7.4. Recent Developments
- 10.2.7.5. Financials (Based on Availability)
- 10.2.8 IBM Corp
- 10.2.8.1. Overview
- 10.2.8.2. Products
- 10.2.8.3. SWOT Analysis
- 10.2.8.4. Recent Developments
- 10.2.8.5. Financials (Based on Availability)
- 10.2.9 NICE Ltd
- 10.2.9.1. Overview
- 10.2.9.2. Products
- 10.2.9.3. SWOT Analysis
- 10.2.9.4. Recent Developments
- 10.2.9.5. Financials (Based on Availability)
- 10.2.10 Oracle Corporation
- 10.2.10.1. Overview
- 10.2.10.2. Products
- 10.2.10.3. SWOT Analysis
- 10.2.10.4. Recent Developments
- 10.2.10.5. Financials (Based on Availability)
- 10.2.11 ACI Worldwide Inc
- 10.2.11.1. Overview
- 10.2.11.2. Products
- 10.2.11.3. SWOT Analysis
- 10.2.11.4. Recent Developments
- 10.2.11.5. Financials (Based on Availability)
- 10.2.1 Mphasis Limited
List of Figures
- Figure 1: Global Crime Risk Report Industry Revenue Breakdown (billion, %) by Region 2025 & 2033
- Figure 2: Global Crime Risk Report Industry Volume Breakdown (K Unit, %) by Region 2025 & 2033
- Figure 3: North America Crime Risk Report Industry Revenue (billion), by Deployment 2025 & 2033
- Figure 4: North America Crime Risk Report Industry Volume (K Unit), by Deployment 2025 & 2033
- Figure 5: North America Crime Risk Report Industry Revenue Share (%), by Deployment 2025 & 2033
- Figure 6: North America Crime Risk Report Industry Volume Share (%), by Deployment 2025 & 2033
- Figure 7: North America Crime Risk Report Industry Revenue (billion), by Application 2025 & 2033
- Figure 8: North America Crime Risk Report Industry Volume (K Unit), by Application 2025 & 2033
- Figure 9: North America Crime Risk Report Industry Revenue Share (%), by Application 2025 & 2033
- Figure 10: North America Crime Risk Report Industry Volume Share (%), by Application 2025 & 2033
- Figure 11: North America Crime Risk Report Industry Revenue (billion), by Country 2025 & 2033
- Figure 12: North America Crime Risk Report Industry Volume (K Unit), by Country 2025 & 2033
- Figure 13: North America Crime Risk Report Industry Revenue Share (%), by Country 2025 & 2033
- Figure 14: North America Crime Risk Report Industry Volume Share (%), by Country 2025 & 2033
- Figure 15: Europe Crime Risk Report Industry Revenue (billion), by Deployment 2025 & 2033
- Figure 16: Europe Crime Risk Report Industry Volume (K Unit), by Deployment 2025 & 2033
- Figure 17: Europe Crime Risk Report Industry Revenue Share (%), by Deployment 2025 & 2033
- Figure 18: Europe Crime Risk Report Industry Volume Share (%), by Deployment 2025 & 2033
- Figure 19: Europe Crime Risk Report Industry Revenue (billion), by Application 2025 & 2033
- Figure 20: Europe Crime Risk Report Industry Volume (K Unit), by Application 2025 & 2033
- Figure 21: Europe Crime Risk Report Industry Revenue Share (%), by Application 2025 & 2033
- Figure 22: Europe Crime Risk Report Industry Volume Share (%), by Application 2025 & 2033
- Figure 23: Europe Crime Risk Report Industry Revenue (billion), by Country 2025 & 2033
- Figure 24: Europe Crime Risk Report Industry Volume (K Unit), by Country 2025 & 2033
- Figure 25: Europe Crime Risk Report Industry Revenue Share (%), by Country 2025 & 2033
- Figure 26: Europe Crime Risk Report Industry Volume Share (%), by Country 2025 & 2033
- Figure 27: Asia Pacific Crime Risk Report Industry Revenue (billion), by Deployment 2025 & 2033
- Figure 28: Asia Pacific Crime Risk Report Industry Volume (K Unit), by Deployment 2025 & 2033
- Figure 29: Asia Pacific Crime Risk Report Industry Revenue Share (%), by Deployment 2025 & 2033
- Figure 30: Asia Pacific Crime Risk Report Industry Volume Share (%), by Deployment 2025 & 2033
- Figure 31: Asia Pacific Crime Risk Report Industry Revenue (billion), by Application 2025 & 2033
- Figure 32: Asia Pacific Crime Risk Report Industry Volume (K Unit), by Application 2025 & 2033
- Figure 33: Asia Pacific Crime Risk Report Industry Revenue Share (%), by Application 2025 & 2033
- Figure 34: Asia Pacific Crime Risk Report Industry Volume Share (%), by Application 2025 & 2033
- Figure 35: Asia Pacific Crime Risk Report Industry Revenue (billion), by Country 2025 & 2033
- Figure 36: Asia Pacific Crime Risk Report Industry Volume (K Unit), by Country 2025 & 2033
- Figure 37: Asia Pacific Crime Risk Report Industry Revenue Share (%), by Country 2025 & 2033
- Figure 38: Asia Pacific Crime Risk Report Industry Volume Share (%), by Country 2025 & 2033
- Figure 39: Rest of the World Crime Risk Report Industry Revenue (billion), by Deployment 2025 & 2033
- Figure 40: Rest of the World Crime Risk Report Industry Volume (K Unit), by Deployment 2025 & 2033
- Figure 41: Rest of the World Crime Risk Report Industry Revenue Share (%), by Deployment 2025 & 2033
- Figure 42: Rest of the World Crime Risk Report Industry Volume Share (%), by Deployment 2025 & 2033
- Figure 43: Rest of the World Crime Risk Report Industry Revenue (billion), by Application 2025 & 2033
- Figure 44: Rest of the World Crime Risk Report Industry Volume (K Unit), by Application 2025 & 2033
- Figure 45: Rest of the World Crime Risk Report Industry Revenue Share (%), by Application 2025 & 2033
- Figure 46: Rest of the World Crime Risk Report Industry Volume Share (%), by Application 2025 & 2033
- Figure 47: Rest of the World Crime Risk Report Industry Revenue (billion), by Country 2025 & 2033
- Figure 48: Rest of the World Crime Risk Report Industry Volume (K Unit), by Country 2025 & 2033
- Figure 49: Rest of the World Crime Risk Report Industry Revenue Share (%), by Country 2025 & 2033
- Figure 50: Rest of the World Crime Risk Report Industry Volume Share (%), by Country 2025 & 2033
List of Tables
- Table 1: Global Crime Risk Report Industry Revenue billion Forecast, by Deployment 2020 & 2033
- Table 2: Global Crime Risk Report Industry Volume K Unit Forecast, by Deployment 2020 & 2033
- Table 3: Global Crime Risk Report Industry Revenue billion Forecast, by Application 2020 & 2033
- Table 4: Global Crime Risk Report Industry Volume K Unit Forecast, by Application 2020 & 2033
- Table 5: Global Crime Risk Report Industry Revenue billion Forecast, by Region 2020 & 2033
- Table 6: Global Crime Risk Report Industry Volume K Unit Forecast, by Region 2020 & 2033
- Table 7: Global Crime Risk Report Industry Revenue billion Forecast, by Deployment 2020 & 2033
- Table 8: Global Crime Risk Report Industry Volume K Unit Forecast, by Deployment 2020 & 2033
- Table 9: Global Crime Risk Report Industry Revenue billion Forecast, by Application 2020 & 2033
- Table 10: Global Crime Risk Report Industry Volume K Unit Forecast, by Application 2020 & 2033
- Table 11: Global Crime Risk Report Industry Revenue billion Forecast, by Country 2020 & 2033
- Table 12: Global Crime Risk Report Industry Volume K Unit Forecast, by Country 2020 & 2033
- Table 13: United States Crime Risk Report Industry Revenue (billion) Forecast, by Application 2020 & 2033
- Table 14: United States Crime Risk Report Industry Volume (K Unit) Forecast, by Application 2020 & 2033
- Table 15: Canada Crime Risk Report Industry Revenue (billion) Forecast, by Application 2020 & 2033
- Table 16: Canada Crime Risk Report Industry Volume (K Unit) Forecast, by Application 2020 & 2033
- Table 17: Global Crime Risk Report Industry Revenue billion Forecast, by Deployment 2020 & 2033
- Table 18: Global Crime Risk Report Industry Volume K Unit Forecast, by Deployment 2020 & 2033
- Table 19: Global Crime Risk Report Industry Revenue billion Forecast, by Application 2020 & 2033
- Table 20: Global Crime Risk Report Industry Volume K Unit Forecast, by Application 2020 & 2033
- Table 21: Global Crime Risk Report Industry Revenue billion Forecast, by Country 2020 & 2033
- Table 22: Global Crime Risk Report Industry Volume K Unit Forecast, by Country 2020 & 2033
- Table 23: Germany Crime Risk Report Industry Revenue (billion) Forecast, by Application 2020 & 2033
- Table 24: Germany Crime Risk Report Industry Volume (K Unit) Forecast, by Application 2020 & 2033
- Table 25: United Kingdom Crime Risk Report Industry Revenue (billion) Forecast, by Application 2020 & 2033
- Table 26: United Kingdom Crime Risk Report Industry Volume (K Unit) Forecast, by Application 2020 & 2033
- Table 27: Rest of Europe Crime Risk Report Industry Revenue (billion) Forecast, by Application 2020 & 2033
- Table 28: Rest of Europe Crime Risk Report Industry Volume (K Unit) Forecast, by Application 2020 & 2033
- Table 29: Global Crime Risk Report Industry Revenue billion Forecast, by Deployment 2020 & 2033
- Table 30: Global Crime Risk Report Industry Volume K Unit Forecast, by Deployment 2020 & 2033
- Table 31: Global Crime Risk Report Industry Revenue billion Forecast, by Application 2020 & 2033
- Table 32: Global Crime Risk Report Industry Volume K Unit Forecast, by Application 2020 & 2033
- Table 33: Global Crime Risk Report Industry Revenue billion Forecast, by Country 2020 & 2033
- Table 34: Global Crime Risk Report Industry Volume K Unit Forecast, by Country 2020 & 2033
- Table 35: China Crime Risk Report Industry Revenue (billion) Forecast, by Application 2020 & 2033
- Table 36: China Crime Risk Report Industry Volume (K Unit) Forecast, by Application 2020 & 2033
- Table 37: Japan Crime Risk Report Industry Revenue (billion) Forecast, by Application 2020 & 2033
- Table 38: Japan Crime Risk Report Industry Volume (K Unit) Forecast, by Application 2020 & 2033
- Table 39: India Crime Risk Report Industry Revenue (billion) Forecast, by Application 2020 & 2033
- Table 40: India Crime Risk Report Industry Volume (K Unit) Forecast, by Application 2020 & 2033
- Table 41: Rest of Asia Pacific Crime Risk Report Industry Revenue (billion) Forecast, by Application 2020 & 2033
- Table 42: Rest of Asia Pacific Crime Risk Report Industry Volume (K Unit) Forecast, by Application 2020 & 2033
- Table 43: Global Crime Risk Report Industry Revenue billion Forecast, by Deployment 2020 & 2033
- Table 44: Global Crime Risk Report Industry Volume K Unit Forecast, by Deployment 2020 & 2033
- Table 45: Global Crime Risk Report Industry Revenue billion Forecast, by Application 2020 & 2033
- Table 46: Global Crime Risk Report Industry Volume K Unit Forecast, by Application 2020 & 2033
- Table 47: Global Crime Risk Report Industry Revenue billion Forecast, by Country 2020 & 2033
- Table 48: Global Crime Risk Report Industry Volume K Unit Forecast, by Country 2020 & 2033
- Table 49: Latin America Crime Risk Report Industry Revenue (billion) Forecast, by Application 2020 & 2033
- Table 50: Latin America Crime Risk Report Industry Volume (K Unit) Forecast, by Application 2020 & 2033
- Table 51: Middle East Crime Risk Report Industry Revenue (billion) Forecast, by Application 2020 & 2033
- Table 52: Middle East Crime Risk Report Industry Volume (K Unit) Forecast, by Application 2020 & 2033
Frequently Asked Questions
1. What is the projected Compound Annual Growth Rate (CAGR) of the Crime Risk Report Industry?
The projected CAGR is approximately 20.6%.
2. Which companies are prominent players in the Crime Risk Report Industry?
Key companies in the market include Mphasis Limited, Fenergo Ltd, Fiserv Inc, CoreLogic Inc, Capco, Refinitiv US Holdings Inc, RiskScreen (KYC Global Technologies), IBM Corp, NICE Ltd, Oracle Corporation, ACI Worldwide Inc.
3. What are the main segments of the Crime Risk Report Industry?
The market segments include Deployment, Application.
4. Can you provide details about the market size?
The market size is estimated to be USD 12.8 billion as of 2022.
5. What are some drivers contributing to market growth?
; Increased Digitalization in Banking Sector; Concern for Data Security and Fraud Detection.
6. What are the notable trends driving market growth?
Growth in Digitalization and Cloud Adoption is Influencing the Market Demand.
7. Are there any restraints impacting market growth?
; Sceptical View on Data Privacy.
8. Can you provide examples of recent developments in the market?
N/A
9. What pricing options are available for accessing the report?
Pricing options include single-user, multi-user, and enterprise licenses priced at USD 4750, USD 5250, and USD 8750 respectively.
10. Is the market size provided in terms of value or volume?
The market size is provided in terms of value, measured in billion and volume, measured in K Unit.
11. Are there any specific market keywords associated with the report?
Yes, the market keyword associated with the report is "Crime Risk Report Industry," which aids in identifying and referencing the specific market segment covered.
12. How do I determine which pricing option suits my needs best?
The pricing options vary based on user requirements and access needs. Individual users may opt for single-user licenses, while businesses requiring broader access may choose multi-user or enterprise licenses for cost-effective access to the report.
13. Are there any additional resources or data provided in the Crime Risk Report Industry report?
While the report offers comprehensive insights, it's advisable to review the specific contents or supplementary materials provided to ascertain if additional resources or data are available.
14. How can I stay updated on further developments or reports in the Crime Risk Report Industry?
To stay informed about further developments, trends, and reports in the Crime Risk Report Industry, consider subscribing to industry newsletters, following relevant companies and organizations, or regularly checking reputable industry news sources and publications.
Methodology
Step 1 - Identification of Relevant Samples Size from Population Database


Step 2 - Approaches for Defining Global Market Size (Value, Volume* & Price*)

Note*: In applicable scenarios
Step 3 - Data Sources
Primary Research
- Web Analytics
- Survey Reports
- Research Institute
- Latest Research Reports
- Opinion Leaders
Secondary Research
- Annual Reports
- White Paper
- Latest Press Release
- Industry Association
- Paid Database
- Investor Presentations

Step 4 - Data Triangulation
Involves using different sources of information in order to increase the validity of a study
These sources are likely to be stakeholders in a program - participants, other researchers, program staff, other community members, and so on.
Then we put all data in single framework & apply various statistical tools to find out the dynamic on the market.
During the analysis stage, feedback from the stakeholder groups would be compared to determine areas of agreement as well as areas of divergence