

Key Insights
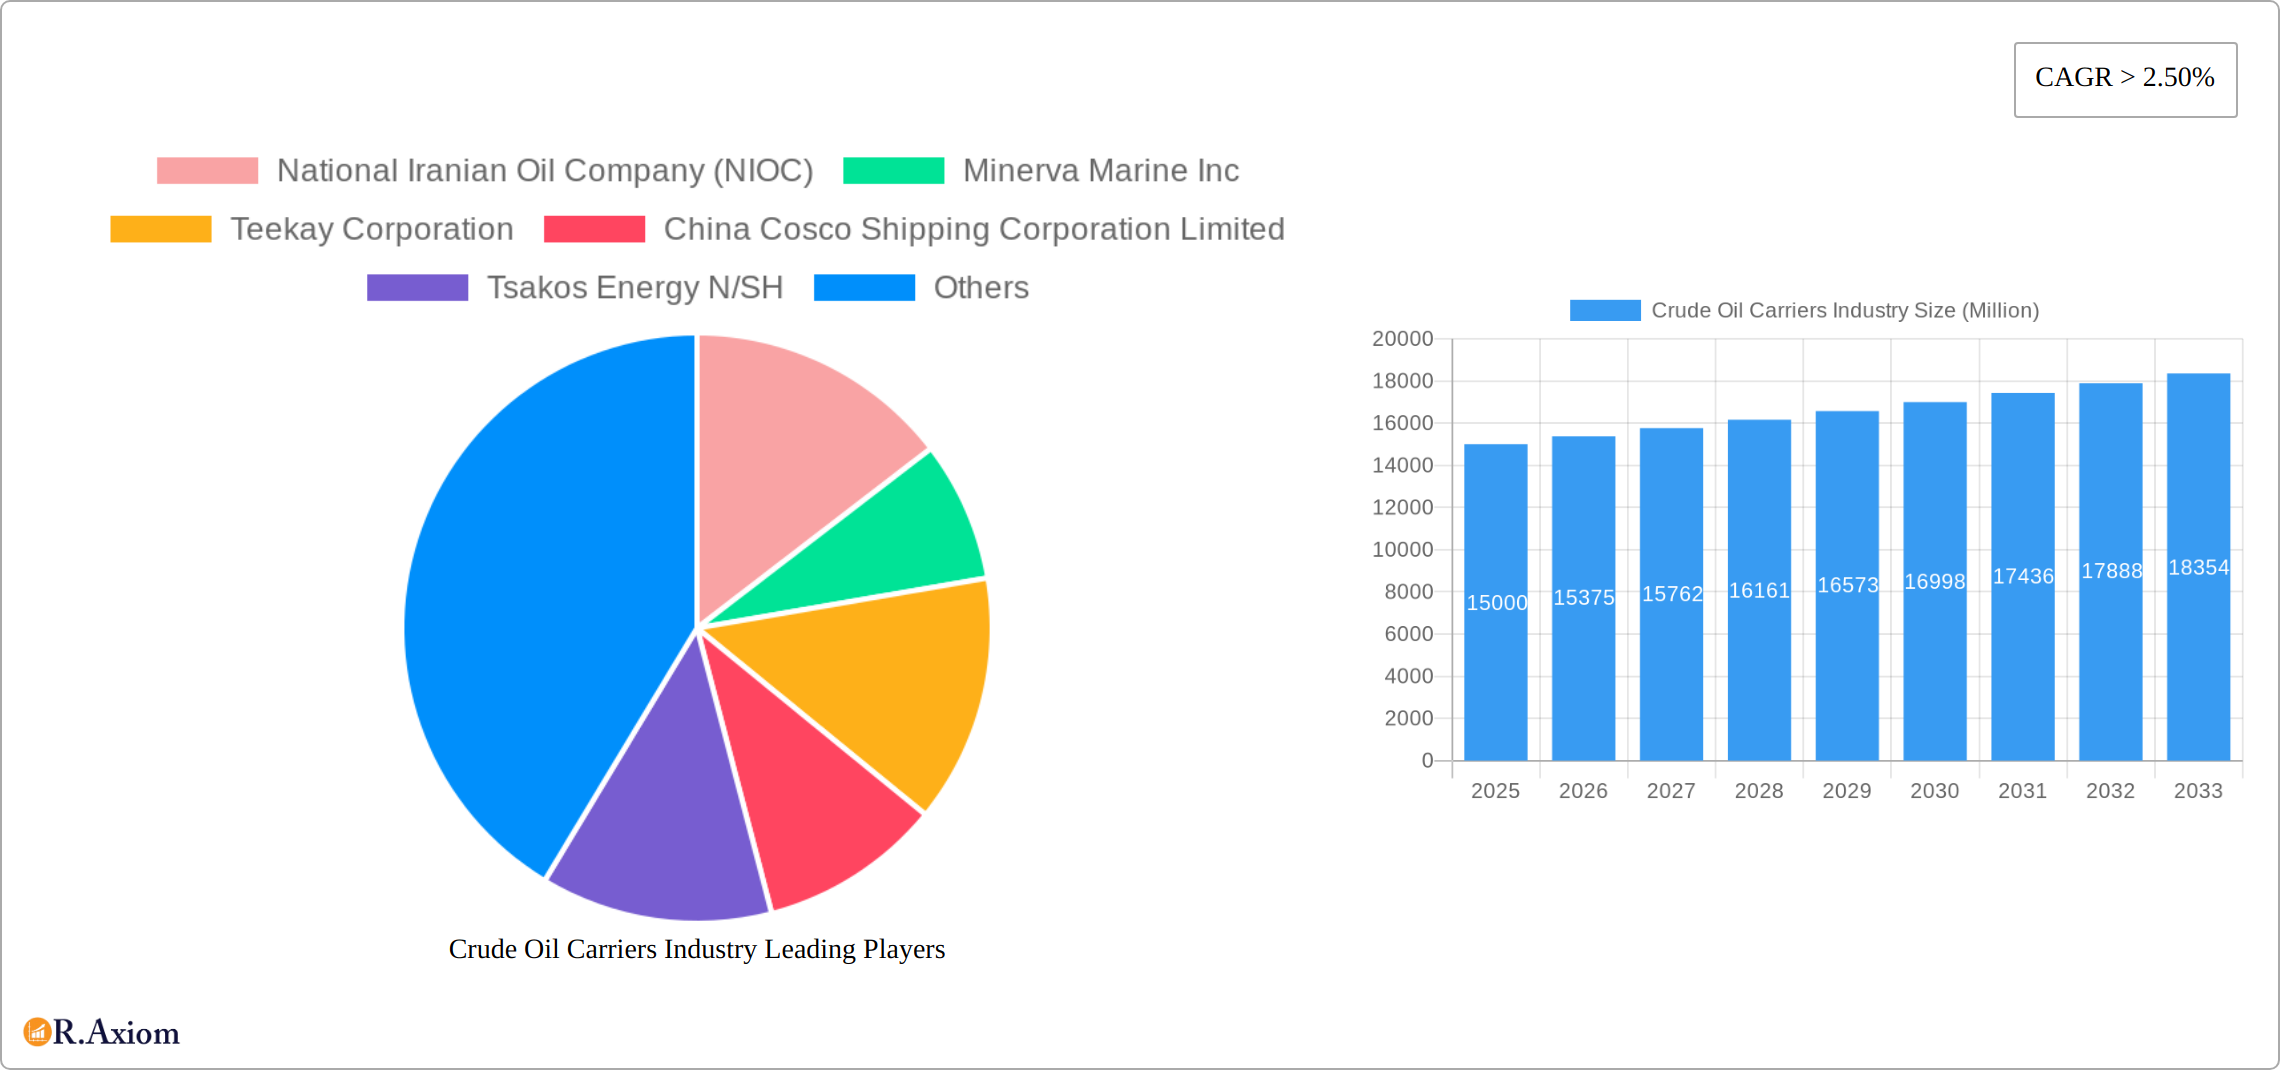
The global crude oil carrier market is projected to reach $225142.8 million by 2033, exhibiting a Compound Annual Growth Rate (CAGR) of 4.6% from the base year 2025. This significant expansion is propelled by escalating global crude oil demand, primarily from developing Asian-Pacific economies, coupled with increased offshore exploration activities. Technological advancements, particularly the adoption of larger vessel classes like Very Large Crude Carriers (VLCCs) and Ultra Large Crude Carriers (ULCCs), are enhancing operational efficiency and cost-effectiveness. However, the industry navigates challenges such as volatile oil prices, geopolitical instability, and stringent environmental regulations necessitating investment in sustainable technologies. VLCCs and ULCCs are anticipated to lead market segments due to their economies of scale. Key industry players including National Iranian Oil Company (NIOC), Teekay Corporation, and COSCO are actively pursuing fleet expansion, strategic collaborations, and technological innovation.
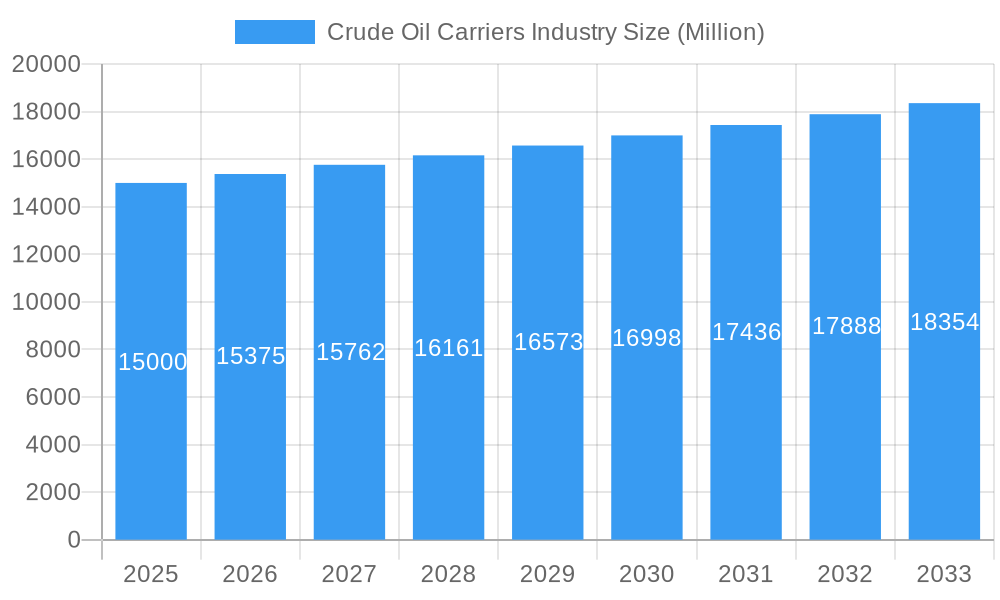
Crude Oil Carriers Industry Market Size (In Billion)
Geographically, the Asia-Pacific region is poised for the most rapid growth, driven by robust energy demand and expanding refining infrastructure, alongside substantial contributions from North America and Europe. Intense market competition necessitates strategic alliances, mergers, and acquisitions to consolidate market positions and optimize operational efficiencies. The forecast period (2025-2033) anticipates sustained growth, contingent on market adaptability and the integration of sustainable practices. While precise regional market share data requires further investigation, current global energy consumption and refining capacities provide a strong basis for estimation.
Crude Oil Carriers Industry Company Market Share
Crude Oil Carriers Industry: A Comprehensive Market Report (2019-2033)
This detailed report provides a comprehensive analysis of the Crude Oil Carriers industry, offering in-depth insights into market dynamics, competitive landscape, and future growth prospects. The study covers the period from 2019 to 2033, with 2025 serving as the base and estimated year. The report leverages extensive primary and secondary research to deliver actionable intelligence for industry stakeholders, investors, and strategic decision-makers.
Crude Oil Carriers Industry Market Concentration & Innovation
This section analyzes the market concentration, innovation drivers, regulatory frameworks, product substitutes, end-user trends, and M&A activities within the crude oil carriers industry. The global market is moderately concentrated, with several key players commanding significant market share. However, the presence of numerous smaller operators contributes to a dynamic competitive landscape.
Market Share: The top five players—National Iranian Oil Company (NIOC), Minerva Marine Inc, Teekay Corporation, China Cosco Shipping Corporation Limited, and Tsakos Energy N/SH—hold an estimated xx% of the global market share in 2025. The remaining share is distributed among numerous smaller companies.
Innovation Drivers: Technological advancements in vessel design (e.g., improved fuel efficiency, reduced emissions), digitalization of operations (e.g., enhanced vessel tracking and management), and the adoption of alternative fuels are key innovation drivers.
Regulatory Framework: Stringent environmental regulations (e.g., IMO 2020) and safety standards significantly impact operational costs and investment strategies. Compliance requirements drive innovation in fuel efficiency and emission reduction technologies.
M&A Activities: The industry witnessed xx Million in M&A deal values during the historical period (2019-2024). Consolidation is expected to continue, driven by economies of scale and the need to navigate increasing regulatory complexities. Major deals involved players like [Insert example of a merger if available, otherwise state “No major deal information is available for this period”].
Product Substitutes: While crude oil remains the dominant energy source, the increasing adoption of renewable energy sources and the potential for alternative fuels (e.g., LNG, ammonia) could present long-term challenges.
End-User Trends: The demand for crude oil carriers is directly linked to global crude oil production and consumption patterns. Shifts in geopolitical stability and energy consumption trends influence market demand.
Crude Oil Carriers Industry Industry Trends & Insights
The global crude oil carriers market is a dynamic sector shaped by a confluence of economic, geopolitical, and environmental forces. Sustained growth is predominantly propelled by escalating global oil demand, with emerging economies being key contributors. However, this expansion is subject to the inherent volatility of oil prices, the pervasive influence of geopolitical uncertainties, and a growing global imperative for environmental sustainability.
The market is anticipated to witness a Compound Annual Growth Rate (CAGR) of approximately [Insert Specific CAGR Here]% during the forecast period of 2025-2033. A notable trend is the increasing adoption of technologically advanced vessels, including those equipped with scrubber technology, to comply with stringent environmental regulations like IMO 2020. Consumer and regulatory pressure is significantly driving the industry towards greener technologies and sustainable operational practices. Competitive dynamics are intricately linked to vessel size, operational efficiency, and charter rates. Furthermore, periodic overcapacity within specific vessel segments can lead to freight rate volatility, directly impacting profitability. The pervasive integration of digitalization and the Internet of Things (IoT) is revolutionizing fleet management and operational efficiency, a trend poised for further acceleration in the coming years.
Dominant Markets & Segments in Crude Oil Carriers Industry
The Very Large Crude Carriers (VLCC) segment dominates the market, driven by its high cargo capacity and cost-effectiveness for long-haul transportation. Asia, particularly the Middle East and East Asia, are the dominant regions due to high crude oil production and consumption.
VLCC Segment Dominance:
- Key Drivers: Economies of scale, cost-effectiveness for long-haul transportation, high demand for transporting large volumes of crude oil from producing regions to major consumption centers.
- Dominance Analysis: VLCCs are preferred for their efficient transport of large crude oil volumes, leading to lower transportation costs per barrel compared to smaller vessels.
Other Segments: The Aframax, Suezmax, and Panamax segments cater to shorter-haul transportation needs and specific port limitations. The medium-range segment is more geographically fragmented and less standardized in terms of vessel size.
Regional Dominance:
- Key Drivers: High crude oil production and consumption in Asia, particularly in the Middle East and East Asia, create high demand for crude oil transportation services. Existing infrastructure further supports this regional dominance.
- Dominance Analysis: The concentration of major oil producers and refineries in the Asia-Pacific region fuels the demand for crude oil carriers and drives the market dominance of this region.
Crude Oil Carriers Industry Product Developments
Recent product innovations in the crude oil carriers industry are largely focused on enhancing fuel efficiency, reducing environmental impact, and optimizing operational capabilities. The development of highly fuel-efficient vessel designs, the widespread integration of advanced scrubber systems for emission control, and significant advancements in digital technologies for sophisticated fleet management and real-time operational optimization are prominent. These innovations are critical in navigating evolving environmental regulations and delivering a competitive edge in a rapidly transforming industry. A discernible shift towards larger, more capacious, and inherently efficient vessels, particularly within the Very Large Crude Carrier (VLCC) segment, is also evident. The primary objectives behind these innovations are to improve economic performance, minimize ecological footprints, and elevate maritime safety standards across operations.
Report Scope & Segmentation Analysis
This report comprehensively segments the crude oil carriers market based on vessel size: Medium Range, Panamax, Aframax, Suezmax, Very Large Crude Carriers (VLCC), and Ultra Large Crude Carriers (ULCC). Each segment is analyzed based on its market size, growth projections, and competitive dynamics. The projections consider factors such as expected global oil production, demand fluctuations, and technological advancements impacting vessel types. For example, the VLCC segment is projected to maintain its market leadership due to economies of scale, while the smaller vessel segments may face challenges related to increasing operational costs.
Key Drivers of Crude Oil Carriers Industry Growth
The expansion of the crude oil carriers industry is underpinned by several fundamental drivers:
- Surging Global Oil Demand: Particularly robust growth in developing economies continues to fuel the need for oil transportation.
- Expansion of Oil Production and Refining: Increased upstream production and downstream refining capacities necessitate enhanced logistics and transportation networks.
- Global Trade and Economic Growth: A healthy global economy directly correlates with increased trade volumes, including that of crude oil.
- Technological Advancements: Innovations leading to more efficient, safer, and environmentally conscious vessels are crucial for industry modernization and competitiveness.
Collectively, these factors establish a persistent and growing requirement for efficient and reliable crude oil transportation solutions, thereby propelling market expansion.
Challenges in the Crude Oil Carriers Industry Sector
The crude oil carriers industry faces a multifaceted set of challenges that demand strategic navigation:
- Oil Price Volatility: Fluctuations in crude oil prices can significantly impact demand for transportation services and charter rates.
- Increasing Regulatory Pressures: Stringent environmental protection mandates (e.g., emissions control) and enhanced safety regulations necessitate ongoing investment and operational adjustments.
- Geopolitical Instability: Tensions and conflicts in key oil-producing regions or along major trade routes can disrupt supply chains and affect shipping operations.
- Vessel Overcapacity: In certain vessel segments, an oversupply of tonnage can lead to intense competition, depressing freight rates and impacting profitability.
These challenges underscore the importance of agile business strategies and robust risk management frameworks within the sector.
Emerging Opportunities in Crude Oil Carriers Industry
Emerging opportunities involve technological advancements in vessel design, digitalization of operations, and the exploration of alternative fuels. The increasing demand for LNG and other cleaner fuels presents opportunities for specialized carriers. Furthermore, opportunities exist in optimizing vessel routes and leveraging data analytics for improved efficiency and cost management.
Leading Players in the Crude Oil Carriers Industry Market
- National Iranian Oil Company (NIOC)
- Minerva Marine Inc
- Teekay Corporation
- China Cosco Shipping Corporation Limited
- Tsakos Energy N/SH
- China Merchants Group Ltd
- Euronav NV
- Petroliam Nasional Berhad (PETRONAS)
- The National Shipping Co Saudi Arabia
- Angelicoussis Shipping Group Ltd
Key Developments in Crude Oil Carriers Industry Industry
- [Month, Year]: [Insert Key Development and its impact - e.g., "Introduction of new VLCC design by Cosco Shipping, enhancing fuel efficiency by xx%."]
- [Month, Year]: [Insert Key Development and its impact - e.g., "Merger between two medium-range carriers resulting in increased market share."]
- [Month, Year]: [Insert Key Development and its impact - e.g., "Implementation of new environmental regulations impacting operational costs for older vessels."]
- [Month, Year]: [Add another key development if available, otherwise remove the bullet point. ]
Strategic Outlook for Crude Oil Carriers Industry Market
The future of the crude oil carriers industry is intertwined with global energy trends and technological innovations. While the transition towards cleaner energy sources presents challenges, the continuing demand for crude oil, particularly in developing economies, ensures a sustained need for efficient crude oil transportation. Strategic players will need to adapt to evolving regulations, invest in technological advancements, and optimize operational strategies to thrive in this dynamic market. The industry's future success will hinge on companies' ability to balance economic viability with environmental sustainability.
Crude Oil Carriers Industry Segmentation
-
1. Size
- 1.1. Medium Range
- 1.2. Panaxax
- 1.3. Aframax
- 1.4. Suezmax
- 1.5. Very Lar
Crude Oil Carriers Industry Segmentation By Geography
- 1. North America
- 2. Europe
- 3. Asia Pacific
- 4. South America
- 5. Middle East
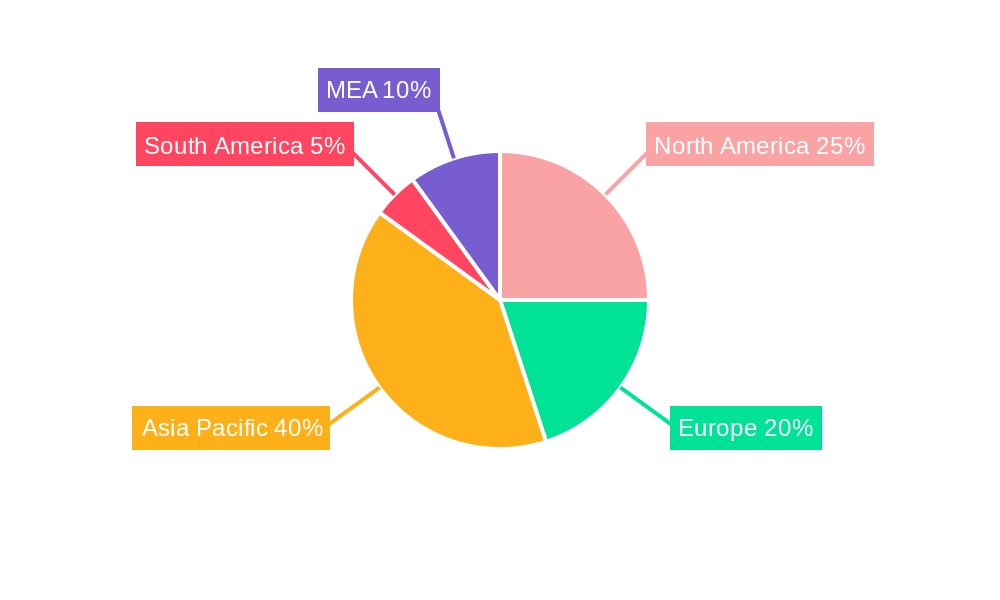
Crude Oil Carriers Industry Regional Market Share
Geographic Coverage of Crude Oil Carriers Industry
Crude Oil Carriers Industry REPORT HIGHLIGHTS
| Aspects | Details |
|---|---|
| Study Period | 2020-2034 |
| Base Year | 2025 |
| Estimated Year | 2026 |
| Forecast Period | 2026-2034 |
| Historical Period | 2020-2025 |
| Growth Rate | CAGR of 4.6% from 2020-2034 |
| Segmentation |
|
Table of Contents
- 1. Introduction
- 1.1. Research Scope
- 1.2. Market Segmentation
- 1.3. Research Objective
- 1.4. Definitions and Assumptions
- 2. Executive Summary
- 2.1. Market Snapshot
- 3. Market Dynamics
- 3.1. Market Drivers
- 3.2. Market Restrains
- 3.3. Market Trends
- 3.4. Market Opportunities
- 4. Market Factor Analysis
- 4.1. Porters Five Forces
- 4.1.1. Bargaining Power of Suppliers
- 4.1.2. Bargaining Power of Buyers
- 4.1.3. Threat of New Entrants
- 4.1.4. Threat of Substitutes
- 4.1.5. Competitive Rivalry
- 4.2. PESTEL analysis
- 4.3. BCG Analysis
- 4.3.1. Stars (High Growth, High Market Share)
- 4.3.2. Cash Cows (Low Growth, High Market Share)
- 4.3.3. Question Mark (High Growth, Low Market Share)
- 4.3.4. Dogs (Low Growth, Low Market Share)
- 4.4. Ansoff Matrix Analysis
- 4.5. Supply Chain Analysis
- 4.6. Regulatory Landscape
- 4.7. Current Market Potential and Opportunity Assessment (TAM–SAM–SOM Framework)
- 4.8. RAX Analyst Note
- 4.1. Porters Five Forces
- 5. Market Analysis, Insights and Forecast 2021-2033
- 5.1. Market Analysis, Insights and Forecast - by Size
- 5.1.1. Medium Range
- 5.1.2. Panaxax
- 5.1.3. Aframax
- 5.1.4. Suezmax
- 5.1.5. Very Lar
- 5.2. Market Analysis, Insights and Forecast - by Region
- 5.2.1. North America
- 5.2.2. Europe
- 5.2.3. Asia Pacific
- 5.2.4. South America
- 5.2.5. Middle East
- 5.1. Market Analysis, Insights and Forecast - by Size
- 6. Global Crude Oil Carriers Industry Analysis, Insights and Forecast, 2021-2033
- 6.1. Market Analysis, Insights and Forecast - by Size
- 6.1.1. Medium Range
- 6.1.2. Panaxax
- 6.1.3. Aframax
- 6.1.4. Suezmax
- 6.1.5. Very Lar
- 6.1. Market Analysis, Insights and Forecast - by Size
- 7. North America Crude Oil Carriers Industry Analysis, Insights and Forecast, 2020-2032
- 7.1. Market Analysis, Insights and Forecast - by Size
- 7.1.1. Medium Range
- 7.1.2. Panaxax
- 7.1.3. Aframax
- 7.1.4. Suezmax
- 7.1.5. Very Lar
- 7.1. Market Analysis, Insights and Forecast - by Size
- 8. Europe Crude Oil Carriers Industry Analysis, Insights and Forecast, 2020-2032
- 8.1. Market Analysis, Insights and Forecast - by Size
- 8.1.1. Medium Range
- 8.1.2. Panaxax
- 8.1.3. Aframax
- 8.1.4. Suezmax
- 8.1.5. Very Lar
- 8.1. Market Analysis, Insights and Forecast - by Size
- 9. Asia Pacific Crude Oil Carriers Industry Analysis, Insights and Forecast, 2020-2032
- 9.1. Market Analysis, Insights and Forecast - by Size
- 9.1.1. Medium Range
- 9.1.2. Panaxax
- 9.1.3. Aframax
- 9.1.4. Suezmax
- 9.1.5. Very Lar
- 9.1. Market Analysis, Insights and Forecast - by Size
- 10. South America Crude Oil Carriers Industry Analysis, Insights and Forecast, 2020-2032
- 10.1. Market Analysis, Insights and Forecast - by Size
- 10.1.1. Medium Range
- 10.1.2. Panaxax
- 10.1.3. Aframax
- 10.1.4. Suezmax
- 10.1.5. Very Lar
- 10.1. Market Analysis, Insights and Forecast - by Size
- 11. Middle East Crude Oil Carriers Industry Analysis, Insights and Forecast, 2020-2032
- 11.1. Market Analysis, Insights and Forecast - by Size
- 11.1.1. Medium Range
- 11.1.2. Panaxax
- 11.1.3. Aframax
- 11.1.4. Suezmax
- 11.1.5. Very Lar
- 11.1. Market Analysis, Insights and Forecast - by Size
- 12. Competitive Analysis
- 12.1. Company Profiles
- 12.1.1 National Iranian Oil Company (NIOC)
- 12.1.1.1. Company Overview
- 12.1.1.2. Products
- 12.1.1.3. Company Financials
- 12.1.1.4. SWOT Analysis
- 12.1.2 Minerva Marine Inc
- 12.1.2.1. Company Overview
- 12.1.2.2. Products
- 12.1.2.3. Company Financials
- 12.1.2.4. SWOT Analysis
- 12.1.3 Teekay Corporation
- 12.1.3.1. Company Overview
- 12.1.3.2. Products
- 12.1.3.3. Company Financials
- 12.1.3.4. SWOT Analysis
- 12.1.4 China Cosco Shipping Corporation Limited
- 12.1.4.1. Company Overview
- 12.1.4.2. Products
- 12.1.4.3. Company Financials
- 12.1.4.4. SWOT Analysis
- 12.1.5 Tsakos Energy N/SH
- 12.1.5.1. Company Overview
- 12.1.5.2. Products
- 12.1.5.3. Company Financials
- 12.1.5.4. SWOT Analysis
- 12.1.6 China Merchants Group Ltd
- 12.1.6.1. Company Overview
- 12.1.6.2. Products
- 12.1.6.3. Company Financials
- 12.1.6.4. SWOT Analysis
- 12.1.7 Euronav NV
- 12.1.7.1. Company Overview
- 12.1.7.2. Products
- 12.1.7.3. Company Financials
- 12.1.7.4. SWOT Analysis
- 12.1.8 Petroliam Nasional Berhad (PETRONAS)*List Not Exhaustive
- 12.1.8.1. Company Overview
- 12.1.8.2. Products
- 12.1.8.3. Company Financials
- 12.1.8.4. SWOT Analysis
- 12.1.9 The National Shipping Co Saudi Arabia
- 12.1.9.1. Company Overview
- 12.1.9.2. Products
- 12.1.9.3. Company Financials
- 12.1.9.4. SWOT Analysis
- 12.1.10 Angelicoussis Shipping Group Ltd
- 12.1.10.1. Company Overview
- 12.1.10.2. Products
- 12.1.10.3. Company Financials
- 12.1.10.4. SWOT Analysis
- 12.1.1 National Iranian Oil Company (NIOC)
- 12.2. Market Entropy
- 12.2.1 Company's Key Areas Served
- 12.2.2 Recent Developments
- 12.3. Company Market Share Analysis 2025
- 12.3.1 Top 5 Companies Market Share Analysis
- 12.3.2 Top 3 Companies Market Share Analysis
- 12.4. List of Potential Customers
- 13. Research Methodology
List of Figures
- Figure 1: Global Crude Oil Carriers Industry Revenue Breakdown (million, %) by Region 2025 & 2033
- Figure 2: Global Crude Oil Carriers Industry Volume Breakdown (metric tonnes, %) by Region 2025 & 2033
- Figure 3: North America Crude Oil Carriers Industry Revenue (million), by Size 2025 & 2033
- Figure 4: North America Crude Oil Carriers Industry Volume (metric tonnes), by Size 2025 & 2033
- Figure 5: North America Crude Oil Carriers Industry Revenue Share (%), by Size 2025 & 2033
- Figure 6: North America Crude Oil Carriers Industry Volume Share (%), by Size 2025 & 2033
- Figure 7: North America Crude Oil Carriers Industry Revenue (million), by Country 2025 & 2033
- Figure 8: North America Crude Oil Carriers Industry Volume (metric tonnes), by Country 2025 & 2033
- Figure 9: North America Crude Oil Carriers Industry Revenue Share (%), by Country 2025 & 2033
- Figure 10: North America Crude Oil Carriers Industry Volume Share (%), by Country 2025 & 2033
- Figure 11: Europe Crude Oil Carriers Industry Revenue (million), by Size 2025 & 2033
- Figure 12: Europe Crude Oil Carriers Industry Volume (metric tonnes), by Size 2025 & 2033
- Figure 13: Europe Crude Oil Carriers Industry Revenue Share (%), by Size 2025 & 2033
- Figure 14: Europe Crude Oil Carriers Industry Volume Share (%), by Size 2025 & 2033
- Figure 15: Europe Crude Oil Carriers Industry Revenue (million), by Country 2025 & 2033
- Figure 16: Europe Crude Oil Carriers Industry Volume (metric tonnes), by Country 2025 & 2033
- Figure 17: Europe Crude Oil Carriers Industry Revenue Share (%), by Country 2025 & 2033
- Figure 18: Europe Crude Oil Carriers Industry Volume Share (%), by Country 2025 & 2033
- Figure 19: Asia Pacific Crude Oil Carriers Industry Revenue (million), by Size 2025 & 2033
- Figure 20: Asia Pacific Crude Oil Carriers Industry Volume (metric tonnes), by Size 2025 & 2033
- Figure 21: Asia Pacific Crude Oil Carriers Industry Revenue Share (%), by Size 2025 & 2033
- Figure 22: Asia Pacific Crude Oil Carriers Industry Volume Share (%), by Size 2025 & 2033
- Figure 23: Asia Pacific Crude Oil Carriers Industry Revenue (million), by Country 2025 & 2033
- Figure 24: Asia Pacific Crude Oil Carriers Industry Volume (metric tonnes), by Country 2025 & 2033
- Figure 25: Asia Pacific Crude Oil Carriers Industry Revenue Share (%), by Country 2025 & 2033
- Figure 26: Asia Pacific Crude Oil Carriers Industry Volume Share (%), by Country 2025 & 2033
- Figure 27: South America Crude Oil Carriers Industry Revenue (million), by Size 2025 & 2033
- Figure 28: South America Crude Oil Carriers Industry Volume (metric tonnes), by Size 2025 & 2033
- Figure 29: South America Crude Oil Carriers Industry Revenue Share (%), by Size 2025 & 2033
- Figure 30: South America Crude Oil Carriers Industry Volume Share (%), by Size 2025 & 2033
- Figure 31: South America Crude Oil Carriers Industry Revenue (million), by Country 2025 & 2033
- Figure 32: South America Crude Oil Carriers Industry Volume (metric tonnes), by Country 2025 & 2033
- Figure 33: South America Crude Oil Carriers Industry Revenue Share (%), by Country 2025 & 2033
- Figure 34: South America Crude Oil Carriers Industry Volume Share (%), by Country 2025 & 2033
- Figure 35: Middle East Crude Oil Carriers Industry Revenue (million), by Size 2025 & 2033
- Figure 36: Middle East Crude Oil Carriers Industry Volume (metric tonnes), by Size 2025 & 2033
- Figure 37: Middle East Crude Oil Carriers Industry Revenue Share (%), by Size 2025 & 2033
- Figure 38: Middle East Crude Oil Carriers Industry Volume Share (%), by Size 2025 & 2033
- Figure 39: Middle East Crude Oil Carriers Industry Revenue (million), by Country 2025 & 2033
- Figure 40: Middle East Crude Oil Carriers Industry Volume (metric tonnes), by Country 2025 & 2033
- Figure 41: Middle East Crude Oil Carriers Industry Revenue Share (%), by Country 2025 & 2033
- Figure 42: Middle East Crude Oil Carriers Industry Volume Share (%), by Country 2025 & 2033
List of Tables
- Table 1: Global Crude Oil Carriers Industry Revenue million Forecast, by Size 2020 & 2033
- Table 2: Global Crude Oil Carriers Industry Volume metric tonnes Forecast, by Size 2020 & 2033
- Table 3: Global Crude Oil Carriers Industry Revenue million Forecast, by Region 2020 & 2033
- Table 4: Global Crude Oil Carriers Industry Volume metric tonnes Forecast, by Region 2020 & 2033
- Table 5: Global Crude Oil Carriers Industry Revenue million Forecast, by Size 2020 & 2033
- Table 6: Global Crude Oil Carriers Industry Volume metric tonnes Forecast, by Size 2020 & 2033
- Table 7: Global Crude Oil Carriers Industry Revenue million Forecast, by Country 2020 & 2033
- Table 8: Global Crude Oil Carriers Industry Volume metric tonnes Forecast, by Country 2020 & 2033
- Table 9: Global Crude Oil Carriers Industry Revenue million Forecast, by Size 2020 & 2033
- Table 10: Global Crude Oil Carriers Industry Volume metric tonnes Forecast, by Size 2020 & 2033
- Table 11: Global Crude Oil Carriers Industry Revenue million Forecast, by Country 2020 & 2033
- Table 12: Global Crude Oil Carriers Industry Volume metric tonnes Forecast, by Country 2020 & 2033
- Table 13: Global Crude Oil Carriers Industry Revenue million Forecast, by Size 2020 & 2033
- Table 14: Global Crude Oil Carriers Industry Volume metric tonnes Forecast, by Size 2020 & 2033
- Table 15: Global Crude Oil Carriers Industry Revenue million Forecast, by Country 2020 & 2033
- Table 16: Global Crude Oil Carriers Industry Volume metric tonnes Forecast, by Country 2020 & 2033
- Table 17: Global Crude Oil Carriers Industry Revenue million Forecast, by Size 2020 & 2033
- Table 18: Global Crude Oil Carriers Industry Volume metric tonnes Forecast, by Size 2020 & 2033
- Table 19: Global Crude Oil Carriers Industry Revenue million Forecast, by Country 2020 & 2033
- Table 20: Global Crude Oil Carriers Industry Volume metric tonnes Forecast, by Country 2020 & 2033
- Table 21: Global Crude Oil Carriers Industry Revenue million Forecast, by Size 2020 & 2033
- Table 22: Global Crude Oil Carriers Industry Volume metric tonnes Forecast, by Size 2020 & 2033
- Table 23: Global Crude Oil Carriers Industry Revenue million Forecast, by Country 2020 & 2033
- Table 24: Global Crude Oil Carriers Industry Volume metric tonnes Forecast, by Country 2020 & 2033
Frequently Asked Questions
1. What is the projected Compound Annual Growth Rate (CAGR) of the Crude Oil Carriers Industry?
The projected CAGR is approximately 4.6%.
2. Which companies are prominent players in the Crude Oil Carriers Industry?
Key companies in the market include National Iranian Oil Company (NIOC), Minerva Marine Inc, Teekay Corporation, China Cosco Shipping Corporation Limited, Tsakos Energy N/SH, China Merchants Group Ltd, Euronav NV, Petroliam Nasional Berhad (PETRONAS)*List Not Exhaustive, The National Shipping Co Saudi Arabia, Angelicoussis Shipping Group Ltd.
3. What are the main segments of the Crude Oil Carriers Industry?
The market segments include Size.
4. Can you provide details about the market size?
The market size is estimated to be USD 225142.8 million as of 2022.
5. What are some drivers contributing to market growth?
Increasing Electricity Demand; Rising Investments in the Coal Industry.
6. What are the notable trends driving market growth?
Very Large Crude Carrier to Dominate the Market.
7. Are there any restraints impacting market growth?
Increasing Installation of Renewable Energy Sources.
8. Can you provide examples of recent developments in the market?
N/A
9. What pricing options are available for accessing the report?
Pricing options include single-user, multi-user, and enterprise licenses priced at USD 4750, USD 5250, and USD 8750 respectively.
10. Is the market size provided in terms of value or volume?
The market size is provided in terms of value, measured in million and volume, measured in metric tonnes.
11. Are there any specific market keywords associated with the report?
Yes, the market keyword associated with the report is "Crude Oil Carriers Industry," which aids in identifying and referencing the specific market segment covered.
12. How do I determine which pricing option suits my needs best?
The pricing options vary based on user requirements and access needs. Individual users may opt for single-user licenses, while businesses requiring broader access may choose multi-user or enterprise licenses for cost-effective access to the report.
13. Are there any additional resources or data provided in the Crude Oil Carriers Industry report?
While the report offers comprehensive insights, it's advisable to review the specific contents or supplementary materials provided to ascertain if additional resources or data are available.
14. How can I stay updated on further developments or reports in the Crude Oil Carriers Industry?
To stay informed about further developments, trends, and reports in the Crude Oil Carriers Industry, consider subscribing to industry newsletters, following relevant companies and organizations, or regularly checking reputable industry news sources and publications.
Methodology
Step 1 - Identification of Relevant Samples Size from Population Database


Step 2 - Approaches for Defining Global Market Size (Value, Volume* & Price*)

Note*: In applicable scenarios
Step 3 - Data Sources
Primary Research
- Web Analytics
- Survey Reports
- Research Institute
- Latest Research Reports
- Opinion Leaders
Secondary Research
- Annual Reports
- White Paper
- Latest Press Release
- Industry Association
- Paid Database
- Investor Presentations

Step 4 - Data Triangulation
Involves using different sources of information in order to increase the validity of a study
These sources are likely to be stakeholders in a program - participants, other researchers, program staff, other community members, and so on.
Then we put all data in single framework & apply various statistical tools to find out the dynamic on the market.
During the analysis stage, feedback from the stakeholder groups would be compared to determine areas of agreement as well as areas of divergence