

Key Insights
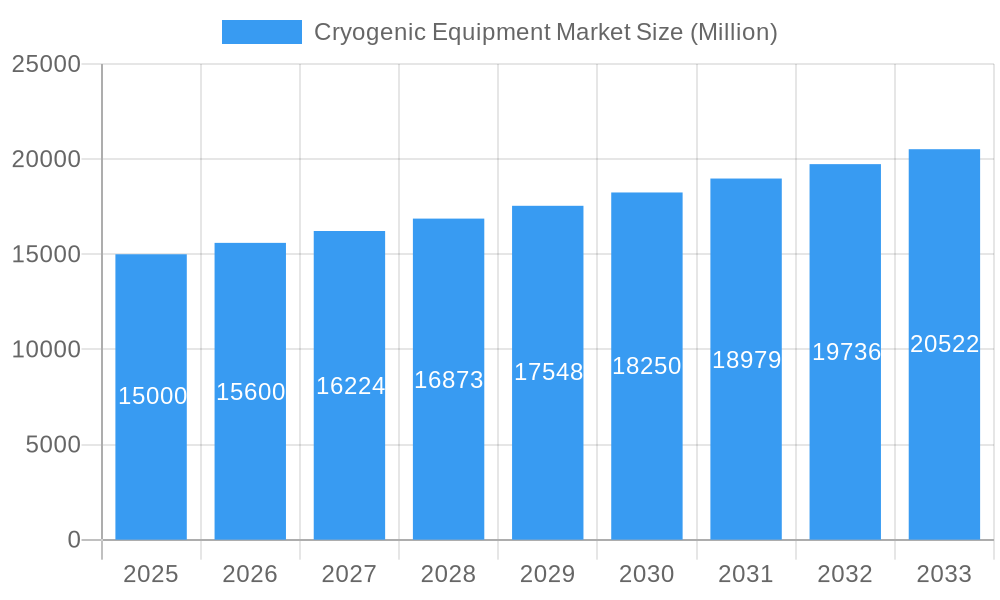
The global cryogenic equipment market, valued at $26.6 billion in 2025, is projected to grow at a Compound Annual Growth Rate (CAGR) of 6.8% from 2025 to 2033. This growth is propelled by increasing demand in the energy sector, particularly LNG and renewables, alongside technological advancements in cryogenic solutions. The food and beverage industry's adoption of cryogenic freezing, coupled with expansion in chemical and healthcare applications, further fuels market dynamics. North America and Asia-Pacific are anticipated to dominate market share due to substantial investments in energy infrastructure and technological innovation.
Cryogenic Equipment Market Market Size (In Billion)
Key market restraints include high initial investment costs and stringent safety regulations for cryogenic fluid handling. Despite these challenges, the market offers diverse growth opportunities across various end-user industries, equipment types, applications, and gas types. The competitive landscape features established players and specialized niche companies, focusing on strategic partnerships, innovation, and geographic expansion to secure market advantage.
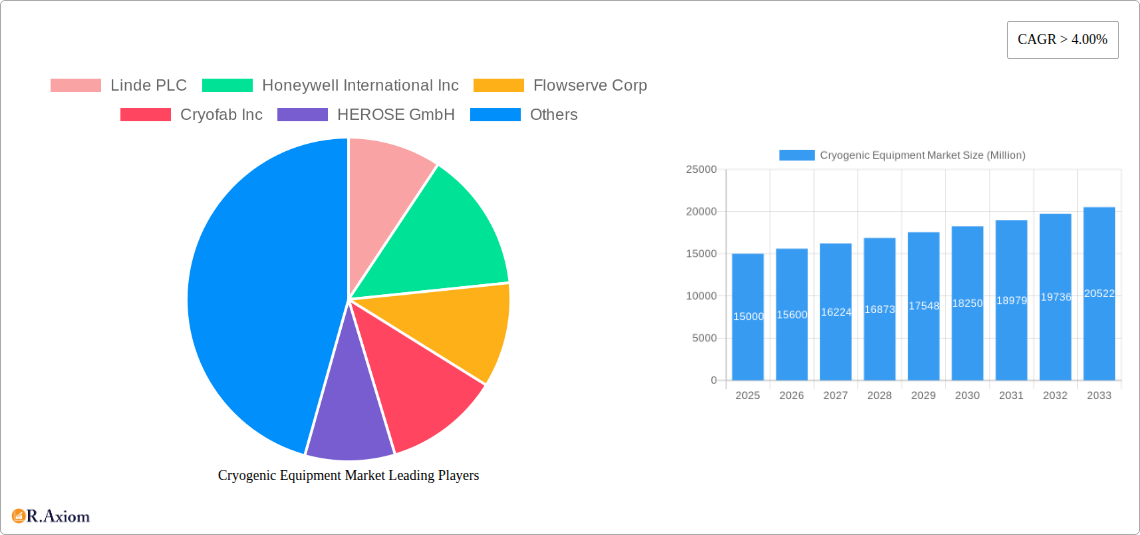
Cryogenic Equipment Market Company Market Share
Cryogenic Equipment Market: A Comprehensive Report (2019-2033)
This comprehensive report provides a detailed analysis of the Cryogenic Equipment market, offering invaluable insights for industry stakeholders, investors, and researchers. Covering the period from 2019 to 2033, with a focus on 2025, this report dissects market trends, competitive landscapes, and future growth projections. The report utilizes a robust methodology, incorporating both primary and secondary research to deliver accurate and reliable data. The global market size is projected to reach xx Million by 2033.
Cryogenic Equipment Market Concentration & Innovation
The Cryogenic Equipment market exhibits a moderately concentrated structure, with key players like Linde PLC, Honeywell International Inc, and Chart Industries Inc holding significant market share. However, the presence of several regional and specialized players indicates a dynamic competitive landscape. Innovation is a crucial driver, fueled by advancements in materials science, cryogenic engineering, and automation technologies. Stringent regulatory frameworks regarding safety and environmental compliance influence market dynamics. Product substitutes are limited, primarily focusing on alternative cooling techniques for specific applications. End-user trends towards energy efficiency and sustainability are shaping demand, encouraging the adoption of more efficient and eco-friendly cryogenic equipment. M&A activity has been moderate, with deal values ranging from xx Million to xx Million in recent years, primarily focused on consolidating market share and expanding product portfolios.
- Market Share Concentration: Top 5 players hold approximately xx% of the market share.
- Innovation Drivers: Advancements in materials, automation, and energy-efficient designs.
- Regulatory Impact: Stringent safety and environmental regulations drive product development.
- M&A Activity: Consolidation efforts increase market concentration; average deal value: xx Million.
- End-User Trends: Demand driven by energy efficiency and sustainable practices.
Cryogenic Equipment Market Industry Trends & Insights
The Cryogenic Equipment market is projected to experience a CAGR of xx% during the forecast period (2025-2033). Growth is primarily driven by increasing demand from various end-user industries, including oil and gas, energy and power, and healthcare. Technological disruptions, such as the development of advanced materials and improved process efficiency, are enhancing the performance and reliability of cryogenic equipment. Consumer preferences are shifting towards energy-efficient and environmentally friendly solutions, creating opportunities for manufacturers offering sustainable products. Competitive dynamics are characterized by technological advancements, strategic partnerships, and ongoing innovation. Market penetration is high in developed regions but is expected to increase significantly in developing economies, driven by infrastructure development and industrial growth.
Dominant Markets & Segments in Cryogenic Equipment Market
The Oil and Gas segment currently dominates the Cryogenic Equipment market, driven by the rising demand for natural gas liquefaction and transportation. North America and Europe represent the leading regions, with strong existing infrastructure and significant industrial activity.
- Leading Regions: North America and Europe.
- Dominant End-User Industry: Oil and Gas, driven by LNG processing and transportation.
- Key Drivers: Increasing energy demand, infrastructure development, and stringent environmental regulations.
Dominant Segments:
- Equipment: Tanks hold the largest market share due to their extensive use in storage and transportation.
- Application: Storage and transportation segments dominate due to their role in the cryogenic supply chain.
- Gas Used: Liquified Nitrogen holds the largest market share due to its widespread applications.
Detailed Dominance Analysis:
The Oil and Gas segment's dominance is fueled by substantial investments in LNG infrastructure and the growing demand for natural gas globally. This segment benefits from economies of scale, established supply chains, and government support for energy infrastructure. North America's leadership stems from its large reserves of natural gas and shale gas production, while Europe's prominence is attributed to its large energy consumption and the ongoing transition towards cleaner energy sources.
Cryogenic Equipment Market Product Developments
Recent product innovations focus on enhancing efficiency, improving safety features, and reducing environmental impact. Miniaturization of cryogenic equipment for niche applications is gaining traction. Improved materials and advanced design techniques are leading to more robust and reliable equipment. Companies are focusing on developing equipment with enhanced automation features and remote monitoring capabilities. This focus on performance, safety, and efficiency is leading to increased market penetration and competitive advantages.
Report Scope & Segmentation Analysis
This report provides a comprehensive segmentation analysis of the Cryogenic Equipment market across the following parameters:
End-user Industry: Oil and Gas, Energy and Power, Food and Beverages, Marine and Aerospace, Chemical and Healthcare, Other End-user Industries. Each segment's growth trajectory is analyzed, considering specific market drivers and competitive dynamics. Market size estimations and growth projections are provided for each segment.
Equipment: Tanks, Pumps, Heat Exchangers, Valves, Other Equipment. The report analyzes the market share and growth potential of each equipment type, considering technological advancements and adoption rates.
Application: Storage, Transportation and Distribution, Processing, Other Applications. Detailed analysis includes growth projections, market size, and competitive dynamics.
Gas Used: Liquified Nitrogen, Liquified Helium, Other Gases Used. This segmentation considers the unique characteristics of each gas and its specific applications within the cryogenic equipment market.
Key Drivers of Cryogenic Equipment Market Growth
The Cryogenic Equipment market's growth is driven by several factors, including the rising demand for liquefied natural gas (LNG), the expansion of the energy and power sector, and the increasing applications of cryogenics in healthcare and food processing. Technological advancements, such as improved insulation materials and efficient refrigeration systems, are boosting market expansion. Furthermore, government regulations and incentives promoting cleaner energy solutions are positively impacting market growth.
Challenges in the Cryogenic Equipment Market Sector
Several challenges hinder the Cryogenic Equipment market's growth. High initial investment costs and operational complexity are barriers to entry for new players. Supply chain disruptions, especially concerning specialized materials and components, pose significant challenges. Intense competition from established players and the need for stringent safety and environmental compliance add complexity.
Emerging Opportunities in Cryogenic Equipment Market
The market presents significant opportunities for innovation and growth. The increasing adoption of cryogenic technology in emerging applications, such as cryotherapy and cryopreservation, creates new revenue streams. Advancements in materials science are leading to the development of lighter, more efficient, and cost-effective equipment. The focus on sustainable solutions opens opportunities for eco-friendly cryogenic equipment with reduced environmental impact.
Leading Players in the Cryogenic Equipment Market Market
- Linde PLC
- Honeywell International Inc
- Flowserve Corp
- Cryofab Inc
- HEROSE GmbH
- Emerson Electric Co
- Chart Industries Inc
- McDermott International Inc
- Sumitomo Heavy Industries Ltd
- Beijing Tianhai Industry Co Ltd
Key Developments in Cryogenic Equipment Market Industry
- January 2022: Saulsbury awarded an EPC contract for two cryogenic processing facilities in the Midland Basin, significantly expanding its processing capacity.
- October 2021: Chemie-Tech awarded a contract for Cryogenic Double Wall Storage Tanks and associated facilities at HPCL Rajasthan Refinery Ltd in India.
Strategic Outlook for Cryogenic Equipment Market Market
The Cryogenic Equipment market exhibits strong growth potential, driven by ongoing technological advancements, increasing demand from diverse end-user industries, and supportive government policies. Strategic investments in research and development, coupled with strategic partnerships and acquisitions, will be crucial for market leadership. Focus on sustainability and energy efficiency will be key to capturing market share and meeting evolving customer demands.
Cryogenic Equipment Market Segmentation
-
1. Equipment
- 1.1. Tanks
- 1.2. Pumps
- 1.3. Heat Exchanger
- 1.4. Valves
- 1.5. Other Equipment
-
2. Application
- 2.1. Storage
- 2.2. Transportation and Distribution
- 2.3. Processing
- 2.4. Other Applications
-
3. Gas Used
- 3.1. Liquified Nitrogen
- 3.2. Liquified Helium
- 3.3. Other Gases Used
-
4. End-user Industry
- 4.1. Oil and Gas
- 4.2. Energy and Power
- 4.3. Food and Beverages
- 4.4. Marine and Areospace
- 4.5. Chemical and Healthcare
- 4.6. Other End-user Industries
Cryogenic Equipment Market Segmentation By Geography
- 1. North America
- 2. Europe
- 3. Asia Pacific
- 4. South America
- 5. Middle East and Africa
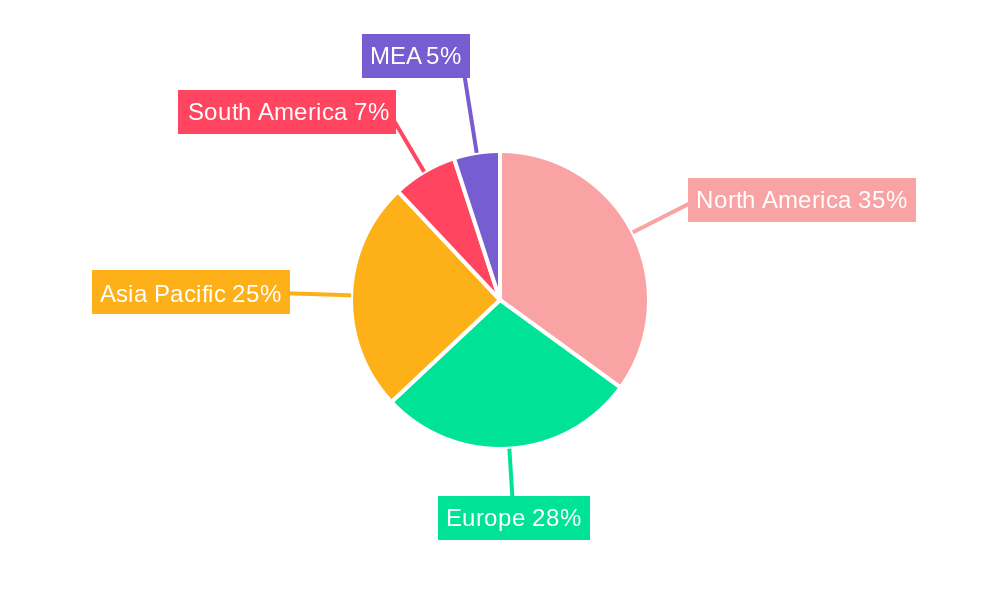
Cryogenic Equipment Market Regional Market Share
Geographic Coverage of Cryogenic Equipment Market
Cryogenic Equipment Market REPORT HIGHLIGHTS
| Aspects | Details |
|---|---|
| Study Period | 2020-2034 |
| Base Year | 2025 |
| Estimated Year | 2026 |
| Forecast Period | 2026-2034 |
| Historical Period | 2020-2025 |
| Growth Rate | CAGR of 6.8% from 2020-2034 |
| Segmentation |
|
Table of Contents
- 1. Introduction
- 1.1. Research Scope
- 1.2. Market Segmentation
- 1.3. Research Objective
- 1.4. Definitions and Assumptions
- 2. Executive Summary
- 2.1. Market Snapshot
- 3. Market Dynamics
- 3.1. Market Drivers
- 3.2. Market Restrains
- 3.3. Market Trends
- 3.4. Market Opportunities
- 4. Market Factor Analysis
- 4.1. Porters Five Forces
- 4.1.1. Bargaining Power of Suppliers
- 4.1.2. Bargaining Power of Buyers
- 4.1.3. Threat of New Entrants
- 4.1.4. Threat of Substitutes
- 4.1.5. Competitive Rivalry
- 4.2. PESTEL analysis
- 4.3. BCG Analysis
- 4.3.1. Stars (High Growth, High Market Share)
- 4.3.2. Cash Cows (Low Growth, High Market Share)
- 4.3.3. Question Mark (High Growth, Low Market Share)
- 4.3.4. Dogs (Low Growth, Low Market Share)
- 4.4. Ansoff Matrix Analysis
- 4.5. Supply Chain Analysis
- 4.6. Regulatory Landscape
- 4.7. Current Market Potential and Opportunity Assessment (TAM–SAM–SOM Framework)
- 4.8. RAX Analyst Note
- 4.1. Porters Five Forces
- 5. Market Analysis, Insights and Forecast 2021-2033
- 5.1. Market Analysis, Insights and Forecast - by Equipment
- 5.1.1. Tanks
- 5.1.2. Pumps
- 5.1.3. Heat Exchanger
- 5.1.4. Valves
- 5.1.5. Other Equipment
- 5.2. Market Analysis, Insights and Forecast - by Application
- 5.2.1. Storage
- 5.2.2. Transportation and Distribution
- 5.2.3. Processing
- 5.2.4. Other Applications
- 5.3. Market Analysis, Insights and Forecast - by Gas Used
- 5.3.1. Liquified Nitrogen
- 5.3.2. Liquified Helium
- 5.3.3. Other Gases Used
- 5.4. Market Analysis, Insights and Forecast - by End-user Industry
- 5.4.1. Oil and Gas
- 5.4.2. Energy and Power
- 5.4.3. Food and Beverages
- 5.4.4. Marine and Areospace
- 5.4.5. Chemical and Healthcare
- 5.4.6. Other End-user Industries
- 5.5. Market Analysis, Insights and Forecast - by Region
- 5.5.1. North America
- 5.5.2. Europe
- 5.5.3. Asia Pacific
- 5.5.4. South America
- 5.5.5. Middle East and Africa
- 5.1. Market Analysis, Insights and Forecast - by Equipment
- 6. Global Cryogenic Equipment Market Analysis, Insights and Forecast, 2021-2033
- 6.1. Market Analysis, Insights and Forecast - by Equipment
- 6.1.1. Tanks
- 6.1.2. Pumps
- 6.1.3. Heat Exchanger
- 6.1.4. Valves
- 6.1.5. Other Equipment
- 6.2. Market Analysis, Insights and Forecast - by Application
- 6.2.1. Storage
- 6.2.2. Transportation and Distribution
- 6.2.3. Processing
- 6.2.4. Other Applications
- 6.3. Market Analysis, Insights and Forecast - by Gas Used
- 6.3.1. Liquified Nitrogen
- 6.3.2. Liquified Helium
- 6.3.3. Other Gases Used
- 6.4. Market Analysis, Insights and Forecast - by End-user Industry
- 6.4.1. Oil and Gas
- 6.4.2. Energy and Power
- 6.4.3. Food and Beverages
- 6.4.4. Marine and Areospace
- 6.4.5. Chemical and Healthcare
- 6.4.6. Other End-user Industries
- 6.1. Market Analysis, Insights and Forecast - by Equipment
- 7. North America Cryogenic Equipment Market Analysis, Insights and Forecast, 2020-2032
- 7.1. Market Analysis, Insights and Forecast - by Equipment
- 7.1.1. Tanks
- 7.1.2. Pumps
- 7.1.3. Heat Exchanger
- 7.1.4. Valves
- 7.1.5. Other Equipment
- 7.2. Market Analysis, Insights and Forecast - by Application
- 7.2.1. Storage
- 7.2.2. Transportation and Distribution
- 7.2.3. Processing
- 7.2.4. Other Applications
- 7.3. Market Analysis, Insights and Forecast - by Gas Used
- 7.3.1. Liquified Nitrogen
- 7.3.2. Liquified Helium
- 7.3.3. Other Gases Used
- 7.4. Market Analysis, Insights and Forecast - by End-user Industry
- 7.4.1. Oil and Gas
- 7.4.2. Energy and Power
- 7.4.3. Food and Beverages
- 7.4.4. Marine and Areospace
- 7.4.5. Chemical and Healthcare
- 7.4.6. Other End-user Industries
- 7.1. Market Analysis, Insights and Forecast - by Equipment
- 8. Europe Cryogenic Equipment Market Analysis, Insights and Forecast, 2020-2032
- 8.1. Market Analysis, Insights and Forecast - by Equipment
- 8.1.1. Tanks
- 8.1.2. Pumps
- 8.1.3. Heat Exchanger
- 8.1.4. Valves
- 8.1.5. Other Equipment
- 8.2. Market Analysis, Insights and Forecast - by Application
- 8.2.1. Storage
- 8.2.2. Transportation and Distribution
- 8.2.3. Processing
- 8.2.4. Other Applications
- 8.3. Market Analysis, Insights and Forecast - by Gas Used
- 8.3.1. Liquified Nitrogen
- 8.3.2. Liquified Helium
- 8.3.3. Other Gases Used
- 8.4. Market Analysis, Insights and Forecast - by End-user Industry
- 8.4.1. Oil and Gas
- 8.4.2. Energy and Power
- 8.4.3. Food and Beverages
- 8.4.4. Marine and Areospace
- 8.4.5. Chemical and Healthcare
- 8.4.6. Other End-user Industries
- 8.1. Market Analysis, Insights and Forecast - by Equipment
- 9. Asia Pacific Cryogenic Equipment Market Analysis, Insights and Forecast, 2020-2032
- 9.1. Market Analysis, Insights and Forecast - by Equipment
- 9.1.1. Tanks
- 9.1.2. Pumps
- 9.1.3. Heat Exchanger
- 9.1.4. Valves
- 9.1.5. Other Equipment
- 9.2. Market Analysis, Insights and Forecast - by Application
- 9.2.1. Storage
- 9.2.2. Transportation and Distribution
- 9.2.3. Processing
- 9.2.4. Other Applications
- 9.3. Market Analysis, Insights and Forecast - by Gas Used
- 9.3.1. Liquified Nitrogen
- 9.3.2. Liquified Helium
- 9.3.3. Other Gases Used
- 9.4. Market Analysis, Insights and Forecast - by End-user Industry
- 9.4.1. Oil and Gas
- 9.4.2. Energy and Power
- 9.4.3. Food and Beverages
- 9.4.4. Marine and Areospace
- 9.4.5. Chemical and Healthcare
- 9.4.6. Other End-user Industries
- 9.1. Market Analysis, Insights and Forecast - by Equipment
- 10. South America Cryogenic Equipment Market Analysis, Insights and Forecast, 2020-2032
- 10.1. Market Analysis, Insights and Forecast - by Equipment
- 10.1.1. Tanks
- 10.1.2. Pumps
- 10.1.3. Heat Exchanger
- 10.1.4. Valves
- 10.1.5. Other Equipment
- 10.2. Market Analysis, Insights and Forecast - by Application
- 10.2.1. Storage
- 10.2.2. Transportation and Distribution
- 10.2.3. Processing
- 10.2.4. Other Applications
- 10.3. Market Analysis, Insights and Forecast - by Gas Used
- 10.3.1. Liquified Nitrogen
- 10.3.2. Liquified Helium
- 10.3.3. Other Gases Used
- 10.4. Market Analysis, Insights and Forecast - by End-user Industry
- 10.4.1. Oil and Gas
- 10.4.2. Energy and Power
- 10.4.3. Food and Beverages
- 10.4.4. Marine and Areospace
- 10.4.5. Chemical and Healthcare
- 10.4.6. Other End-user Industries
- 10.1. Market Analysis, Insights and Forecast - by Equipment
- 11. Middle East and Africa Cryogenic Equipment Market Analysis, Insights and Forecast, 2020-2032
- 11.1. Market Analysis, Insights and Forecast - by Equipment
- 11.1.1. Tanks
- 11.1.2. Pumps
- 11.1.3. Heat Exchanger
- 11.1.4. Valves
- 11.1.5. Other Equipment
- 11.2. Market Analysis, Insights and Forecast - by Application
- 11.2.1. Storage
- 11.2.2. Transportation and Distribution
- 11.2.3. Processing
- 11.2.4. Other Applications
- 11.3. Market Analysis, Insights and Forecast - by Gas Used
- 11.3.1. Liquified Nitrogen
- 11.3.2. Liquified Helium
- 11.3.3. Other Gases Used
- 11.4. Market Analysis, Insights and Forecast - by End-user Industry
- 11.4.1. Oil and Gas
- 11.4.2. Energy and Power
- 11.4.3. Food and Beverages
- 11.4.4. Marine and Areospace
- 11.4.5. Chemical and Healthcare
- 11.4.6. Other End-user Industries
- 11.1. Market Analysis, Insights and Forecast - by Equipment
- 12. Competitive Analysis
- 12.1. Company Profiles
- 12.1.1 Linde PLC
- 12.1.1.1. Company Overview
- 12.1.1.2. Products
- 12.1.1.3. Company Financials
- 12.1.1.4. SWOT Analysis
- 12.1.2 Honeywell International Inc
- 12.1.2.1. Company Overview
- 12.1.2.2. Products
- 12.1.2.3. Company Financials
- 12.1.2.4. SWOT Analysis
- 12.1.3 Flowserve Corp
- 12.1.3.1. Company Overview
- 12.1.3.2. Products
- 12.1.3.3. Company Financials
- 12.1.3.4. SWOT Analysis
- 12.1.4 Cryofab Inc
- 12.1.4.1. Company Overview
- 12.1.4.2. Products
- 12.1.4.3. Company Financials
- 12.1.4.4. SWOT Analysis
- 12.1.5 HEROSE GmbH
- 12.1.5.1. Company Overview
- 12.1.5.2. Products
- 12.1.5.3. Company Financials
- 12.1.5.4. SWOT Analysis
- 12.1.6 Emerson Electric Co
- 12.1.6.1. Company Overview
- 12.1.6.2. Products
- 12.1.6.3. Company Financials
- 12.1.6.4. SWOT Analysis
- 12.1.7 Chart Industries Inc
- 12.1.7.1. Company Overview
- 12.1.7.2. Products
- 12.1.7.3. Company Financials
- 12.1.7.4. SWOT Analysis
- 12.1.8 McDermott International Inc
- 12.1.8.1. Company Overview
- 12.1.8.2. Products
- 12.1.8.3. Company Financials
- 12.1.8.4. SWOT Analysis
- 12.1.9 Sumitomo Heavy Industries Ltd
- 12.1.9.1. Company Overview
- 12.1.9.2. Products
- 12.1.9.3. Company Financials
- 12.1.9.4. SWOT Analysis
- 12.1.10 Beijing Tianhai Industry Co Ltd
- 12.1.10.1. Company Overview
- 12.1.10.2. Products
- 12.1.10.3. Company Financials
- 12.1.10.4. SWOT Analysis
- 12.1.1 Linde PLC
- 12.2. Market Entropy
- 12.2.1 Company's Key Areas Served
- 12.2.2 Recent Developments
- 12.3. Company Market Share Analysis 2025
- 12.3.1 Top 5 Companies Market Share Analysis
- 12.3.2 Top 3 Companies Market Share Analysis
- 12.4. List of Potential Customers
- 13. Research Methodology
List of Figures
- Figure 1: Global Cryogenic Equipment Market Revenue Breakdown (billion, %) by Region 2025 & 2033
- Figure 2: Global Cryogenic Equipment Market Volume Breakdown (K Unit, %) by Region 2025 & 2033
- Figure 3: North America Cryogenic Equipment Market Revenue (billion), by Equipment 2025 & 2033
- Figure 4: North America Cryogenic Equipment Market Volume (K Unit), by Equipment 2025 & 2033
- Figure 5: North America Cryogenic Equipment Market Revenue Share (%), by Equipment 2025 & 2033
- Figure 6: North America Cryogenic Equipment Market Volume Share (%), by Equipment 2025 & 2033
- Figure 7: North America Cryogenic Equipment Market Revenue (billion), by Application 2025 & 2033
- Figure 8: North America Cryogenic Equipment Market Volume (K Unit), by Application 2025 & 2033
- Figure 9: North America Cryogenic Equipment Market Revenue Share (%), by Application 2025 & 2033
- Figure 10: North America Cryogenic Equipment Market Volume Share (%), by Application 2025 & 2033
- Figure 11: North America Cryogenic Equipment Market Revenue (billion), by Gas Used 2025 & 2033
- Figure 12: North America Cryogenic Equipment Market Volume (K Unit), by Gas Used 2025 & 2033
- Figure 13: North America Cryogenic Equipment Market Revenue Share (%), by Gas Used 2025 & 2033
- Figure 14: North America Cryogenic Equipment Market Volume Share (%), by Gas Used 2025 & 2033
- Figure 15: North America Cryogenic Equipment Market Revenue (billion), by End-user Industry 2025 & 2033
- Figure 16: North America Cryogenic Equipment Market Volume (K Unit), by End-user Industry 2025 & 2033
- Figure 17: North America Cryogenic Equipment Market Revenue Share (%), by End-user Industry 2025 & 2033
- Figure 18: North America Cryogenic Equipment Market Volume Share (%), by End-user Industry 2025 & 2033
- Figure 19: North America Cryogenic Equipment Market Revenue (billion), by Country 2025 & 2033
- Figure 20: North America Cryogenic Equipment Market Volume (K Unit), by Country 2025 & 2033
- Figure 21: North America Cryogenic Equipment Market Revenue Share (%), by Country 2025 & 2033
- Figure 22: North America Cryogenic Equipment Market Volume Share (%), by Country 2025 & 2033
- Figure 23: Europe Cryogenic Equipment Market Revenue (billion), by Equipment 2025 & 2033
- Figure 24: Europe Cryogenic Equipment Market Volume (K Unit), by Equipment 2025 & 2033
- Figure 25: Europe Cryogenic Equipment Market Revenue Share (%), by Equipment 2025 & 2033
- Figure 26: Europe Cryogenic Equipment Market Volume Share (%), by Equipment 2025 & 2033
- Figure 27: Europe Cryogenic Equipment Market Revenue (billion), by Application 2025 & 2033
- Figure 28: Europe Cryogenic Equipment Market Volume (K Unit), by Application 2025 & 2033
- Figure 29: Europe Cryogenic Equipment Market Revenue Share (%), by Application 2025 & 2033
- Figure 30: Europe Cryogenic Equipment Market Volume Share (%), by Application 2025 & 2033
- Figure 31: Europe Cryogenic Equipment Market Revenue (billion), by Gas Used 2025 & 2033
- Figure 32: Europe Cryogenic Equipment Market Volume (K Unit), by Gas Used 2025 & 2033
- Figure 33: Europe Cryogenic Equipment Market Revenue Share (%), by Gas Used 2025 & 2033
- Figure 34: Europe Cryogenic Equipment Market Volume Share (%), by Gas Used 2025 & 2033
- Figure 35: Europe Cryogenic Equipment Market Revenue (billion), by End-user Industry 2025 & 2033
- Figure 36: Europe Cryogenic Equipment Market Volume (K Unit), by End-user Industry 2025 & 2033
- Figure 37: Europe Cryogenic Equipment Market Revenue Share (%), by End-user Industry 2025 & 2033
- Figure 38: Europe Cryogenic Equipment Market Volume Share (%), by End-user Industry 2025 & 2033
- Figure 39: Europe Cryogenic Equipment Market Revenue (billion), by Country 2025 & 2033
- Figure 40: Europe Cryogenic Equipment Market Volume (K Unit), by Country 2025 & 2033
- Figure 41: Europe Cryogenic Equipment Market Revenue Share (%), by Country 2025 & 2033
- Figure 42: Europe Cryogenic Equipment Market Volume Share (%), by Country 2025 & 2033
- Figure 43: Asia Pacific Cryogenic Equipment Market Revenue (billion), by Equipment 2025 & 2033
- Figure 44: Asia Pacific Cryogenic Equipment Market Volume (K Unit), by Equipment 2025 & 2033
- Figure 45: Asia Pacific Cryogenic Equipment Market Revenue Share (%), by Equipment 2025 & 2033
- Figure 46: Asia Pacific Cryogenic Equipment Market Volume Share (%), by Equipment 2025 & 2033
- Figure 47: Asia Pacific Cryogenic Equipment Market Revenue (billion), by Application 2025 & 2033
- Figure 48: Asia Pacific Cryogenic Equipment Market Volume (K Unit), by Application 2025 & 2033
- Figure 49: Asia Pacific Cryogenic Equipment Market Revenue Share (%), by Application 2025 & 2033
- Figure 50: Asia Pacific Cryogenic Equipment Market Volume Share (%), by Application 2025 & 2033
- Figure 51: Asia Pacific Cryogenic Equipment Market Revenue (billion), by Gas Used 2025 & 2033
- Figure 52: Asia Pacific Cryogenic Equipment Market Volume (K Unit), by Gas Used 2025 & 2033
- Figure 53: Asia Pacific Cryogenic Equipment Market Revenue Share (%), by Gas Used 2025 & 2033
- Figure 54: Asia Pacific Cryogenic Equipment Market Volume Share (%), by Gas Used 2025 & 2033
- Figure 55: Asia Pacific Cryogenic Equipment Market Revenue (billion), by End-user Industry 2025 & 2033
- Figure 56: Asia Pacific Cryogenic Equipment Market Volume (K Unit), by End-user Industry 2025 & 2033
- Figure 57: Asia Pacific Cryogenic Equipment Market Revenue Share (%), by End-user Industry 2025 & 2033
- Figure 58: Asia Pacific Cryogenic Equipment Market Volume Share (%), by End-user Industry 2025 & 2033
- Figure 59: Asia Pacific Cryogenic Equipment Market Revenue (billion), by Country 2025 & 2033
- Figure 60: Asia Pacific Cryogenic Equipment Market Volume (K Unit), by Country 2025 & 2033
- Figure 61: Asia Pacific Cryogenic Equipment Market Revenue Share (%), by Country 2025 & 2033
- Figure 62: Asia Pacific Cryogenic Equipment Market Volume Share (%), by Country 2025 & 2033
- Figure 63: South America Cryogenic Equipment Market Revenue (billion), by Equipment 2025 & 2033
- Figure 64: South America Cryogenic Equipment Market Volume (K Unit), by Equipment 2025 & 2033
- Figure 65: South America Cryogenic Equipment Market Revenue Share (%), by Equipment 2025 & 2033
- Figure 66: South America Cryogenic Equipment Market Volume Share (%), by Equipment 2025 & 2033
- Figure 67: South America Cryogenic Equipment Market Revenue (billion), by Application 2025 & 2033
- Figure 68: South America Cryogenic Equipment Market Volume (K Unit), by Application 2025 & 2033
- Figure 69: South America Cryogenic Equipment Market Revenue Share (%), by Application 2025 & 2033
- Figure 70: South America Cryogenic Equipment Market Volume Share (%), by Application 2025 & 2033
- Figure 71: South America Cryogenic Equipment Market Revenue (billion), by Gas Used 2025 & 2033
- Figure 72: South America Cryogenic Equipment Market Volume (K Unit), by Gas Used 2025 & 2033
- Figure 73: South America Cryogenic Equipment Market Revenue Share (%), by Gas Used 2025 & 2033
- Figure 74: South America Cryogenic Equipment Market Volume Share (%), by Gas Used 2025 & 2033
- Figure 75: South America Cryogenic Equipment Market Revenue (billion), by End-user Industry 2025 & 2033
- Figure 76: South America Cryogenic Equipment Market Volume (K Unit), by End-user Industry 2025 & 2033
- Figure 77: South America Cryogenic Equipment Market Revenue Share (%), by End-user Industry 2025 & 2033
- Figure 78: South America Cryogenic Equipment Market Volume Share (%), by End-user Industry 2025 & 2033
- Figure 79: South America Cryogenic Equipment Market Revenue (billion), by Country 2025 & 2033
- Figure 80: South America Cryogenic Equipment Market Volume (K Unit), by Country 2025 & 2033
- Figure 81: South America Cryogenic Equipment Market Revenue Share (%), by Country 2025 & 2033
- Figure 82: South America Cryogenic Equipment Market Volume Share (%), by Country 2025 & 2033
- Figure 83: Middle East and Africa Cryogenic Equipment Market Revenue (billion), by Equipment 2025 & 2033
- Figure 84: Middle East and Africa Cryogenic Equipment Market Volume (K Unit), by Equipment 2025 & 2033
- Figure 85: Middle East and Africa Cryogenic Equipment Market Revenue Share (%), by Equipment 2025 & 2033
- Figure 86: Middle East and Africa Cryogenic Equipment Market Volume Share (%), by Equipment 2025 & 2033
- Figure 87: Middle East and Africa Cryogenic Equipment Market Revenue (billion), by Application 2025 & 2033
- Figure 88: Middle East and Africa Cryogenic Equipment Market Volume (K Unit), by Application 2025 & 2033
- Figure 89: Middle East and Africa Cryogenic Equipment Market Revenue Share (%), by Application 2025 & 2033
- Figure 90: Middle East and Africa Cryogenic Equipment Market Volume Share (%), by Application 2025 & 2033
- Figure 91: Middle East and Africa Cryogenic Equipment Market Revenue (billion), by Gas Used 2025 & 2033
- Figure 92: Middle East and Africa Cryogenic Equipment Market Volume (K Unit), by Gas Used 2025 & 2033
- Figure 93: Middle East and Africa Cryogenic Equipment Market Revenue Share (%), by Gas Used 2025 & 2033
- Figure 94: Middle East and Africa Cryogenic Equipment Market Volume Share (%), by Gas Used 2025 & 2033
- Figure 95: Middle East and Africa Cryogenic Equipment Market Revenue (billion), by End-user Industry 2025 & 2033
- Figure 96: Middle East and Africa Cryogenic Equipment Market Volume (K Unit), by End-user Industry 2025 & 2033
- Figure 97: Middle East and Africa Cryogenic Equipment Market Revenue Share (%), by End-user Industry 2025 & 2033
- Figure 98: Middle East and Africa Cryogenic Equipment Market Volume Share (%), by End-user Industry 2025 & 2033
- Figure 99: Middle East and Africa Cryogenic Equipment Market Revenue (billion), by Country 2025 & 2033
- Figure 100: Middle East and Africa Cryogenic Equipment Market Volume (K Unit), by Country 2025 & 2033
- Figure 101: Middle East and Africa Cryogenic Equipment Market Revenue Share (%), by Country 2025 & 2033
- Figure 102: Middle East and Africa Cryogenic Equipment Market Volume Share (%), by Country 2025 & 2033
List of Tables
- Table 1: Global Cryogenic Equipment Market Revenue billion Forecast, by Equipment 2020 & 2033
- Table 2: Global Cryogenic Equipment Market Volume K Unit Forecast, by Equipment 2020 & 2033
- Table 3: Global Cryogenic Equipment Market Revenue billion Forecast, by Application 2020 & 2033
- Table 4: Global Cryogenic Equipment Market Volume K Unit Forecast, by Application 2020 & 2033
- Table 5: Global Cryogenic Equipment Market Revenue billion Forecast, by Gas Used 2020 & 2033
- Table 6: Global Cryogenic Equipment Market Volume K Unit Forecast, by Gas Used 2020 & 2033
- Table 7: Global Cryogenic Equipment Market Revenue billion Forecast, by End-user Industry 2020 & 2033
- Table 8: Global Cryogenic Equipment Market Volume K Unit Forecast, by End-user Industry 2020 & 2033
- Table 9: Global Cryogenic Equipment Market Revenue billion Forecast, by Region 2020 & 2033
- Table 10: Global Cryogenic Equipment Market Volume K Unit Forecast, by Region 2020 & 2033
- Table 11: Global Cryogenic Equipment Market Revenue billion Forecast, by Equipment 2020 & 2033
- Table 12: Global Cryogenic Equipment Market Volume K Unit Forecast, by Equipment 2020 & 2033
- Table 13: Global Cryogenic Equipment Market Revenue billion Forecast, by Application 2020 & 2033
- Table 14: Global Cryogenic Equipment Market Volume K Unit Forecast, by Application 2020 & 2033
- Table 15: Global Cryogenic Equipment Market Revenue billion Forecast, by Gas Used 2020 & 2033
- Table 16: Global Cryogenic Equipment Market Volume K Unit Forecast, by Gas Used 2020 & 2033
- Table 17: Global Cryogenic Equipment Market Revenue billion Forecast, by End-user Industry 2020 & 2033
- Table 18: Global Cryogenic Equipment Market Volume K Unit Forecast, by End-user Industry 2020 & 2033
- Table 19: Global Cryogenic Equipment Market Revenue billion Forecast, by Country 2020 & 2033
- Table 20: Global Cryogenic Equipment Market Volume K Unit Forecast, by Country 2020 & 2033
- Table 21: Global Cryogenic Equipment Market Revenue billion Forecast, by Equipment 2020 & 2033
- Table 22: Global Cryogenic Equipment Market Volume K Unit Forecast, by Equipment 2020 & 2033
- Table 23: Global Cryogenic Equipment Market Revenue billion Forecast, by Application 2020 & 2033
- Table 24: Global Cryogenic Equipment Market Volume K Unit Forecast, by Application 2020 & 2033
- Table 25: Global Cryogenic Equipment Market Revenue billion Forecast, by Gas Used 2020 & 2033
- Table 26: Global Cryogenic Equipment Market Volume K Unit Forecast, by Gas Used 2020 & 2033
- Table 27: Global Cryogenic Equipment Market Revenue billion Forecast, by End-user Industry 2020 & 2033
- Table 28: Global Cryogenic Equipment Market Volume K Unit Forecast, by End-user Industry 2020 & 2033
- Table 29: Global Cryogenic Equipment Market Revenue billion Forecast, by Country 2020 & 2033
- Table 30: Global Cryogenic Equipment Market Volume K Unit Forecast, by Country 2020 & 2033
- Table 31: Global Cryogenic Equipment Market Revenue billion Forecast, by Equipment 2020 & 2033
- Table 32: Global Cryogenic Equipment Market Volume K Unit Forecast, by Equipment 2020 & 2033
- Table 33: Global Cryogenic Equipment Market Revenue billion Forecast, by Application 2020 & 2033
- Table 34: Global Cryogenic Equipment Market Volume K Unit Forecast, by Application 2020 & 2033
- Table 35: Global Cryogenic Equipment Market Revenue billion Forecast, by Gas Used 2020 & 2033
- Table 36: Global Cryogenic Equipment Market Volume K Unit Forecast, by Gas Used 2020 & 2033
- Table 37: Global Cryogenic Equipment Market Revenue billion Forecast, by End-user Industry 2020 & 2033
- Table 38: Global Cryogenic Equipment Market Volume K Unit Forecast, by End-user Industry 2020 & 2033
- Table 39: Global Cryogenic Equipment Market Revenue billion Forecast, by Country 2020 & 2033
- Table 40: Global Cryogenic Equipment Market Volume K Unit Forecast, by Country 2020 & 2033
- Table 41: Global Cryogenic Equipment Market Revenue billion Forecast, by Equipment 2020 & 2033
- Table 42: Global Cryogenic Equipment Market Volume K Unit Forecast, by Equipment 2020 & 2033
- Table 43: Global Cryogenic Equipment Market Revenue billion Forecast, by Application 2020 & 2033
- Table 44: Global Cryogenic Equipment Market Volume K Unit Forecast, by Application 2020 & 2033
- Table 45: Global Cryogenic Equipment Market Revenue billion Forecast, by Gas Used 2020 & 2033
- Table 46: Global Cryogenic Equipment Market Volume K Unit Forecast, by Gas Used 2020 & 2033
- Table 47: Global Cryogenic Equipment Market Revenue billion Forecast, by End-user Industry 2020 & 2033
- Table 48: Global Cryogenic Equipment Market Volume K Unit Forecast, by End-user Industry 2020 & 2033
- Table 49: Global Cryogenic Equipment Market Revenue billion Forecast, by Country 2020 & 2033
- Table 50: Global Cryogenic Equipment Market Volume K Unit Forecast, by Country 2020 & 2033
- Table 51: Global Cryogenic Equipment Market Revenue billion Forecast, by Equipment 2020 & 2033
- Table 52: Global Cryogenic Equipment Market Volume K Unit Forecast, by Equipment 2020 & 2033
- Table 53: Global Cryogenic Equipment Market Revenue billion Forecast, by Application 2020 & 2033
- Table 54: Global Cryogenic Equipment Market Volume K Unit Forecast, by Application 2020 & 2033
- Table 55: Global Cryogenic Equipment Market Revenue billion Forecast, by Gas Used 2020 & 2033
- Table 56: Global Cryogenic Equipment Market Volume K Unit Forecast, by Gas Used 2020 & 2033
- Table 57: Global Cryogenic Equipment Market Revenue billion Forecast, by End-user Industry 2020 & 2033
- Table 58: Global Cryogenic Equipment Market Volume K Unit Forecast, by End-user Industry 2020 & 2033
- Table 59: Global Cryogenic Equipment Market Revenue billion Forecast, by Country 2020 & 2033
- Table 60: Global Cryogenic Equipment Market Volume K Unit Forecast, by Country 2020 & 2033
Frequently Asked Questions
1. What is the projected Compound Annual Growth Rate (CAGR) of the Cryogenic Equipment Market?
The projected CAGR is approximately 6.8%.
2. Which companies are prominent players in the Cryogenic Equipment Market?
Key companies in the market include Linde PLC, Honeywell International Inc, Flowserve Corp, Cryofab Inc, HEROSE GmbH, Emerson Electric Co, Chart Industries Inc, McDermott International Inc, Sumitomo Heavy Industries Ltd, Beijing Tianhai Industry Co Ltd.
3. What are the main segments of the Cryogenic Equipment Market?
The market segments include Equipment, Application, Gas Used, End-user Industry.
4. Can you provide details about the market size?
The market size is estimated to be USD 26.6 billion as of 2022.
5. What are some drivers contributing to market growth?
4.; Increasing Demand for Liquefied Natural Gas (LNG).
6. What are the notable trends driving market growth?
Tanks Segment Expected to Experience Significant Market Growth.
7. Are there any restraints impacting market growth?
4.; High Operational and Maintenance Costs.
8. Can you provide examples of recent developments in the market?
In January 2022, Saulsbury was awarded the EPC contract for the design and installation of two cryogenic processing facilities in the Midland Basin. The facilities, designed with a base-rated capacity of 200 million standard cubic feet per day (MMSCFD) each, mark Saulsbury's 61st and 62nd cryogenic processing facility projects since 2006, representing nearly 11 billion cubic feet per day (BCFD) of processing capacity, and its 23rd and 24th cryogenic processing facility in the West Texas region.
9. What pricing options are available for accessing the report?
Pricing options include single-user, multi-user, and enterprise licenses priced at USD 4750, USD 5250, and USD 8750 respectively.
10. Is the market size provided in terms of value or volume?
The market size is provided in terms of value, measured in billion and volume, measured in K Unit.
11. Are there any specific market keywords associated with the report?
Yes, the market keyword associated with the report is "Cryogenic Equipment Market," which aids in identifying and referencing the specific market segment covered.
12. How do I determine which pricing option suits my needs best?
The pricing options vary based on user requirements and access needs. Individual users may opt for single-user licenses, while businesses requiring broader access may choose multi-user or enterprise licenses for cost-effective access to the report.
13. Are there any additional resources or data provided in the Cryogenic Equipment Market report?
While the report offers comprehensive insights, it's advisable to review the specific contents or supplementary materials provided to ascertain if additional resources or data are available.
14. How can I stay updated on further developments or reports in the Cryogenic Equipment Market?
To stay informed about further developments, trends, and reports in the Cryogenic Equipment Market, consider subscribing to industry newsletters, following relevant companies and organizations, or regularly checking reputable industry news sources and publications.
Methodology
Step 1 - Identification of Relevant Samples Size from Population Database


Step 2 - Approaches for Defining Global Market Size (Value, Volume* & Price*)

Note*: In applicable scenarios
Step 3 - Data Sources
Primary Research
- Web Analytics
- Survey Reports
- Research Institute
- Latest Research Reports
- Opinion Leaders
Secondary Research
- Annual Reports
- White Paper
- Latest Press Release
- Industry Association
- Paid Database
- Investor Presentations

Step 4 - Data Triangulation
Involves using different sources of information in order to increase the validity of a study
These sources are likely to be stakeholders in a program - participants, other researchers, program staff, other community members, and so on.
Then we put all data in single framework & apply various statistical tools to find out the dynamic on the market.
During the analysis stage, feedback from the stakeholder groups would be compared to determine areas of agreement as well as areas of divergence