Key Insights
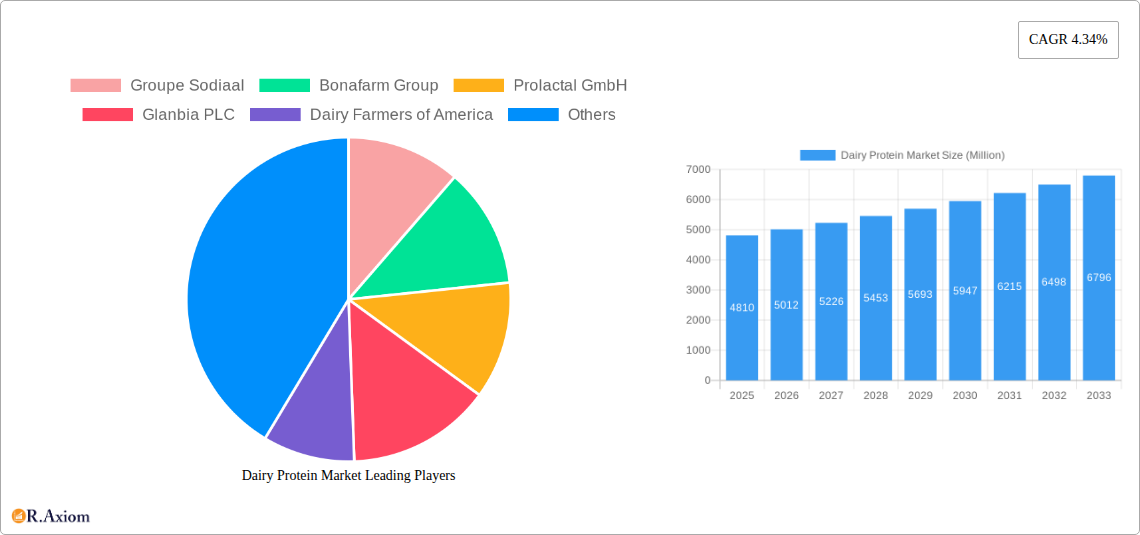
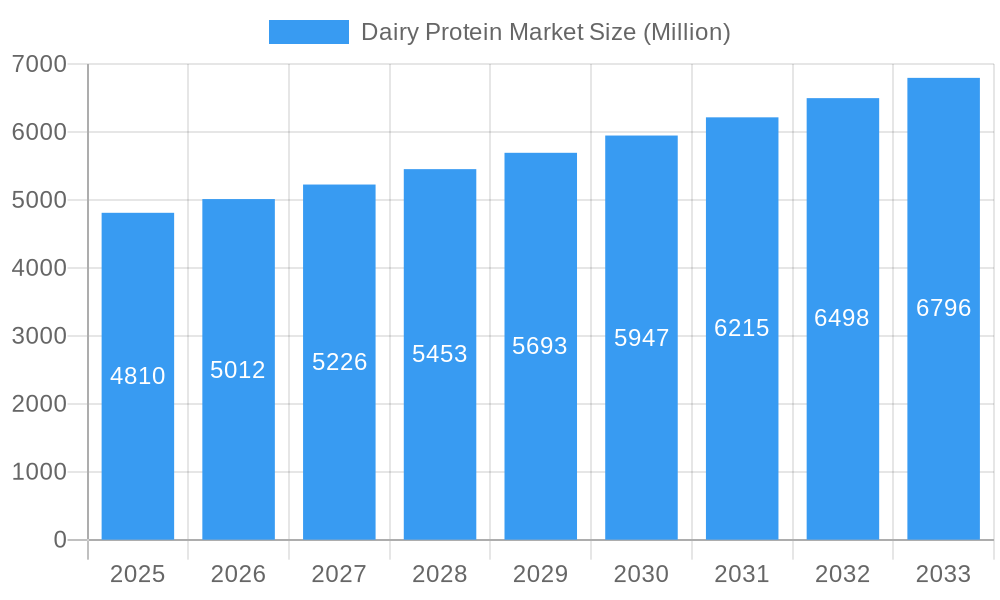
The global dairy protein market, valued at $4.81 billion in 2025, is projected to experience robust growth, driven by a compound annual growth rate (CAGR) of 4.34% from 2025 to 2033. This expansion is fueled by several key factors. The increasing demand for protein-rich foods and supplements, particularly within the sports nutrition and functional food sectors, significantly boosts market growth. Consumers are increasingly health-conscious and seek convenient ways to incorporate protein into their diets, leading to higher demand for dairy-based protein sources like whey and casein. Furthermore, the expanding infant formula market and the growing use of dairy proteins in animal feed contribute to the market's overall growth trajectory. Technological advancements in protein extraction and processing are also improving the quality and efficiency of dairy protein production, making it a more cost-effective ingredient for various applications. Regional variations exist, with North America and Europe currently dominating the market due to high per capita consumption of dairy products and established health and wellness industries. However, the Asia-Pacific region is expected to show significant growth potential in the coming years, driven by rising disposable incomes and a growing awareness of the health benefits of protein-rich diets.
Dairy Protein Market Market Size (In Billion)
Despite the positive outlook, the market faces certain challenges. Fluctuations in milk prices and supply chain disruptions can impact profitability and stability within the industry. Moreover, the increasing popularity of plant-based protein alternatives presents competition, although dairy protein maintains a significant advantage in terms of nutritional profile and established consumer preference. Regulatory changes regarding food labeling and additives also require manufacturers to adapt and ensure compliance. To capitalize on future opportunities, companies must focus on product innovation, particularly in developing functional dairy protein ingredients for niche markets, and emphasize sustainable sourcing practices to address growing environmental concerns. Furthermore, targeted marketing campaigns highlighting the nutritional benefits of dairy protein compared to alternatives will be crucial in maintaining market share and driving continued growth.
Dairy Protein Market Company Market Share
Dairy Protein Market: A Comprehensive Report (2019-2033)
This in-depth report provides a comprehensive analysis of the Dairy Protein Market, covering historical performance (2019-2024), the current state (2025), and future projections (2025-2033). It offers actionable insights for industry stakeholders, including manufacturers, suppliers, distributors, and investors. The report utilizes a robust methodology, incorporating extensive primary and secondary research to deliver a precise and reliable market assessment. The total market size is predicted to reach xx Million by 2033, showcasing significant growth potential.
Dairy Protein Market Concentration & Innovation
This section analyzes the competitive landscape of the dairy protein market, evaluating market concentration, innovation drivers, regulatory influences, and industry dynamics. The market exhibits a moderately concentrated structure with several major players holding significant market share. Key metrics such as market share and M&A deal values are analyzed to understand the competitive intensity and strategic positioning of various companies.
Market Concentration: The top five players account for approximately xx% of the global market share in 2025, indicating a consolidated yet competitive environment. This concentration is driven by economies of scale and established brand recognition.
Innovation Drivers: Continuous innovation in dairy processing technologies, including membrane filtration and enzymatic hydrolysis, is driving the development of high-quality, functional dairy proteins. The demand for clean-label ingredients and specific functional properties fuels further innovation.
Regulatory Frameworks: Stringent food safety regulations and labeling requirements across various regions impact the market, necessitating compliance and potentially influencing production costs.
Product Substitutes: Plant-based protein alternatives pose a competitive threat, particularly in the sports nutrition and functional food segments. However, the unique nutritional profile of dairy proteins, including essential amino acids, continues to support strong market demand.
End-User Trends: Growing awareness of the health benefits of dairy proteins, particularly among health-conscious consumers, is driving demand in various applications such as sports nutrition, functional foods, and infant formulations.
M&A Activities: Recent M&A activities, including Glanbia's acquisition of Sterling Technology in 2022 for USD 60 Million (plus deferred consideration), illustrate strategic consolidation and expansion within the industry. These acquisitions enhance product portfolios and market reach.
Dairy Protein Market Industry Trends & Insights
This section delves into the key trends and insights shaping the dairy protein market. We analyze growth drivers, technological disruptions, evolving consumer preferences, and the competitive dynamics influencing market expansion.
The global dairy protein market is experiencing robust growth, driven by several factors. Increasing consumer demand for high-protein diets, coupled with the growing popularity of functional foods and dietary supplements, are major contributors. The rising prevalence of health conditions requiring specific nutritional management also fuels market growth. Technological advancements in dairy processing contribute to improved efficiency, enhanced product quality, and the development of innovative formulations. The market's CAGR during the forecast period (2025-2033) is estimated at xx%. Market penetration of dairy proteins in various applications is also expanding steadily, with substantial growth opportunities expected in emerging markets. Competitive dynamics are marked by a blend of innovation, strategic partnerships, and consolidation through mergers and acquisitions. Consumer preferences are shifting toward clean-label, sustainable, and ethically sourced dairy products, putting pressure on producers to adopt more responsible and transparent practices.
Dominant Markets & Segments in Dairy Protein Market
This section identifies the leading regions, countries, and segments within the dairy protein market. We analyze key drivers for dominance in each segment.
Leading Regions/Countries: North America and Europe currently hold significant market shares due to high consumer awareness and established markets. However, Asia-Pacific is projected to witness the fastest growth owing to its rising population, increasing disposable incomes, and expanding health-conscious consumer base.
Dominant Ingredients:
- Whey Protein Concentrates (WPCs): High demand in the sports nutrition and food industries due to their cost-effectiveness and good protein content.
- Whey Protein Isolates (WPIs): Premium segment with high purity and excellent functionality, making them ideal for specialized applications.
- Casein and Caseinates: Significant demand from the infant formula and cheese industries.
Dominant Applications:
- Sports Nutrition: High-protein demand from athletes and fitness enthusiasts driving this segment's growth.
- Infant Formulations: Essential for infant development, with stringent quality standards.
- Functional Food & Dietary Supplements: Dairy proteins are added to enhance nutritional value and deliver health benefits.
Key Drivers (Examples):
- North America: High disposable income, health-conscious population, and established sports nutrition industry.
- Europe: Strict regulatory environment, advanced dairy processing technologies, and strong consumer demand for functional foods.
- Asia-Pacific: Rapid economic growth, rising middle class, and increasing awareness of health and wellness.
Dairy Protein Market Product Developments
Recent product innovations include the development of specialized dairy protein ingredients tailored to specific applications, such as hypoallergenic formulations for infants and high-performance whey protein blends for athletes. Technological advancements focus on improving protein functionality, enhancing digestibility, and developing sustainable production methods. These innovations contribute to enhanced product quality, improved market competitiveness, and better alignment with evolving consumer preferences. For instance, FrieslandCampina's increased lactoferrin production showcases a focus on high-value, specialized ingredients.
Report Scope & Segmentation Analysis
This report comprehensively segments the dairy protein market based on ingredient type (Milk Protein Concentrates (MPCs), Whey Protein Concentrates (WPCs), Whey Protein Isolates (WPIs), Milk Protein Isolates (MPIs), Casein and Caseinates, Other Ingredients) and application (Sports Nutrition, Infant formulations, Functional Food & Dietary supplement, Pharmaceutical, Animal Feed/Pet Food, Other Applications). Each segment's growth projections, market sizes, and competitive dynamics are analyzed, providing a granular understanding of market structure and opportunities. For example, the whey protein segment is anticipated to experience substantial growth due to its diverse applications and widespread consumer acceptance.
Key Drivers of Dairy Protein Market Growth
The dairy protein market is experiencing significant growth propelled by several key factors. The rising global population and increasing disposable incomes in emerging economies fuel demand for protein-rich foods. The growing awareness of the health benefits associated with dairy protein consumption, particularly its role in muscle building and overall wellness, further drives market expansion. Furthermore, technological advancements in dairy processing, improving efficiency and product quality, contribute to market growth. Government support for the dairy industry in various countries, along with favorable regulatory frameworks, also plays a positive role.
Challenges in the Dairy Protein Market Sector
Despite substantial growth prospects, the dairy protein market faces several challenges. Fluctuations in milk prices and raw material availability can significantly impact profitability and production costs. Strict regulatory requirements for food safety and labeling impose compliance burdens. The increasing competition from plant-based protein alternatives necessitates continuous innovation and product diversification to maintain market share. Furthermore, maintaining a consistent and sustainable supply chain, especially in light of climate change and global supply chain disruptions, is critical for market stability. These factors present significant challenges to market players, requiring strategic adaptations and resilience.
Emerging Opportunities in Dairy Protein Market
The dairy protein market presents several promising opportunities. The growing demand for clean-label, organic, and sustainably sourced dairy products offers a significant avenue for growth. Exploring niche applications, such as specialized medical nutrition and personalized nutrition products, presents opportunities for differentiation and premium pricing. Expanding into emerging markets, particularly in Asia-Pacific and Africa, offers significant untapped potential. Furthermore, innovations in dairy processing technologies will continue to drive the development of novel products with enhanced functionalities and nutritional profiles, further solidifying the market's growth trajectory.
Leading Players in the Dairy Protein Market Market
- Groupe Sodiaal
- Bonafarm Group
- Prolactal GmbH
- Glanbia PLC
- Dairy Farmers of America
- Royal FrieslandCampina NV
- Kerry Group
- Hoogwegt International BV
- Fonterra Co-operative Group Limited
- Groupe Lactalis
Key Developments in Dairy Protein Market Industry
March 2023: FrieslandCampina's inauguration of a new lactoferrin production facility in the Netherlands significantly expands its production capacity, strengthening its position in the infant formula and antiviral treatment markets.
June 2022: Fonterra's joint venture with Tillamook and Three Mile Canyon Farms to launch Pro-OptimaTM, a functional whey protein concentrate, expands its product portfolio and market reach in the US.
May 2022: Glanbia Nutritionals' acquisition of Sterling Technology demonstrates strategic expansion into bioactive dairy solutions, adding value to its product offerings.
Strategic Outlook for Dairy Protein Market Market
The dairy protein market is poised for sustained growth, driven by evolving consumer preferences, technological advancements, and expanding applications. The focus on functional ingredients, sustainable practices, and innovative product development will shape future market dynamics. Companies that effectively adapt to changing consumer needs and invest in research and development will be well-positioned to capture significant market share in the years to come. The market is expected to witness substantial growth in the coming years, driven by the factors discussed throughout this report.
Dairy Protein Market Segmentation
-
1. Product Type
- 1.1. Milk Protein Concentrates (MPCs)
- 1.2. Whey Protein Concentrates (WPCs)
- 1.3. Whey Protein Isolates (WPIs)
- 1.4. Milk Protein Isolates (MPIs)
- 1.5. Casein and Caseinates
- 1.6. Other Ingredients
-
2. Application
- 2.1. Sports Nutrition
- 2.2. Infant formulations
- 2.3. Functional Food and Beverages
- 2.4. Dietary Supplements
- 2.5. Animal Feed and Pet Food
- 2.6. Other Applications
Dairy Protein Market Segmentation By Geography
-
1. North America
- 1.1. United States
- 1.2. Canada
- 1.3. Mexico
- 1.4. Rest of North America
-
2. Europe
- 2.1. United Kingdom
- 2.2. Germany
- 2.3. France
- 2.4. Russia
- 2.5. Italy
- 2.6. Spain
- 2.7. Rest of Europe
-
3. Asia Pacific
- 3.1. India
- 3.2. China
- 3.3. Japan
- 3.4. Australia
- 3.5. Rest of Asia Pacific
-
4. South America
- 4.1. Brazil
- 4.2. Argentina
- 4.3. Rest of South America
- 5. Middle East
-
6. South Africa
- 6.1. Saudi Arabia
- 6.2. Rest of Middle East
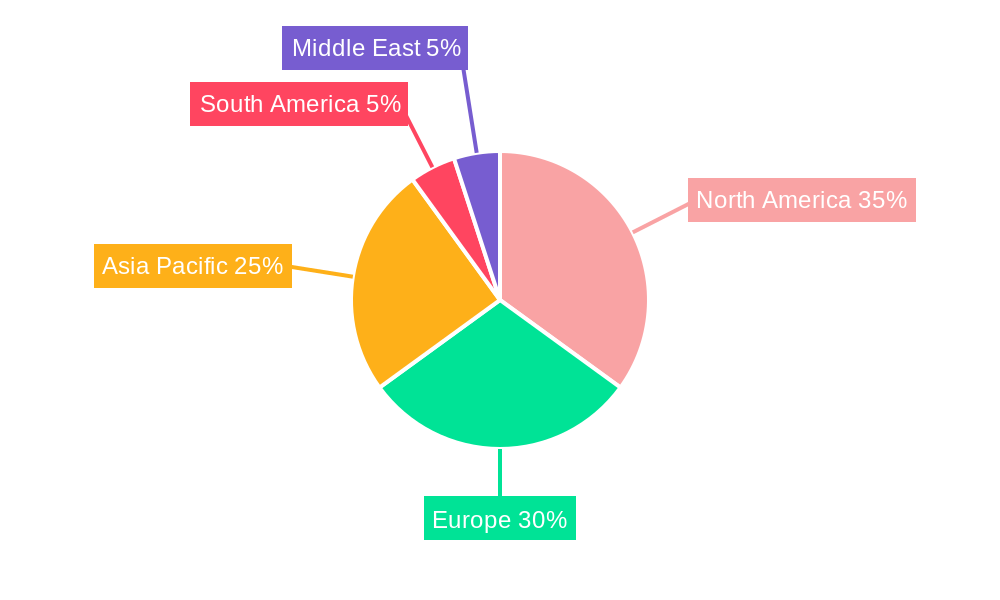
Dairy Protein Market Regional Market Share
Geographic Coverage of Dairy Protein Market
Dairy Protein Market REPORT HIGHLIGHTS
| Aspects | Details |
|---|---|
| Study Period | 2020-2034 |
| Base Year | 2025 |
| Estimated Year | 2026 |
| Forecast Period | 2026-2034 |
| Historical Period | 2020-2025 |
| Growth Rate | CAGR of 4.34% from 2020-2034 |
| Segmentation |
|
Table of Contents
- 1. Introduction
- 1.1. Research Scope
- 1.2. Market Segmentation
- 1.3. Research Methodology
- 1.4. Definitions and Assumptions
- 2. Executive Summary
- 2.1. Introduction
- 3. Market Dynamics
- 3.1. Introduction
- 3.2. Market Drivers
- 3.2.1. Increasing Demand for Protein Rich Food and Supplements; Increasing Application of Collagen in Personal Care Products
- 3.3. Market Restrains
- 3.3.1. Increasing Demand for Plant-Based Protein
- 3.4. Market Trends
- 3.4.1. Growing Awareness Towards Healthy Food
- 4. Market Factor Analysis
- 4.1. Porters Five Forces
- 4.2. Supply/Value Chain
- 4.3. PESTEL analysis
- 4.4. Market Entropy
- 4.5. Patent/Trademark Analysis
- 5. Global Dairy Protein Market Analysis, Insights and Forecast, 2020-2032
- 5.1. Market Analysis, Insights and Forecast - by Product Type
- 5.1.1. Milk Protein Concentrates (MPCs)
- 5.1.2. Whey Protein Concentrates (WPCs)
- 5.1.3. Whey Protein Isolates (WPIs)
- 5.1.4. Milk Protein Isolates (MPIs)
- 5.1.5. Casein and Caseinates
- 5.1.6. Other Ingredients
- 5.2. Market Analysis, Insights and Forecast - by Application
- 5.2.1. Sports Nutrition
- 5.2.2. Infant formulations
- 5.2.3. Functional Food and Beverages
- 5.2.4. Dietary Supplements
- 5.2.5. Animal Feed and Pet Food
- 5.2.6. Other Applications
- 5.3. Market Analysis, Insights and Forecast - by Region
- 5.3.1. North America
- 5.3.2. Europe
- 5.3.3. Asia Pacific
- 5.3.4. South America
- 5.3.5. Middle East
- 5.3.6. South Africa
- 5.1. Market Analysis, Insights and Forecast - by Product Type
- 6. North America Dairy Protein Market Analysis, Insights and Forecast, 2020-2032
- 6.1. Market Analysis, Insights and Forecast - by Product Type
- 6.1.1. Milk Protein Concentrates (MPCs)
- 6.1.2. Whey Protein Concentrates (WPCs)
- 6.1.3. Whey Protein Isolates (WPIs)
- 6.1.4. Milk Protein Isolates (MPIs)
- 6.1.5. Casein and Caseinates
- 6.1.6. Other Ingredients
- 6.2. Market Analysis, Insights and Forecast - by Application
- 6.2.1. Sports Nutrition
- 6.2.2. Infant formulations
- 6.2.3. Functional Food and Beverages
- 6.2.4. Dietary Supplements
- 6.2.5. Animal Feed and Pet Food
- 6.2.6. Other Applications
- 6.1. Market Analysis, Insights and Forecast - by Product Type
- 7. Europe Dairy Protein Market Analysis, Insights and Forecast, 2020-2032
- 7.1. Market Analysis, Insights and Forecast - by Product Type
- 7.1.1. Milk Protein Concentrates (MPCs)
- 7.1.2. Whey Protein Concentrates (WPCs)
- 7.1.3. Whey Protein Isolates (WPIs)
- 7.1.4. Milk Protein Isolates (MPIs)
- 7.1.5. Casein and Caseinates
- 7.1.6. Other Ingredients
- 7.2. Market Analysis, Insights and Forecast - by Application
- 7.2.1. Sports Nutrition
- 7.2.2. Infant formulations
- 7.2.3. Functional Food and Beverages
- 7.2.4. Dietary Supplements
- 7.2.5. Animal Feed and Pet Food
- 7.2.6. Other Applications
- 7.1. Market Analysis, Insights and Forecast - by Product Type
- 8. Asia Pacific Dairy Protein Market Analysis, Insights and Forecast, 2020-2032
- 8.1. Market Analysis, Insights and Forecast - by Product Type
- 8.1.1. Milk Protein Concentrates (MPCs)
- 8.1.2. Whey Protein Concentrates (WPCs)
- 8.1.3. Whey Protein Isolates (WPIs)
- 8.1.4. Milk Protein Isolates (MPIs)
- 8.1.5. Casein and Caseinates
- 8.1.6. Other Ingredients
- 8.2. Market Analysis, Insights and Forecast - by Application
- 8.2.1. Sports Nutrition
- 8.2.2. Infant formulations
- 8.2.3. Functional Food and Beverages
- 8.2.4. Dietary Supplements
- 8.2.5. Animal Feed and Pet Food
- 8.2.6. Other Applications
- 8.1. Market Analysis, Insights and Forecast - by Product Type
- 9. South America Dairy Protein Market Analysis, Insights and Forecast, 2020-2032
- 9.1. Market Analysis, Insights and Forecast - by Product Type
- 9.1.1. Milk Protein Concentrates (MPCs)
- 9.1.2. Whey Protein Concentrates (WPCs)
- 9.1.3. Whey Protein Isolates (WPIs)
- 9.1.4. Milk Protein Isolates (MPIs)
- 9.1.5. Casein and Caseinates
- 9.1.6. Other Ingredients
- 9.2. Market Analysis, Insights and Forecast - by Application
- 9.2.1. Sports Nutrition
- 9.2.2. Infant formulations
- 9.2.3. Functional Food and Beverages
- 9.2.4. Dietary Supplements
- 9.2.5. Animal Feed and Pet Food
- 9.2.6. Other Applications
- 9.1. Market Analysis, Insights and Forecast - by Product Type
- 10. Middle East Dairy Protein Market Analysis, Insights and Forecast, 2020-2032
- 10.1. Market Analysis, Insights and Forecast - by Product Type
- 10.1.1. Milk Protein Concentrates (MPCs)
- 10.1.2. Whey Protein Concentrates (WPCs)
- 10.1.3. Whey Protein Isolates (WPIs)
- 10.1.4. Milk Protein Isolates (MPIs)
- 10.1.5. Casein and Caseinates
- 10.1.6. Other Ingredients
- 10.2. Market Analysis, Insights and Forecast - by Application
- 10.2.1. Sports Nutrition
- 10.2.2. Infant formulations
- 10.2.3. Functional Food and Beverages
- 10.2.4. Dietary Supplements
- 10.2.5. Animal Feed and Pet Food
- 10.2.6. Other Applications
- 10.1. Market Analysis, Insights and Forecast - by Product Type
- 11. South Africa Dairy Protein Market Analysis, Insights and Forecast, 2020-2032
- 11.1. Market Analysis, Insights and Forecast - by Product Type
- 11.1.1. Milk Protein Concentrates (MPCs)
- 11.1.2. Whey Protein Concentrates (WPCs)
- 11.1.3. Whey Protein Isolates (WPIs)
- 11.1.4. Milk Protein Isolates (MPIs)
- 11.1.5. Casein and Caseinates
- 11.1.6. Other Ingredients
- 11.2. Market Analysis, Insights and Forecast - by Application
- 11.2.1. Sports Nutrition
- 11.2.2. Infant formulations
- 11.2.3. Functional Food and Beverages
- 11.2.4. Dietary Supplements
- 11.2.5. Animal Feed and Pet Food
- 11.2.6. Other Applications
- 11.1. Market Analysis, Insights and Forecast - by Product Type
- 12. Competitive Analysis
- 12.1. Global Market Share Analysis 2025
- 12.2. Company Profiles
- 12.2.1 Groupe Sodiaal
- 12.2.1.1. Overview
- 12.2.1.2. Products
- 12.2.1.3. SWOT Analysis
- 12.2.1.4. Recent Developments
- 12.2.1.5. Financials (Based on Availability)
- 12.2.2 Bonafarm Group
- 12.2.2.1. Overview
- 12.2.2.2. Products
- 12.2.2.3. SWOT Analysis
- 12.2.2.4. Recent Developments
- 12.2.2.5. Financials (Based on Availability)
- 12.2.3 Prolactal GmbH
- 12.2.3.1. Overview
- 12.2.3.2. Products
- 12.2.3.3. SWOT Analysis
- 12.2.3.4. Recent Developments
- 12.2.3.5. Financials (Based on Availability)
- 12.2.4 Glanbia PLC
- 12.2.4.1. Overview
- 12.2.4.2. Products
- 12.2.4.3. SWOT Analysis
- 12.2.4.4. Recent Developments
- 12.2.4.5. Financials (Based on Availability)
- 12.2.5 Dairy Farmers of America
- 12.2.5.1. Overview
- 12.2.5.2. Products
- 12.2.5.3. SWOT Analysis
- 12.2.5.4. Recent Developments
- 12.2.5.5. Financials (Based on Availability)
- 12.2.6 Royal FrieslandCampina NV
- 12.2.6.1. Overview
- 12.2.6.2. Products
- 12.2.6.3. SWOT Analysis
- 12.2.6.4. Recent Developments
- 12.2.6.5. Financials (Based on Availability)
- 12.2.7 Kerry Group
- 12.2.7.1. Overview
- 12.2.7.2. Products
- 12.2.7.3. SWOT Analysis
- 12.2.7.4. Recent Developments
- 12.2.7.5. Financials (Based on Availability)
- 12.2.8 Hoogwegt International BV*List Not Exhaustive
- 12.2.8.1. Overview
- 12.2.8.2. Products
- 12.2.8.3. SWOT Analysis
- 12.2.8.4. Recent Developments
- 12.2.8.5. Financials (Based on Availability)
- 12.2.9 Fonterra Co-operative Group Limited
- 12.2.9.1. Overview
- 12.2.9.2. Products
- 12.2.9.3. SWOT Analysis
- 12.2.9.4. Recent Developments
- 12.2.9.5. Financials (Based on Availability)
- 12.2.10 Groupe Lactalis
- 12.2.10.1. Overview
- 12.2.10.2. Products
- 12.2.10.3. SWOT Analysis
- 12.2.10.4. Recent Developments
- 12.2.10.5. Financials (Based on Availability)
- 12.2.1 Groupe Sodiaal
List of Figures
- Figure 1: Global Dairy Protein Market Revenue Breakdown (Million, %) by Region 2025 & 2033
- Figure 2: Global Dairy Protein Market Volume Breakdown (K Units, %) by Region 2025 & 2033
- Figure 3: North America Dairy Protein Market Revenue (Million), by Product Type 2025 & 2033
- Figure 4: North America Dairy Protein Market Volume (K Units), by Product Type 2025 & 2033
- Figure 5: North America Dairy Protein Market Revenue Share (%), by Product Type 2025 & 2033
- Figure 6: North America Dairy Protein Market Volume Share (%), by Product Type 2025 & 2033
- Figure 7: North America Dairy Protein Market Revenue (Million), by Application 2025 & 2033
- Figure 8: North America Dairy Protein Market Volume (K Units), by Application 2025 & 2033
- Figure 9: North America Dairy Protein Market Revenue Share (%), by Application 2025 & 2033
- Figure 10: North America Dairy Protein Market Volume Share (%), by Application 2025 & 2033
- Figure 11: North America Dairy Protein Market Revenue (Million), by Country 2025 & 2033
- Figure 12: North America Dairy Protein Market Volume (K Units), by Country 2025 & 2033
- Figure 13: North America Dairy Protein Market Revenue Share (%), by Country 2025 & 2033
- Figure 14: North America Dairy Protein Market Volume Share (%), by Country 2025 & 2033
- Figure 15: Europe Dairy Protein Market Revenue (Million), by Product Type 2025 & 2033
- Figure 16: Europe Dairy Protein Market Volume (K Units), by Product Type 2025 & 2033
- Figure 17: Europe Dairy Protein Market Revenue Share (%), by Product Type 2025 & 2033
- Figure 18: Europe Dairy Protein Market Volume Share (%), by Product Type 2025 & 2033
- Figure 19: Europe Dairy Protein Market Revenue (Million), by Application 2025 & 2033
- Figure 20: Europe Dairy Protein Market Volume (K Units), by Application 2025 & 2033
- Figure 21: Europe Dairy Protein Market Revenue Share (%), by Application 2025 & 2033
- Figure 22: Europe Dairy Protein Market Volume Share (%), by Application 2025 & 2033
- Figure 23: Europe Dairy Protein Market Revenue (Million), by Country 2025 & 2033
- Figure 24: Europe Dairy Protein Market Volume (K Units), by Country 2025 & 2033
- Figure 25: Europe Dairy Protein Market Revenue Share (%), by Country 2025 & 2033
- Figure 26: Europe Dairy Protein Market Volume Share (%), by Country 2025 & 2033
- Figure 27: Asia Pacific Dairy Protein Market Revenue (Million), by Product Type 2025 & 2033
- Figure 28: Asia Pacific Dairy Protein Market Volume (K Units), by Product Type 2025 & 2033
- Figure 29: Asia Pacific Dairy Protein Market Revenue Share (%), by Product Type 2025 & 2033
- Figure 30: Asia Pacific Dairy Protein Market Volume Share (%), by Product Type 2025 & 2033
- Figure 31: Asia Pacific Dairy Protein Market Revenue (Million), by Application 2025 & 2033
- Figure 32: Asia Pacific Dairy Protein Market Volume (K Units), by Application 2025 & 2033
- Figure 33: Asia Pacific Dairy Protein Market Revenue Share (%), by Application 2025 & 2033
- Figure 34: Asia Pacific Dairy Protein Market Volume Share (%), by Application 2025 & 2033
- Figure 35: Asia Pacific Dairy Protein Market Revenue (Million), by Country 2025 & 2033
- Figure 36: Asia Pacific Dairy Protein Market Volume (K Units), by Country 2025 & 2033
- Figure 37: Asia Pacific Dairy Protein Market Revenue Share (%), by Country 2025 & 2033
- Figure 38: Asia Pacific Dairy Protein Market Volume Share (%), by Country 2025 & 2033
- Figure 39: South America Dairy Protein Market Revenue (Million), by Product Type 2025 & 2033
- Figure 40: South America Dairy Protein Market Volume (K Units), by Product Type 2025 & 2033
- Figure 41: South America Dairy Protein Market Revenue Share (%), by Product Type 2025 & 2033
- Figure 42: South America Dairy Protein Market Volume Share (%), by Product Type 2025 & 2033
- Figure 43: South America Dairy Protein Market Revenue (Million), by Application 2025 & 2033
- Figure 44: South America Dairy Protein Market Volume (K Units), by Application 2025 & 2033
- Figure 45: South America Dairy Protein Market Revenue Share (%), by Application 2025 & 2033
- Figure 46: South America Dairy Protein Market Volume Share (%), by Application 2025 & 2033
- Figure 47: South America Dairy Protein Market Revenue (Million), by Country 2025 & 2033
- Figure 48: South America Dairy Protein Market Volume (K Units), by Country 2025 & 2033
- Figure 49: South America Dairy Protein Market Revenue Share (%), by Country 2025 & 2033
- Figure 50: South America Dairy Protein Market Volume Share (%), by Country 2025 & 2033
- Figure 51: Middle East Dairy Protein Market Revenue (Million), by Product Type 2025 & 2033
- Figure 52: Middle East Dairy Protein Market Volume (K Units), by Product Type 2025 & 2033
- Figure 53: Middle East Dairy Protein Market Revenue Share (%), by Product Type 2025 & 2033
- Figure 54: Middle East Dairy Protein Market Volume Share (%), by Product Type 2025 & 2033
- Figure 55: Middle East Dairy Protein Market Revenue (Million), by Application 2025 & 2033
- Figure 56: Middle East Dairy Protein Market Volume (K Units), by Application 2025 & 2033
- Figure 57: Middle East Dairy Protein Market Revenue Share (%), by Application 2025 & 2033
- Figure 58: Middle East Dairy Protein Market Volume Share (%), by Application 2025 & 2033
- Figure 59: Middle East Dairy Protein Market Revenue (Million), by Country 2025 & 2033
- Figure 60: Middle East Dairy Protein Market Volume (K Units), by Country 2025 & 2033
- Figure 61: Middle East Dairy Protein Market Revenue Share (%), by Country 2025 & 2033
- Figure 62: Middle East Dairy Protein Market Volume Share (%), by Country 2025 & 2033
- Figure 63: South Africa Dairy Protein Market Revenue (Million), by Product Type 2025 & 2033
- Figure 64: South Africa Dairy Protein Market Volume (K Units), by Product Type 2025 & 2033
- Figure 65: South Africa Dairy Protein Market Revenue Share (%), by Product Type 2025 & 2033
- Figure 66: South Africa Dairy Protein Market Volume Share (%), by Product Type 2025 & 2033
- Figure 67: South Africa Dairy Protein Market Revenue (Million), by Application 2025 & 2033
- Figure 68: South Africa Dairy Protein Market Volume (K Units), by Application 2025 & 2033
- Figure 69: South Africa Dairy Protein Market Revenue Share (%), by Application 2025 & 2033
- Figure 70: South Africa Dairy Protein Market Volume Share (%), by Application 2025 & 2033
- Figure 71: South Africa Dairy Protein Market Revenue (Million), by Country 2025 & 2033
- Figure 72: South Africa Dairy Protein Market Volume (K Units), by Country 2025 & 2033
- Figure 73: South Africa Dairy Protein Market Revenue Share (%), by Country 2025 & 2033
- Figure 74: South Africa Dairy Protein Market Volume Share (%), by Country 2025 & 2033
List of Tables
- Table 1: Global Dairy Protein Market Revenue Million Forecast, by Product Type 2020 & 2033
- Table 2: Global Dairy Protein Market Volume K Units Forecast, by Product Type 2020 & 2033
- Table 3: Global Dairy Protein Market Revenue Million Forecast, by Application 2020 & 2033
- Table 4: Global Dairy Protein Market Volume K Units Forecast, by Application 2020 & 2033
- Table 5: Global Dairy Protein Market Revenue Million Forecast, by Region 2020 & 2033
- Table 6: Global Dairy Protein Market Volume K Units Forecast, by Region 2020 & 2033
- Table 7: Global Dairy Protein Market Revenue Million Forecast, by Product Type 2020 & 2033
- Table 8: Global Dairy Protein Market Volume K Units Forecast, by Product Type 2020 & 2033
- Table 9: Global Dairy Protein Market Revenue Million Forecast, by Application 2020 & 2033
- Table 10: Global Dairy Protein Market Volume K Units Forecast, by Application 2020 & 2033
- Table 11: Global Dairy Protein Market Revenue Million Forecast, by Country 2020 & 2033
- Table 12: Global Dairy Protein Market Volume K Units Forecast, by Country 2020 & 2033
- Table 13: United States Dairy Protein Market Revenue (Million) Forecast, by Application 2020 & 2033
- Table 14: United States Dairy Protein Market Volume (K Units) Forecast, by Application 2020 & 2033
- Table 15: Canada Dairy Protein Market Revenue (Million) Forecast, by Application 2020 & 2033
- Table 16: Canada Dairy Protein Market Volume (K Units) Forecast, by Application 2020 & 2033
- Table 17: Mexico Dairy Protein Market Revenue (Million) Forecast, by Application 2020 & 2033
- Table 18: Mexico Dairy Protein Market Volume (K Units) Forecast, by Application 2020 & 2033
- Table 19: Rest of North America Dairy Protein Market Revenue (Million) Forecast, by Application 2020 & 2033
- Table 20: Rest of North America Dairy Protein Market Volume (K Units) Forecast, by Application 2020 & 2033
- Table 21: Global Dairy Protein Market Revenue Million Forecast, by Product Type 2020 & 2033
- Table 22: Global Dairy Protein Market Volume K Units Forecast, by Product Type 2020 & 2033
- Table 23: Global Dairy Protein Market Revenue Million Forecast, by Application 2020 & 2033
- Table 24: Global Dairy Protein Market Volume K Units Forecast, by Application 2020 & 2033
- Table 25: Global Dairy Protein Market Revenue Million Forecast, by Country 2020 & 2033
- Table 26: Global Dairy Protein Market Volume K Units Forecast, by Country 2020 & 2033
- Table 27: United Kingdom Dairy Protein Market Revenue (Million) Forecast, by Application 2020 & 2033
- Table 28: United Kingdom Dairy Protein Market Volume (K Units) Forecast, by Application 2020 & 2033
- Table 29: Germany Dairy Protein Market Revenue (Million) Forecast, by Application 2020 & 2033
- Table 30: Germany Dairy Protein Market Volume (K Units) Forecast, by Application 2020 & 2033
- Table 31: France Dairy Protein Market Revenue (Million) Forecast, by Application 2020 & 2033
- Table 32: France Dairy Protein Market Volume (K Units) Forecast, by Application 2020 & 2033
- Table 33: Russia Dairy Protein Market Revenue (Million) Forecast, by Application 2020 & 2033
- Table 34: Russia Dairy Protein Market Volume (K Units) Forecast, by Application 2020 & 2033
- Table 35: Italy Dairy Protein Market Revenue (Million) Forecast, by Application 2020 & 2033
- Table 36: Italy Dairy Protein Market Volume (K Units) Forecast, by Application 2020 & 2033
- Table 37: Spain Dairy Protein Market Revenue (Million) Forecast, by Application 2020 & 2033
- Table 38: Spain Dairy Protein Market Volume (K Units) Forecast, by Application 2020 & 2033
- Table 39: Rest of Europe Dairy Protein Market Revenue (Million) Forecast, by Application 2020 & 2033
- Table 40: Rest of Europe Dairy Protein Market Volume (K Units) Forecast, by Application 2020 & 2033
- Table 41: Global Dairy Protein Market Revenue Million Forecast, by Product Type 2020 & 2033
- Table 42: Global Dairy Protein Market Volume K Units Forecast, by Product Type 2020 & 2033
- Table 43: Global Dairy Protein Market Revenue Million Forecast, by Application 2020 & 2033
- Table 44: Global Dairy Protein Market Volume K Units Forecast, by Application 2020 & 2033
- Table 45: Global Dairy Protein Market Revenue Million Forecast, by Country 2020 & 2033
- Table 46: Global Dairy Protein Market Volume K Units Forecast, by Country 2020 & 2033
- Table 47: India Dairy Protein Market Revenue (Million) Forecast, by Application 2020 & 2033
- Table 48: India Dairy Protein Market Volume (K Units) Forecast, by Application 2020 & 2033
- Table 49: China Dairy Protein Market Revenue (Million) Forecast, by Application 2020 & 2033
- Table 50: China Dairy Protein Market Volume (K Units) Forecast, by Application 2020 & 2033
- Table 51: Japan Dairy Protein Market Revenue (Million) Forecast, by Application 2020 & 2033
- Table 52: Japan Dairy Protein Market Volume (K Units) Forecast, by Application 2020 & 2033
- Table 53: Australia Dairy Protein Market Revenue (Million) Forecast, by Application 2020 & 2033
- Table 54: Australia Dairy Protein Market Volume (K Units) Forecast, by Application 2020 & 2033
- Table 55: Rest of Asia Pacific Dairy Protein Market Revenue (Million) Forecast, by Application 2020 & 2033
- Table 56: Rest of Asia Pacific Dairy Protein Market Volume (K Units) Forecast, by Application 2020 & 2033
- Table 57: Global Dairy Protein Market Revenue Million Forecast, by Product Type 2020 & 2033
- Table 58: Global Dairy Protein Market Volume K Units Forecast, by Product Type 2020 & 2033
- Table 59: Global Dairy Protein Market Revenue Million Forecast, by Application 2020 & 2033
- Table 60: Global Dairy Protein Market Volume K Units Forecast, by Application 2020 & 2033
- Table 61: Global Dairy Protein Market Revenue Million Forecast, by Country 2020 & 2033
- Table 62: Global Dairy Protein Market Volume K Units Forecast, by Country 2020 & 2033
- Table 63: Brazil Dairy Protein Market Revenue (Million) Forecast, by Application 2020 & 2033
- Table 64: Brazil Dairy Protein Market Volume (K Units) Forecast, by Application 2020 & 2033
- Table 65: Argentina Dairy Protein Market Revenue (Million) Forecast, by Application 2020 & 2033
- Table 66: Argentina Dairy Protein Market Volume (K Units) Forecast, by Application 2020 & 2033
- Table 67: Rest of South America Dairy Protein Market Revenue (Million) Forecast, by Application 2020 & 2033
- Table 68: Rest of South America Dairy Protein Market Volume (K Units) Forecast, by Application 2020 & 2033
- Table 69: Global Dairy Protein Market Revenue Million Forecast, by Product Type 2020 & 2033
- Table 70: Global Dairy Protein Market Volume K Units Forecast, by Product Type 2020 & 2033
- Table 71: Global Dairy Protein Market Revenue Million Forecast, by Application 2020 & 2033
- Table 72: Global Dairy Protein Market Volume K Units Forecast, by Application 2020 & 2033
- Table 73: Global Dairy Protein Market Revenue Million Forecast, by Country 2020 & 2033
- Table 74: Global Dairy Protein Market Volume K Units Forecast, by Country 2020 & 2033
- Table 75: Global Dairy Protein Market Revenue Million Forecast, by Product Type 2020 & 2033
- Table 76: Global Dairy Protein Market Volume K Units Forecast, by Product Type 2020 & 2033
- Table 77: Global Dairy Protein Market Revenue Million Forecast, by Application 2020 & 2033
- Table 78: Global Dairy Protein Market Volume K Units Forecast, by Application 2020 & 2033
- Table 79: Global Dairy Protein Market Revenue Million Forecast, by Country 2020 & 2033
- Table 80: Global Dairy Protein Market Volume K Units Forecast, by Country 2020 & 2033
- Table 81: Saudi Arabia Dairy Protein Market Revenue (Million) Forecast, by Application 2020 & 2033
- Table 82: Saudi Arabia Dairy Protein Market Volume (K Units) Forecast, by Application 2020 & 2033
- Table 83: Rest of Middle East Dairy Protein Market Revenue (Million) Forecast, by Application 2020 & 2033
- Table 84: Rest of Middle East Dairy Protein Market Volume (K Units) Forecast, by Application 2020 & 2033
Frequently Asked Questions
1. What is the projected Compound Annual Growth Rate (CAGR) of the Dairy Protein Market?
The projected CAGR is approximately 4.34%.
2. Which companies are prominent players in the Dairy Protein Market?
Key companies in the market include Groupe Sodiaal, Bonafarm Group, Prolactal GmbH, Glanbia PLC, Dairy Farmers of America, Royal FrieslandCampina NV, Kerry Group, Hoogwegt International BV*List Not Exhaustive, Fonterra Co-operative Group Limited, Groupe Lactalis.
3. What are the main segments of the Dairy Protein Market?
The market segments include Product Type, Application.
4. Can you provide details about the market size?
The market size is estimated to be USD 4.81 Million as of 2022.
5. What are some drivers contributing to market growth?
Increasing Demand for Protein Rich Food and Supplements; Increasing Application of Collagen in Personal Care Products.
6. What are the notable trends driving market growth?
Growing Awareness Towards Healthy Food.
7. Are there any restraints impacting market growth?
Increasing Demand for Plant-Based Protein.
8. Can you provide examples of recent developments in the market?
March 2023: FrieslandCampina inaugurated a new production facility in the Netherlands dedicated to lactoferrin manufacturing. With the new plant, the company will be able to quadruple its lactoferrin production capacity from 20 to 80 metric tonnes per year. Lactoferrin is a crucial component in infant formula and antiviral treatments.
9. What pricing options are available for accessing the report?
Pricing options include single-user, multi-user, and enterprise licenses priced at USD 4750, USD 5250, and USD 8750 respectively.
10. Is the market size provided in terms of value or volume?
The market size is provided in terms of value, measured in Million and volume, measured in K Units.
11. Are there any specific market keywords associated with the report?
Yes, the market keyword associated with the report is "Dairy Protein Market," which aids in identifying and referencing the specific market segment covered.
12. How do I determine which pricing option suits my needs best?
The pricing options vary based on user requirements and access needs. Individual users may opt for single-user licenses, while businesses requiring broader access may choose multi-user or enterprise licenses for cost-effective access to the report.
13. Are there any additional resources or data provided in the Dairy Protein Market report?
While the report offers comprehensive insights, it's advisable to review the specific contents or supplementary materials provided to ascertain if additional resources or data are available.
14. How can I stay updated on further developments or reports in the Dairy Protein Market?
To stay informed about further developments, trends, and reports in the Dairy Protein Market, consider subscribing to industry newsletters, following relevant companies and organizations, or regularly checking reputable industry news sources and publications.
Methodology
Step 1 - Identification of Relevant Samples Size from Population Database


Step 2 - Approaches for Defining Global Market Size (Value, Volume* & Price*)

Note*: In applicable scenarios
Step 3 - Data Sources
Primary Research
- Web Analytics
- Survey Reports
- Research Institute
- Latest Research Reports
- Opinion Leaders
Secondary Research
- Annual Reports
- White Paper
- Latest Press Release
- Industry Association
- Paid Database
- Investor Presentations

Step 4 - Data Triangulation
Involves using different sources of information in order to increase the validity of a study
These sources are likely to be stakeholders in a program - participants, other researchers, program staff, other community members, and so on.
Then we put all data in single framework & apply various statistical tools to find out the dynamic on the market.
During the analysis stage, feedback from the stakeholder groups would be compared to determine areas of agreement as well as areas of divergence

