

Key Insights
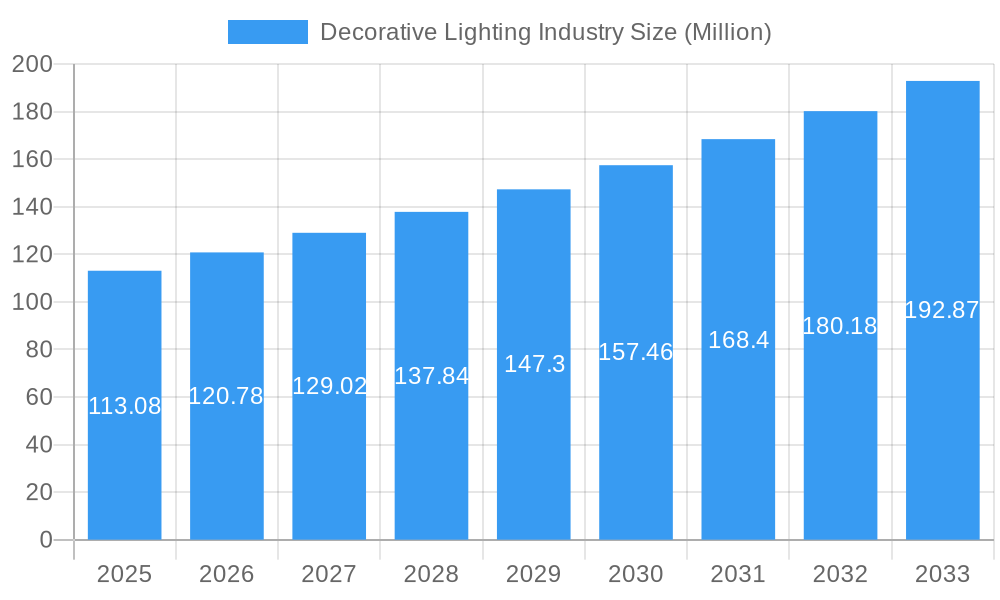
The global decorative lighting market, valued at $113.08 million in 2025, is projected to experience robust growth, driven by a compound annual growth rate (CAGR) of 6.75% from 2025 to 2033. This expansion is fueled by several key factors. The increasing preference for aesthetically pleasing and energy-efficient lighting solutions in both residential and commercial spaces is a significant driver. The rising adoption of LED technology, offering superior energy efficiency and longer lifespan compared to traditional incandescent and fluorescent bulbs, is further propelling market growth. Furthermore, evolving design trends, incorporating smart home integration and customizable lighting options, are enhancing consumer appeal and driving demand. The online distribution channel is also contributing significantly to market expansion, offering consumers a wider selection and greater convenience. While precise figures for individual segments are unavailable, a reasonable estimation suggests that LED lighting will dominate the light source segment, followed by fluorescent and then incandescent. Similarly, ceiling lights are expected to hold the largest share of the product segment, given their prevalence in both residential and commercial settings. North America and Europe are likely to represent the largest regional markets, driven by high disposable incomes and established infrastructure. However, the Asia-Pacific region is anticipated to witness significant growth during the forecast period, fueled by rapid urbanization and rising consumer spending.
Decorative Lighting Industry Market Size (In Million)
The market, however, faces certain restraints. Fluctuations in raw material prices, particularly for metals used in lighting fixtures, can impact profitability. Moreover, intense competition among established players and new entrants necessitates continuous innovation and product differentiation to maintain market share. Despite these challenges, the long-term outlook for the decorative lighting market remains positive, particularly with the ongoing adoption of smart lighting technologies and the rising demand for sustainable and energy-efficient solutions. The market is expected to benefit from increasing investments in infrastructure development and the growth of the construction industry globally, further bolstering demand in both the commercial and residential sectors.
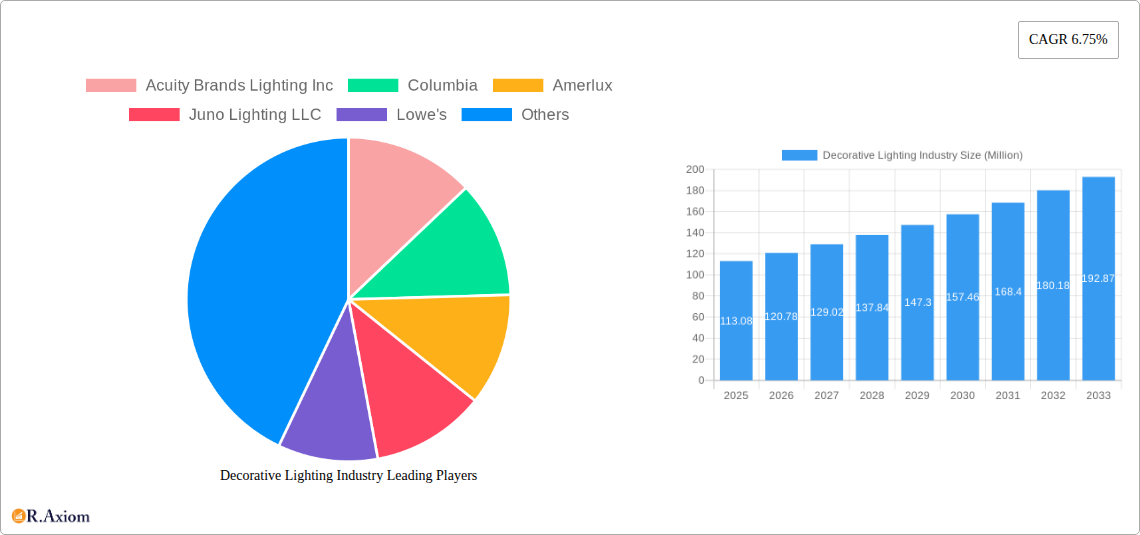
Decorative Lighting Industry Company Market Share
Decorative Lighting Industry: A Comprehensive Market Report (2019-2033)
This comprehensive report provides a detailed analysis of the Decorative Lighting Industry, encompassing market size, growth projections, key players, and emerging trends from 2019 to 2033. The study leverages rigorous research methodologies, incorporating both historical data (2019-2024) and future forecasts (2025-2033), with 2025 serving as the base year. This report is indispensable for industry stakeholders, investors, and strategic decision-makers seeking to navigate the complexities and opportunities within this dynamic market. The global decorative lighting market is estimated to be valued at $xx Million in 2025 and is projected to reach $xx Million by 2033, exhibiting a CAGR of xx% during the forecast period.
Decorative Lighting Industry Market Concentration & Innovation
The decorative lighting industry exhibits a moderately concentrated market structure, with key players like Acuity Brands Lighting Inc, Columbia, Amerlux, Juno Lighting LLC, Lowe's, and GE Lighting holding significant market share. However, the presence of numerous smaller players and the continuous emergence of innovative startups fosters a competitive landscape. Market share data for 2025 indicates Acuity Brands holds approximately xx%, followed by Columbia at xx%, while other major players like Amerlux and Juno Lighting share the remaining xx%. The industry is driven by continuous innovation in light source technology (LED, OLED), design aesthetics, smart home integration, and energy efficiency regulations. Regulatory frameworks, particularly those focused on energy efficiency and environmental impact, significantly influence product development and market adoption. The rise of smart home technology and the increasing preference for energy-efficient solutions are major innovation drivers. M&A activities have played a role in shaping market concentration, with deal values in the past five years totaling approximately $xx Million. These activities are often driven by a desire to expand product portfolios, enhance technological capabilities, and access new markets. Product substitutes, such as natural lighting solutions and alternative decorative elements, pose a competitive challenge, but the overall market remains largely resilient due to the functional and aesthetic importance of lighting in both residential and commercial settings.
- Market Share (2025): Acuity Brands (xx%), Columbia (xx%), Amerlux (xx%), Juno Lighting (xx%), Others (xx%)
- M&A Deal Value (2020-2024): $xx Million
Decorative Lighting Industry Industry Trends & Insights
The decorative lighting industry is experiencing a dynamic and robust period of growth, propelled by a confluence of impactful factors. A significant catalyst is the pervasive adoption of energy-efficient LED lighting. This trend is driven not only by consumers' desire for reduced energy bills but also by increasingly stringent government regulations promoting energy conservation. Technological advancements are revolutionizing the market, with smart lighting solutions integrating advanced controls and seamless connectivity. These intelligent systems elevate the user experience through enhanced customization options and effortless integration with other smart home devices, creating more intuitive and personalized living spaces.
Consumer preferences are increasingly leaning towards decorative lighting that seamlessly blends aesthetic appeal with functional excellence. There's a palpable surge in demand for personalized and bespoke lighting solutions that reflect individual styles and needs. This inclination is particularly evident in the rising popularity of minimalist, contemporary, and nostalgic vintage-inspired lighting designs. The competitive landscape is characterized by intense rivalry among established industry giants and the agile entry of new players, fostering strategies focused on competitive pricing and distinct product differentiation. A strong and growing emphasis on sustainable and eco-friendly lighting solutions underscores increasing consumer environmental awareness, shaping purchasing decisions and driving innovation towards greener alternatives.
The market penetration of LED lighting is estimated at **[Insert current LED market share]%** in 2025, with projections indicating a significant rise to **[Insert projected LED market share]%** by 2033. The overall decorative lighting market is anticipated to experience a Compound Annual Growth Rate (CAGR) of **[Insert projected CAGR]%** during the forecast period of 2025-2033.
Dominant Markets & Segments in Decorative Lighting Industry
The North American region currently commands the largest market share within the decorative lighting industry. This dominance is attributed to a combination of strong economic growth, sustained robust construction activity, and high consumer expenditure on home improvement projects. Within North America, the United States stands out as the leading market in terms of size, largely due to its expansive residential and commercial sectors.
-
By Light Source: LED lighting unequivocally dominates the market, accounting for approximately **[Insert current LED market share]%** of the total market share in 2025. This leadership is driven by its superior energy efficiency, extended lifespan, and remarkable versatility in design possibilities. Fluorescent lighting occupies a smaller market segment, while incandescent lighting continues its decline due to inherent energy efficiency concerns.
-
By Product: Ceiling lights represent the largest product segment, followed closely by wall-mounted lights. This distribution reflects the widespread integration of these fixture types in both residential and commercial architectural designs. The "Other Products" category encompasses a diverse array of specialized and niche lighting segments.
-
By End-Use: The household segment is the primary driver of market growth, fueled by substantial consumer investment in home modernization and the accelerating adoption of sophisticated smart lighting solutions. The commercial segment is witnessing steady and consistent expansion, propelled by the increasing demand for energy-efficient and aesthetically appealing lighting solutions in corporate offices, retail spaces, and hospitality venues.
-
By Distribution Channel: While offline channels, including hypermarkets, supermarkets, and specialized lighting stores, continue to be the predominant distribution avenues, online sales are exhibiting rapid growth. This surge is attributed to the inherent convenience, wider reach, and accessibility offered by e-commerce platforms. Furthermore, government policies that champion sustainable development, advancements in infrastructural projects, and strategic investments in smart city initiatives are pivotal driving forces behind the expansion of this market.
Decorative Lighting Industry Product Developments
Recent product innovations focus on integrating smart technology into lighting fixtures, enabling features such as voice control, app-based customization, and energy monitoring. The development of new materials and designs allows for enhanced aesthetics and durability. Technological trends emphasize energy efficiency, smart connectivity, and personalized lighting experiences. The market is seeing a significant push towards adaptable and customizable lighting solutions that cater to individual preferences and diverse design aesthetics. This is driving the adoption of smart lighting systems and the integration of other smart home technologies. These developments offer strong competitive advantages, enabling companies to capture market share and enhance their brand image.
Report Scope & Segmentation Analysis
This report provides a comprehensive analysis of the decorative lighting market, segmented by light source (LED, Fluorescent, Incandescent, Other), product type (Ceiling, Wall Mounted, Other), end-use (Commercial, Household), and distribution channel (Offline, Online). Each segment is analyzed in terms of market size, growth projections, and competitive dynamics. For example, the LED segment is projected to experience significant growth, driven by its superior energy efficiency and cost savings. The ceiling lighting segment holds the largest market share, due to its widespread use in various settings. The household end-use segment is expected to show strong growth due to increased consumer spending on home improvements. Online distribution channels are expected to increase market penetration due to growing e-commerce.
Key Drivers of Decorative Lighting Industry Growth
Several factors drive the growth of the decorative lighting industry. Technological advancements, particularly the development of energy-efficient LED lighting and smart lighting solutions, are major contributors. Economic factors, such as rising disposable incomes and increased investment in infrastructure projects, also fuel market growth. Regulatory frameworks that promote energy efficiency and the adoption of sustainable lighting solutions further boost the industry. Government incentives and building codes that mandate energy-efficient lighting enhance market demand. The rising popularity of smart home technology and the desire for personalized lighting experiences add further impetus.
Challenges in the Decorative Lighting Industry Sector
The industry faces challenges, including intense price competition, fluctuations in raw material costs, and the need to comply with stringent environmental regulations. Supply chain disruptions can also impact production and delivery timelines. Moreover, increased competition from emerging players and counterfeit products poses a threat to market stability. These factors can significantly influence profitability and market share. For instance, a 10% increase in raw material costs could lead to a xx% reduction in profit margins for some manufacturers.
Emerging Opportunities in Decorative Lighting Industry
The market presents several opportunities, such as the growing demand for smart lighting systems, the expansion of LED technology applications, and the increasing focus on sustainable and energy-efficient lighting solutions. New markets in developing economies offer significant growth potential. Integration with other smart home technologies presents further opportunities for market expansion. The increasing adoption of personalized and customizable lighting options signifies another opportunity for growth.
Leading Players in the Decorative Lighting Industry Market
- Acuity Brands Lighting Inc.
- Columbia Lighting
- Amerlux
- Juno Lighting LLC
- Lowe's
- GE Lighting
- Intense LSI Cree
- Osram
- ETC (Electronic Theatre Controls)
- Generation Lighting
- Littmann
- AZZ Inc.
- Maxim Lighting
Key Developments in Decorative Lighting Industry Industry
- 2022-Q4: Acuity Brands successfully launched an innovative new series of smart LED lighting fixtures, further solidifying its position in the smart home market.
- 2023-Q1: Columbia Lighting strategically expanded its product portfolio through the acquisition of a promising smaller lighting manufacturer.
- 2023-Q3: The implementation of new, more stringent energy efficiency regulations across several key geographical markets significantly influenced product development strategies and consumer adoption trends.
- 2024-Q2: A major industry trade show served as a prominent platform to unveil cutting-edge lighting technologies and groundbreaking design concepts, offering a glimpse into future market directions. (Specific details would be added based on real data.)
Strategic Outlook for Decorative Lighting Industry Market
The decorative lighting industry is strategically positioned for sustained and significant growth, propelled by ongoing technological innovation, escalating consumer demand for enhanced lighting experiences, and supportive governmental policies. The widespread adoption of sophisticated smart lighting solutions, the continued expansion and refinement of LED technology, and a steadfast commitment to sustainable manufacturing practices will be the primary architects of future market dynamics. The seamless integration of lighting systems with other burgeoning smart home technologies presents substantial new avenues for market expansion and revenue generation. Furthermore, the market is anticipated to witness a pronounced shift towards increasingly personalized and customizable lighting options, meticulously catering to evolving and diverse consumer preferences.
Decorative Lighting Industry Segmentation
-
1. Light Source
- 1.1. LED
- 1.2. Fluroscent
- 1.3. Incandescent
- 1.4. Other Light Sources
-
2. Product
- 2.1. Ceiling
- 2.2. Wall Mounted
- 2.3. Other Products
-
3. End Use
- 3.1. Commercial
- 3.2. Household
-
4. Distribution Channel
- 4.1. Offline
- 4.2. Online
Decorative Lighting Industry Segmentation By Geography
- 1. North America
- 2. Europe
- 3. Asia Pacific
- 4. Latin America
- 5. Middle East and Africa
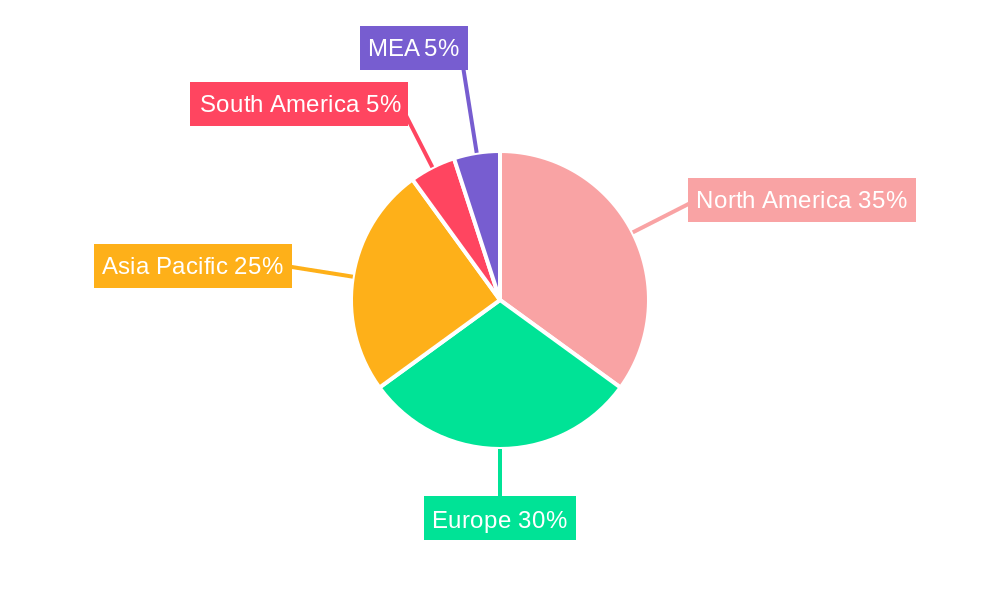
Decorative Lighting Industry Regional Market Share
Geographic Coverage of Decorative Lighting Industry
Decorative Lighting Industry REPORT HIGHLIGHTS
| Aspects | Details |
|---|---|
| Study Period | 2020-2034 |
| Base Year | 2025 |
| Estimated Year | 2026 |
| Forecast Period | 2026-2034 |
| Historical Period | 2020-2025 |
| Growth Rate | CAGR of 6.75% from 2020-2034 |
| Segmentation |
|
Table of Contents
- 1. Introduction
- 1.1. Research Scope
- 1.2. Market Segmentation
- 1.3. Research Objective
- 1.4. Definitions and Assumptions
- 2. Executive Summary
- 2.1. Market Snapshot
- 3. Market Dynamics
- 3.1. Market Drivers
- 3.2. Market Restrains
- 3.3. Market Trends
- 3.4. Market Opportunities
- 4. Market Factor Analysis
- 4.1. Porters Five Forces
- 4.1.1. Bargaining Power of Suppliers
- 4.1.2. Bargaining Power of Buyers
- 4.1.3. Threat of New Entrants
- 4.1.4. Threat of Substitutes
- 4.1.5. Competitive Rivalry
- 4.2. PESTEL analysis
- 4.3. BCG Analysis
- 4.3.1. Stars (High Growth, High Market Share)
- 4.3.2. Cash Cows (Low Growth, High Market Share)
- 4.3.3. Question Mark (High Growth, Low Market Share)
- 4.3.4. Dogs (Low Growth, Low Market Share)
- 4.4. Ansoff Matrix Analysis
- 4.5. Supply Chain Analysis
- 4.6. Regulatory Landscape
- 4.7. Current Market Potential and Opportunity Assessment (TAM–SAM–SOM Framework)
- 4.8. RAX Analyst Note
- 4.1. Porters Five Forces
- 5. Market Analysis, Insights and Forecast 2021-2033
- 5.1. Market Analysis, Insights and Forecast - by Light Source
- 5.1.1. LED
- 5.1.2. Fluroscent
- 5.1.3. Incandescent
- 5.1.4. Other Light Sources
- 5.2. Market Analysis, Insights and Forecast - by Product
- 5.2.1. Ceiling
- 5.2.2. Wall Mounted
- 5.2.3. Other Products
- 5.3. Market Analysis, Insights and Forecast - by End Use
- 5.3.1. Commercial
- 5.3.2. Household
- 5.4. Market Analysis, Insights and Forecast - by Distribution Channel
- 5.4.1. Offline
- 5.4.2. Online
- 5.5. Market Analysis, Insights and Forecast - by Region
- 5.5.1. North America
- 5.5.2. Europe
- 5.5.3. Asia Pacific
- 5.5.4. Latin America
- 5.5.5. Middle East and Africa
- 5.1. Market Analysis, Insights and Forecast - by Light Source
- 6. Global Decorative Lighting Industry Analysis, Insights and Forecast, 2021-2033
- 6.1. Market Analysis, Insights and Forecast - by Light Source
- 6.1.1. LED
- 6.1.2. Fluroscent
- 6.1.3. Incandescent
- 6.1.4. Other Light Sources
- 6.2. Market Analysis, Insights and Forecast - by Product
- 6.2.1. Ceiling
- 6.2.2. Wall Mounted
- 6.2.3. Other Products
- 6.3. Market Analysis, Insights and Forecast - by End Use
- 6.3.1. Commercial
- 6.3.2. Household
- 6.4. Market Analysis, Insights and Forecast - by Distribution Channel
- 6.4.1. Offline
- 6.4.2. Online
- 6.1. Market Analysis, Insights and Forecast - by Light Source
- 7. North America Decorative Lighting Industry Analysis, Insights and Forecast, 2020-2032
- 7.1. Market Analysis, Insights and Forecast - by Light Source
- 7.1.1. LED
- 7.1.2. Fluroscent
- 7.1.3. Incandescent
- 7.1.4. Other Light Sources
- 7.2. Market Analysis, Insights and Forecast - by Product
- 7.2.1. Ceiling
- 7.2.2. Wall Mounted
- 7.2.3. Other Products
- 7.3. Market Analysis, Insights and Forecast - by End Use
- 7.3.1. Commercial
- 7.3.2. Household
- 7.4. Market Analysis, Insights and Forecast - by Distribution Channel
- 7.4.1. Offline
- 7.4.2. Online
- 7.1. Market Analysis, Insights and Forecast - by Light Source
- 8. Europe Decorative Lighting Industry Analysis, Insights and Forecast, 2020-2032
- 8.1. Market Analysis, Insights and Forecast - by Light Source
- 8.1.1. LED
- 8.1.2. Fluroscent
- 8.1.3. Incandescent
- 8.1.4. Other Light Sources
- 8.2. Market Analysis, Insights and Forecast - by Product
- 8.2.1. Ceiling
- 8.2.2. Wall Mounted
- 8.2.3. Other Products
- 8.3. Market Analysis, Insights and Forecast - by End Use
- 8.3.1. Commercial
- 8.3.2. Household
- 8.4. Market Analysis, Insights and Forecast - by Distribution Channel
- 8.4.1. Offline
- 8.4.2. Online
- 8.1. Market Analysis, Insights and Forecast - by Light Source
- 9. Asia Pacific Decorative Lighting Industry Analysis, Insights and Forecast, 2020-2032
- 9.1. Market Analysis, Insights and Forecast - by Light Source
- 9.1.1. LED
- 9.1.2. Fluroscent
- 9.1.3. Incandescent
- 9.1.4. Other Light Sources
- 9.2. Market Analysis, Insights and Forecast - by Product
- 9.2.1. Ceiling
- 9.2.2. Wall Mounted
- 9.2.3. Other Products
- 9.3. Market Analysis, Insights and Forecast - by End Use
- 9.3.1. Commercial
- 9.3.2. Household
- 9.4. Market Analysis, Insights and Forecast - by Distribution Channel
- 9.4.1. Offline
- 9.4.2. Online
- 9.1. Market Analysis, Insights and Forecast - by Light Source
- 10. Latin America Decorative Lighting Industry Analysis, Insights and Forecast, 2020-2032
- 10.1. Market Analysis, Insights and Forecast - by Light Source
- 10.1.1. LED
- 10.1.2. Fluroscent
- 10.1.3. Incandescent
- 10.1.4. Other Light Sources
- 10.2. Market Analysis, Insights and Forecast - by Product
- 10.2.1. Ceiling
- 10.2.2. Wall Mounted
- 10.2.3. Other Products
- 10.3. Market Analysis, Insights and Forecast - by End Use
- 10.3.1. Commercial
- 10.3.2. Household
- 10.4. Market Analysis, Insights and Forecast - by Distribution Channel
- 10.4.1. Offline
- 10.4.2. Online
- 10.1. Market Analysis, Insights and Forecast - by Light Source
- 11. Middle East and Africa Decorative Lighting Industry Analysis, Insights and Forecast, 2020-2032
- 11.1. Market Analysis, Insights and Forecast - by Light Source
- 11.1.1. LED
- 11.1.2. Fluroscent
- 11.1.3. Incandescent
- 11.1.4. Other Light Sources
- 11.2. Market Analysis, Insights and Forecast - by Product
- 11.2.1. Ceiling
- 11.2.2. Wall Mounted
- 11.2.3. Other Products
- 11.3. Market Analysis, Insights and Forecast - by End Use
- 11.3.1. Commercial
- 11.3.2. Household
- 11.4. Market Analysis, Insights and Forecast - by Distribution Channel
- 11.4.1. Offline
- 11.4.2. Online
- 11.1. Market Analysis, Insights and Forecast - by Light Source
- 12. Competitive Analysis
- 12.1. Company Profiles
- 12.1.1 Acuity Brands Lighting Inc
- 12.1.1.1. Company Overview
- 12.1.1.2. Products
- 12.1.1.3. Company Financials
- 12.1.1.4. SWOT Analysis
- 12.1.2 Columbia
- 12.1.2.1. Company Overview
- 12.1.2.2. Products
- 12.1.2.3. Company Financials
- 12.1.2.4. SWOT Analysis
- 12.1.3 Amerlux
- 12.1.3.1. Company Overview
- 12.1.3.2. Products
- 12.1.3.3. Company Financials
- 12.1.3.4. SWOT Analysis
- 12.1.4 Juno Lighting LLC
- 12.1.4.1. Company Overview
- 12.1.4.2. Products
- 12.1.4.3. Company Financials
- 12.1.4.4. SWOT Analysis
- 12.1.5 Lowe's
- 12.1.5.1. Company Overview
- 12.1.5.2. Products
- 12.1.5.3. Company Financials
- 12.1.5.4. SWOT Analysis
- 12.1.6 GE Lighting
- 12.1.6.1. Company Overview
- 12.1.6.2. Products
- 12.1.6.3. Company Financials
- 12.1.6.4. SWOT Analysis
- 12.1.7 Other Companies (Intense LSI Cree
- 12.1.7.1. Company Overview
- 12.1.7.2. Products
- 12.1.7.3. Company Financials
- 12.1.7.4. SWOT Analysis
- 12.1.8 Osram
- 12.1.8.1. Company Overview
- 12.1.8.2. Products
- 12.1.8.3. Company Financials
- 12.1.8.4. SWOT Analysis
- 12.1.9 ETC
- 12.1.9.1. Company Overview
- 12.1.9.2. Products
- 12.1.9.3. Company Financials
- 12.1.9.4. SWOT Analysis
- 12.1.10 Generation Lighting
- 12.1.10.1. Company Overview
- 12.1.10.2. Products
- 12.1.10.3. Company Financials
- 12.1.10.4. SWOT Analysis
- 12.1.11 Littmann
- 12.1.11.1. Company Overview
- 12.1.11.2. Products
- 12.1.11.3. Company Financials
- 12.1.11.4. SWOT Analysis
- 12.1.12 AZZ Inc
- 12.1.12.1. Company Overview
- 12.1.12.2. Products
- 12.1.12.3. Company Financials
- 12.1.12.4. SWOT Analysis
- 12.1.13 Maxim Lighting
- 12.1.13.1. Company Overview
- 12.1.13.2. Products
- 12.1.13.3. Company Financials
- 12.1.13.4. SWOT Analysis
- 12.1.1 Acuity Brands Lighting Inc
- 12.2. Market Entropy
- 12.2.1 Company's Key Areas Served
- 12.2.2 Recent Developments
- 12.3. Company Market Share Analysis 2025
- 12.3.1 Top 5 Companies Market Share Analysis
- 12.3.2 Top 3 Companies Market Share Analysis
- 12.4. List of Potential Customers
- 13. Research Methodology
List of Figures
- Figure 1: Global Decorative Lighting Industry Revenue Breakdown (Million, %) by Region 2025 & 2033
- Figure 2: North America Decorative Lighting Industry Revenue (Million), by Light Source 2025 & 2033
- Figure 3: North America Decorative Lighting Industry Revenue Share (%), by Light Source 2025 & 2033
- Figure 4: North America Decorative Lighting Industry Revenue (Million), by Product 2025 & 2033
- Figure 5: North America Decorative Lighting Industry Revenue Share (%), by Product 2025 & 2033
- Figure 6: North America Decorative Lighting Industry Revenue (Million), by End Use 2025 & 2033
- Figure 7: North America Decorative Lighting Industry Revenue Share (%), by End Use 2025 & 2033
- Figure 8: North America Decorative Lighting Industry Revenue (Million), by Distribution Channel 2025 & 2033
- Figure 9: North America Decorative Lighting Industry Revenue Share (%), by Distribution Channel 2025 & 2033
- Figure 10: North America Decorative Lighting Industry Revenue (Million), by Country 2025 & 2033
- Figure 11: North America Decorative Lighting Industry Revenue Share (%), by Country 2025 & 2033
- Figure 12: Europe Decorative Lighting Industry Revenue (Million), by Light Source 2025 & 2033
- Figure 13: Europe Decorative Lighting Industry Revenue Share (%), by Light Source 2025 & 2033
- Figure 14: Europe Decorative Lighting Industry Revenue (Million), by Product 2025 & 2033
- Figure 15: Europe Decorative Lighting Industry Revenue Share (%), by Product 2025 & 2033
- Figure 16: Europe Decorative Lighting Industry Revenue (Million), by End Use 2025 & 2033
- Figure 17: Europe Decorative Lighting Industry Revenue Share (%), by End Use 2025 & 2033
- Figure 18: Europe Decorative Lighting Industry Revenue (Million), by Distribution Channel 2025 & 2033
- Figure 19: Europe Decorative Lighting Industry Revenue Share (%), by Distribution Channel 2025 & 2033
- Figure 20: Europe Decorative Lighting Industry Revenue (Million), by Country 2025 & 2033
- Figure 21: Europe Decorative Lighting Industry Revenue Share (%), by Country 2025 & 2033
- Figure 22: Asia Pacific Decorative Lighting Industry Revenue (Million), by Light Source 2025 & 2033
- Figure 23: Asia Pacific Decorative Lighting Industry Revenue Share (%), by Light Source 2025 & 2033
- Figure 24: Asia Pacific Decorative Lighting Industry Revenue (Million), by Product 2025 & 2033
- Figure 25: Asia Pacific Decorative Lighting Industry Revenue Share (%), by Product 2025 & 2033
- Figure 26: Asia Pacific Decorative Lighting Industry Revenue (Million), by End Use 2025 & 2033
- Figure 27: Asia Pacific Decorative Lighting Industry Revenue Share (%), by End Use 2025 & 2033
- Figure 28: Asia Pacific Decorative Lighting Industry Revenue (Million), by Distribution Channel 2025 & 2033
- Figure 29: Asia Pacific Decorative Lighting Industry Revenue Share (%), by Distribution Channel 2025 & 2033
- Figure 30: Asia Pacific Decorative Lighting Industry Revenue (Million), by Country 2025 & 2033
- Figure 31: Asia Pacific Decorative Lighting Industry Revenue Share (%), by Country 2025 & 2033
- Figure 32: Latin America Decorative Lighting Industry Revenue (Million), by Light Source 2025 & 2033
- Figure 33: Latin America Decorative Lighting Industry Revenue Share (%), by Light Source 2025 & 2033
- Figure 34: Latin America Decorative Lighting Industry Revenue (Million), by Product 2025 & 2033
- Figure 35: Latin America Decorative Lighting Industry Revenue Share (%), by Product 2025 & 2033
- Figure 36: Latin America Decorative Lighting Industry Revenue (Million), by End Use 2025 & 2033
- Figure 37: Latin America Decorative Lighting Industry Revenue Share (%), by End Use 2025 & 2033
- Figure 38: Latin America Decorative Lighting Industry Revenue (Million), by Distribution Channel 2025 & 2033
- Figure 39: Latin America Decorative Lighting Industry Revenue Share (%), by Distribution Channel 2025 & 2033
- Figure 40: Latin America Decorative Lighting Industry Revenue (Million), by Country 2025 & 2033
- Figure 41: Latin America Decorative Lighting Industry Revenue Share (%), by Country 2025 & 2033
- Figure 42: Middle East and Africa Decorative Lighting Industry Revenue (Million), by Light Source 2025 & 2033
- Figure 43: Middle East and Africa Decorative Lighting Industry Revenue Share (%), by Light Source 2025 & 2033
- Figure 44: Middle East and Africa Decorative Lighting Industry Revenue (Million), by Product 2025 & 2033
- Figure 45: Middle East and Africa Decorative Lighting Industry Revenue Share (%), by Product 2025 & 2033
- Figure 46: Middle East and Africa Decorative Lighting Industry Revenue (Million), by End Use 2025 & 2033
- Figure 47: Middle East and Africa Decorative Lighting Industry Revenue Share (%), by End Use 2025 & 2033
- Figure 48: Middle East and Africa Decorative Lighting Industry Revenue (Million), by Distribution Channel 2025 & 2033
- Figure 49: Middle East and Africa Decorative Lighting Industry Revenue Share (%), by Distribution Channel 2025 & 2033
- Figure 50: Middle East and Africa Decorative Lighting Industry Revenue (Million), by Country 2025 & 2033
- Figure 51: Middle East and Africa Decorative Lighting Industry Revenue Share (%), by Country 2025 & 2033
List of Tables
- Table 1: Global Decorative Lighting Industry Revenue Million Forecast, by Light Source 2020 & 2033
- Table 2: Global Decorative Lighting Industry Revenue Million Forecast, by Product 2020 & 2033
- Table 3: Global Decorative Lighting Industry Revenue Million Forecast, by End Use 2020 & 2033
- Table 4: Global Decorative Lighting Industry Revenue Million Forecast, by Distribution Channel 2020 & 2033
- Table 5: Global Decorative Lighting Industry Revenue Million Forecast, by Region 2020 & 2033
- Table 6: Global Decorative Lighting Industry Revenue Million Forecast, by Light Source 2020 & 2033
- Table 7: Global Decorative Lighting Industry Revenue Million Forecast, by Product 2020 & 2033
- Table 8: Global Decorative Lighting Industry Revenue Million Forecast, by End Use 2020 & 2033
- Table 9: Global Decorative Lighting Industry Revenue Million Forecast, by Distribution Channel 2020 & 2033
- Table 10: Global Decorative Lighting Industry Revenue Million Forecast, by Country 2020 & 2033
- Table 11: Global Decorative Lighting Industry Revenue Million Forecast, by Light Source 2020 & 2033
- Table 12: Global Decorative Lighting Industry Revenue Million Forecast, by Product 2020 & 2033
- Table 13: Global Decorative Lighting Industry Revenue Million Forecast, by End Use 2020 & 2033
- Table 14: Global Decorative Lighting Industry Revenue Million Forecast, by Distribution Channel 2020 & 2033
- Table 15: Global Decorative Lighting Industry Revenue Million Forecast, by Country 2020 & 2033
- Table 16: Global Decorative Lighting Industry Revenue Million Forecast, by Light Source 2020 & 2033
- Table 17: Global Decorative Lighting Industry Revenue Million Forecast, by Product 2020 & 2033
- Table 18: Global Decorative Lighting Industry Revenue Million Forecast, by End Use 2020 & 2033
- Table 19: Global Decorative Lighting Industry Revenue Million Forecast, by Distribution Channel 2020 & 2033
- Table 20: Global Decorative Lighting Industry Revenue Million Forecast, by Country 2020 & 2033
- Table 21: Global Decorative Lighting Industry Revenue Million Forecast, by Light Source 2020 & 2033
- Table 22: Global Decorative Lighting Industry Revenue Million Forecast, by Product 2020 & 2033
- Table 23: Global Decorative Lighting Industry Revenue Million Forecast, by End Use 2020 & 2033
- Table 24: Global Decorative Lighting Industry Revenue Million Forecast, by Distribution Channel 2020 & 2033
- Table 25: Global Decorative Lighting Industry Revenue Million Forecast, by Country 2020 & 2033
- Table 26: Global Decorative Lighting Industry Revenue Million Forecast, by Light Source 2020 & 2033
- Table 27: Global Decorative Lighting Industry Revenue Million Forecast, by Product 2020 & 2033
- Table 28: Global Decorative Lighting Industry Revenue Million Forecast, by End Use 2020 & 2033
- Table 29: Global Decorative Lighting Industry Revenue Million Forecast, by Distribution Channel 2020 & 2033
- Table 30: Global Decorative Lighting Industry Revenue Million Forecast, by Country 2020 & 2033
Frequently Asked Questions
1. What is the projected Compound Annual Growth Rate (CAGR) of the Decorative Lighting Industry?
The projected CAGR is approximately 6.75%.
2. Which companies are prominent players in the Decorative Lighting Industry?
Key companies in the market include Acuity Brands Lighting Inc, Columbia, Amerlux, Juno Lighting LLC, Lowe's, GE Lighting, Other Companies (Intense LSI Cree, Osram, ETC, Generation Lighting, Littmann, AZZ Inc, Maxim Lighting.
3. What are the main segments of the Decorative Lighting Industry?
The market segments include Light Source, Product, End Use, Distribution Channel.
4. Can you provide details about the market size?
The market size is estimated to be USD 113.08 Million as of 2022.
5. What are some drivers contributing to market growth?
Technological Advancement booming the industry; Focus on Ergonomics and Comfort.
6. What are the notable trends driving market growth?
LED Source of Lights Dominated the Decorative Lighting Market.
7. Are there any restraints impacting market growth?
High cost; Limited Target Audience.
8. Can you provide examples of recent developments in the market?
N/A
9. What pricing options are available for accessing the report?
Pricing options include single-user, multi-user, and enterprise licenses priced at USD 4750, USD 5250, and USD 8750 respectively.
10. Is the market size provided in terms of value or volume?
The market size is provided in terms of value, measured in Million.
11. Are there any specific market keywords associated with the report?
Yes, the market keyword associated with the report is "Decorative Lighting Industry," which aids in identifying and referencing the specific market segment covered.
12. How do I determine which pricing option suits my needs best?
The pricing options vary based on user requirements and access needs. Individual users may opt for single-user licenses, while businesses requiring broader access may choose multi-user or enterprise licenses for cost-effective access to the report.
13. Are there any additional resources or data provided in the Decorative Lighting Industry report?
While the report offers comprehensive insights, it's advisable to review the specific contents or supplementary materials provided to ascertain if additional resources or data are available.
14. How can I stay updated on further developments or reports in the Decorative Lighting Industry?
To stay informed about further developments, trends, and reports in the Decorative Lighting Industry, consider subscribing to industry newsletters, following relevant companies and organizations, or regularly checking reputable industry news sources and publications.
Methodology
Step 1 - Identification of Relevant Samples Size from Population Database


Step 2 - Approaches for Defining Global Market Size (Value, Volume* & Price*)

Note*: In applicable scenarios
Step 3 - Data Sources
Primary Research
- Web Analytics
- Survey Reports
- Research Institute
- Latest Research Reports
- Opinion Leaders
Secondary Research
- Annual Reports
- White Paper
- Latest Press Release
- Industry Association
- Paid Database
- Investor Presentations

Step 4 - Data Triangulation
Involves using different sources of information in order to increase the validity of a study
These sources are likely to be stakeholders in a program - participants, other researchers, program staff, other community members, and so on.
Then we put all data in single framework & apply various statistical tools to find out the dynamic on the market.
During the analysis stage, feedback from the stakeholder groups would be compared to determine areas of agreement as well as areas of divergence