
Key Insights
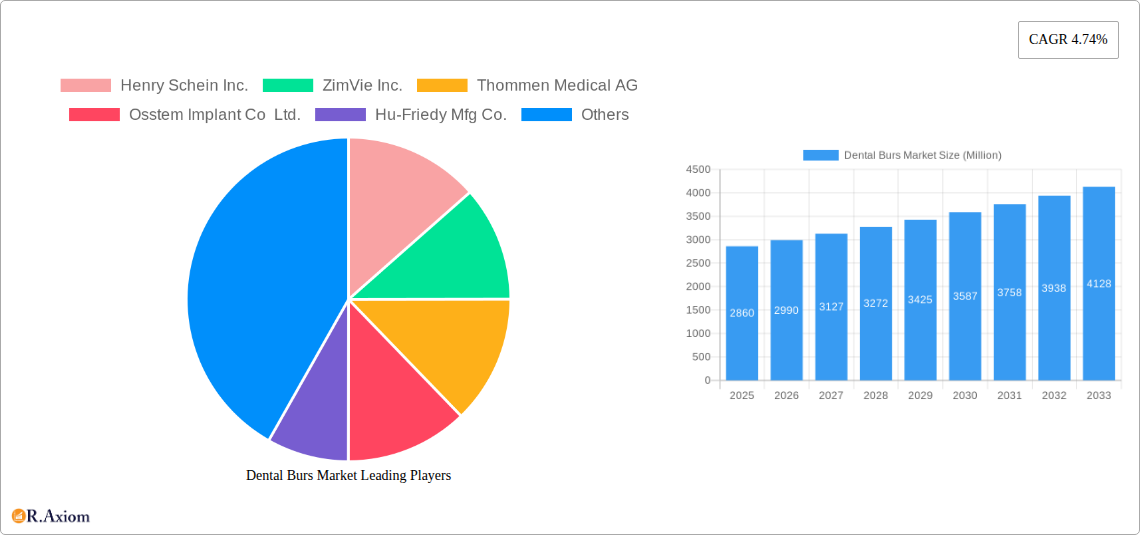
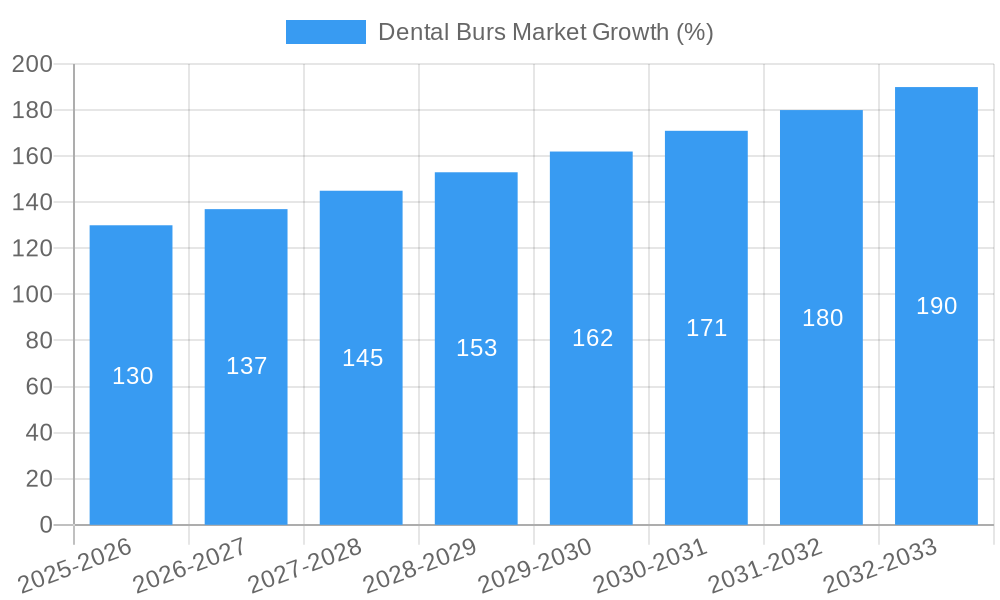
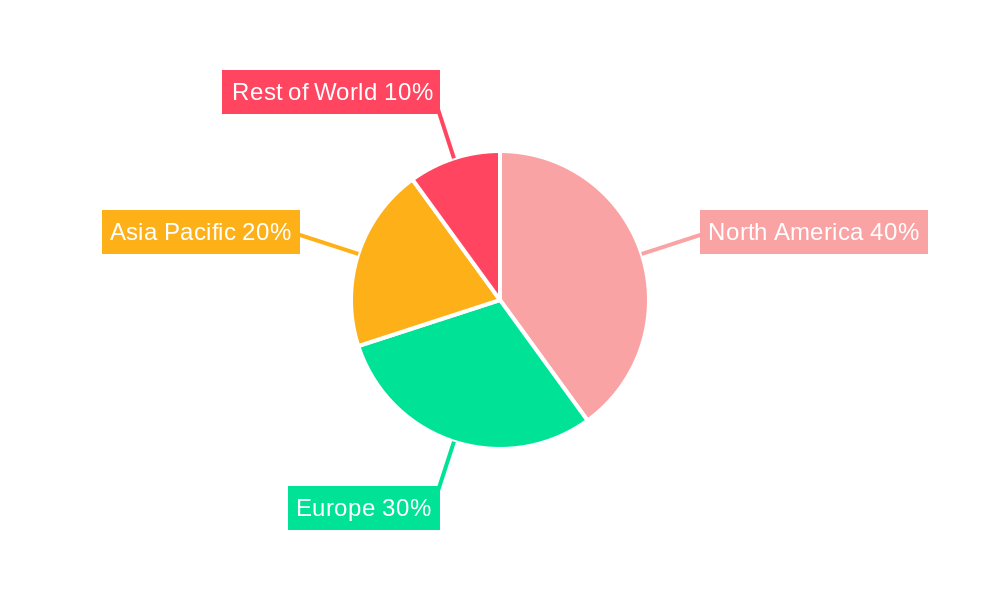
The global dental burs market, valued at approximately $2.86 billion in 2025, is projected to experience robust growth, driven by a compound annual growth rate (CAGR) of 4.74% from 2025 to 2033. This expansion is fueled by several key factors. The rising prevalence of dental caries and periodontal diseases globally necessitates increased restorative and preventative dental procedures, directly boosting demand for dental burs. Technological advancements, such as the introduction of diamond-coated burs and high-speed burs, are enhancing efficiency and precision in dental practices, further stimulating market growth. Moreover, the growing adoption of minimally invasive dental procedures and the increasing focus on cosmetic dentistry are contributing to the market's upward trajectory. The market is segmented by product type (dental burs, whitening materials, dental biomaterials, dental anesthetics, crowns and bridges, dental implants, other product types) and treatment type (orthodontic, endodontic, periodontic, prosthodontic). The North American market currently holds a significant share, driven by advanced healthcare infrastructure and high disposable incomes. However, emerging economies in Asia-Pacific and other regions are expected to witness substantial growth in the coming years due to increasing dental awareness and improving healthcare access. Competitive landscape analysis reveals key players such as Henry Schein Inc., Dentsply Sirona, and 3M Company actively contributing to innovation and market expansion through product development and strategic partnerships. The market faces some restraints, primarily related to stringent regulatory approvals and high initial investment costs associated with advanced technologies. Nevertheless, the overall growth outlook remains positive, with the market projected to surpass $4 billion by 2033.
The continued growth in the dental burs market hinges on several crucial factors. Firstly, the aging global population, combined with improved oral hygiene awareness, leads to a higher incidence of dental issues requiring treatment involving dental burs. Secondly, the expanding dental tourism sector, particularly in regions offering cost-effective dental care, contributes to increased market volume. Thirdly, continuous research and development in dental materials science contribute to the development of improved dental burs with enhanced durability, precision, and longevity. Finally, the increasing availability of dental insurance coverage and government initiatives promoting oral healthcare access further expand the market’s addressable population. However, potential challenges include fluctuating raw material prices, the potential for substitution by alternative dental technologies, and economic downturns impacting healthcare spending. Companies are adapting by focusing on developing sustainable, cost-effective products and exploring new market segments to maintain growth.
Dental Burs Market: A Comprehensive Market Report (2019-2033)
This detailed report provides a comprehensive analysis of the global Dental Burs Market, offering invaluable insights for industry stakeholders, investors, and strategic decision-makers. The study covers the period 2019-2033, with 2025 serving as the base year and the forecast period spanning 2025-2033. The report leverages rigorous data analysis and expert insights to present a holistic view of market dynamics, growth drivers, challenges, and future opportunities. The market size is projected to reach xx Million by 2033, exhibiting a CAGR of xx% during the forecast period.
Dental Burs Market Market Concentration & Innovation
The Dental Burs market exhibits a moderately concentrated landscape, with key players like Henry Schein Inc., Dentsply Sirona, and 3M Company holding significant market share. However, the presence of several smaller, specialized players fosters healthy competition and drives innovation. Market share data for 2024 suggests that the top five players collectively hold approximately xx% of the market, leaving ample room for smaller companies to carve out niches.
Innovation within the dental burs market is largely driven by advancements in materials science, leading to the development of burs with improved durability, cutting efficiency, and reduced heat generation. Regulatory frameworks, primarily governed by national and regional health agencies, influence the adoption of new technologies and materials. Product substitutes, such as laser ablation techniques, present a growing challenge, particularly in specific niche applications. End-user trends, particularly the increasing demand for minimally invasive procedures and improved patient comfort, directly influence product development.
Mergers and acquisitions (M&A) activity in the sector has been relatively moderate in recent years, with deal values predominantly in the range of xx Million to xx Million. Examples include:
- Strategic acquisitions: Several large players have acquired smaller companies to expand their product portfolios and geographic reach.
- Consolidation: The market has witnessed some consolidation efforts, with smaller companies merging to improve their competitive positioning.
Dental Burs Market Industry Trends & Insights
The Dental Burs market is experiencing robust growth, primarily fueled by an aging global population necessitating increased dental care and technological advancements in restorative dentistry. The rising prevalence of dental diseases, coupled with increased awareness of oral hygiene, contributes significantly to market expansion. The market penetration of advanced dental burs is relatively high in developed regions, while developing economies present significant untapped potential.
Technological disruptions, such as the introduction of CAD/CAM technology and 3D printing in dentistry, are influencing the demand for specific types of dental burs, particularly those designed for use with these technologies. Consumer preferences for less invasive treatments and aesthetically pleasing outcomes drive demand for improved materials and design in dental burs. Competitive dynamics are characterized by intense competition among established players and the emergence of new entrants focusing on niche applications or innovative technologies. The overall market exhibits a healthy competitive landscape promoting continuous innovation and improvement in product quality and efficiency.
Dominant Markets & Segments in Dental Burs Market
Regional Dominance: North America currently holds the largest market share in the global dental burs market, followed by Europe and Asia Pacific. This dominance is attributed to several factors:
- High healthcare expenditure: North America has a higher per capita healthcare expenditure, leading to greater investment in dental care infrastructure and technology.
- Advanced dental practices: The region boasts a high density of dental practices equipped with advanced technologies and a well-established dental insurance system.
- High awareness of oral health: A higher level of oral health awareness among the population drives demand for advanced dental procedures and treatments.
Segmental Dominance: Within the Dental Burs market, the "Dental Burs" product type segment naturally holds the largest market share, followed by segments like Crowns and Bridges and Dental Implants. The endodontic treatment segment shows strong growth potential owing to increasing numbers of dental procedures.
Key Drivers for North American Dominance:
- Robust healthcare infrastructure
- High per capita disposable income
- Strong adoption of advanced dental technologies
Key Drivers for European Market:
- Growing awareness of oral health
- Increasing prevalence of dental diseases
- Government initiatives promoting oral health
Key Drivers for Asia-Pacific Market:
- Rising disposable incomes
- Expanding middle class
- Improving dental infrastructure
Dental Burs Market Product Developments
Recent years have witnessed significant advancements in dental burs, focusing on enhanced cutting efficiency, durability, and reduced heat generation. The integration of innovative materials, such as diamond-coated burs and those made from high-performance ceramics, has improved performance and longevity. The development of smaller, more precise burs caters to the growing demand for minimally invasive procedures and improved patient comfort.
Report Scope & Segmentation Analysis
This report segments the Dental Burs market based on Product Type (Dental Burs, Whitening Materials, Dental Biomaterials, Dental Anesthetics, Crowns and Bridges, Dental Implants, Other Product Types) and Treatment (Orthodontic, Endodontic, Periodontic, Prosthodontic). Each segment is analyzed individually, incorporating growth projections, market sizes, and a competitive landscape analysis. For instance, the Dental Burs segment exhibits strong growth driven by technological advancements, while the Crowns and Bridges segment reflects market growth linked to aesthetic dentistry. Similar analyses are provided for each segment to provide a granular understanding of market dynamics.
Key Drivers of Dental Burs Market Growth
The global Dental Burs market is experiencing strong growth, driven by several key factors:
- Technological advancements: Innovation in materials and design lead to improved efficiency and precision.
- Rising prevalence of dental diseases: Growing awareness and a higher incidence of dental issues fuel demand.
- Increasing disposable incomes: Higher spending power, particularly in developing nations, increases access to dental care.
- Favorable regulatory environments: Supportive policies in many countries stimulate market expansion.
Challenges in the Dental Burs Market Sector
The Dental Burs market faces several challenges:
- Stringent regulatory approvals: The lengthy and complex process of obtaining regulatory approvals for new products can hinder market entry.
- Supply chain disruptions: Global supply chain vulnerabilities can impact material availability and manufacturing costs.
- Price pressure from generic products: Competition from lower-cost generic products can impact profitability for manufacturers.
- Economic downturns: Economic recessions can negatively impact healthcare spending and reduce demand for dental services.
Emerging Opportunities in Dental Burs Market
Emerging opportunities in the Dental Burs market include:
- Expansion into emerging markets: Untapped potential exists in developing countries with rising dental care demand.
- Development of specialized burs: Niche applications requiring specific characteristics offer potential for innovation.
- Integration of digital technologies: The integration of digital technologies, such as CAD/CAM, provides opportunities for improvement.
- Focus on sustainable materials: The use of eco-friendly and sustainable materials is gaining traction.
Leading Players in the Dental Burs Market Market
- Henry Schein Inc.
- ZimVie Inc.
- Thommen Medical AG
- Osstem Implant Co Ltd.
- Hu-Friedy Mfg Co.
- Dentsply Sirona
- Ivoclar Vivadent AG
- Ultradent Products Inc.
- 3M Company
- Young Innovations Inc.
- Ziacom Medical
- Nakanishi Inc.
- Jeil Medical Corporation
- Patterson Companies Inc.
Key Developments in Dental Burs Market Industry
June 2022: ZimVie Inc. launched the T3 PRO Tapered Implant and Encode Emergence Healing Abutment in the United States. This launch expanded ZimVie's product portfolio and strengthened its position in the dental implant market.
February 2022: Zimmer Biomet Holdings, Inc. launched OverdenSURE in North America and Europe. This new overdenture attachment system for Zimmer Biomet dental implants enhanced the company's offerings in restorative dentistry.
Strategic Outlook for Dental Burs Market Market
The Dental Burs market is poised for continued growth, driven by technological innovation, increasing awareness of oral health, and expanding access to dental care. Opportunities lie in developing specialized burs for niche applications, integrating advanced materials, and expanding into emerging markets. Companies that invest in research and development, adapt to evolving consumer preferences, and focus on sustainability will be well-positioned to succeed in this dynamic market.
Dental Burs Market Segmentation
-
1. Product Type
- 1.1. Dental Burs
- 1.2. Whitening Materials
- 1.3. Dental Biomaterials
- 1.4. Dental Anesthetics
- 1.5. Crowns and Bridges
- 1.6. Dental Implants
- 1.7. Other Product Types
-
2. Treatment
- 2.1. Orthodontic
- 2.2. Endodontic
- 2.3. Periodontic
- 2.4. Prosthodontic
Dental Burs Market Segmentation By Geography
-
1. North America
- 1.1. United States
- 1.2. Canada
- 1.3. Mexico
-
2. Europe
- 2.1. Germany
- 2.2. United Kingdom
- 2.3. France
- 2.4. Italy
- 2.5. Spain
- 2.6. Rest of Europe
-
3. Asia Pacific
- 3.1. China
- 3.2. Japan
- 3.3. India
- 3.4. Australia
- 3.5. South Korea
- 3.6. Rest of Asia Pacific
-
4. Middle East and Africa
- 4.1. GCC
- 4.2. South Africa
- 4.3. Rest of Middle East and Africa
-
5. South America
- 5.1. Brazil
- 5.2. Argentina
- 5.3. Rest of South America
Dental Burs Market REPORT HIGHLIGHTS
| Aspects | Details |
|---|---|
| Study Period | 2019-2033 |
| Base Year | 2024 |
| Estimated Year | 2025 |
| Forecast Period | 2025-2033 |
| Historical Period | 2019-2024 |
| Growth Rate | CAGR of 4.74% from 2019-2033 |
| Segmentation |
|
Table of Contents
- 1. Introduction
- 1.1. Research Scope
- 1.2. Market Segmentation
- 1.3. Research Methodology
- 1.4. Definitions and Assumptions
- 2. Executive Summary
- 2.1. Introduction
- 3. Market Dynamics
- 3.1. Introduction
- 3.2. Market Drivers
- 3.2.1. Rising Demand for Cosmetic Dentistry; Increasing Incidences of Dental Diseases
- 3.3. Market Restrains
- 3.3.1. High Cost and Limited Reimbursement for Dental Treatments; High Risk and Complications Associated with Dental Bridges and Orthodontic Treatments
- 3.4. Market Trends
- 3.4.1. Dental Implants Expected to Hold Significant Market Share Over the Forecast Period
- 4. Market Factor Analysis
- 4.1. Porters Five Forces
- 4.2. Supply/Value Chain
- 4.3. PESTEL analysis
- 4.4. Market Entropy
- 4.5. Patent/Trademark Analysis
- 5. Global Dental Burs Market Analysis, Insights and Forecast, 2019-2031
- 5.1. Market Analysis, Insights and Forecast - by Product Type
- 5.1.1. Dental Burs
- 5.1.2. Whitening Materials
- 5.1.3. Dental Biomaterials
- 5.1.4. Dental Anesthetics
- 5.1.5. Crowns and Bridges
- 5.1.6. Dental Implants
- 5.1.7. Other Product Types
- 5.2. Market Analysis, Insights and Forecast - by Treatment
- 5.2.1. Orthodontic
- 5.2.2. Endodontic
- 5.2.3. Periodontic
- 5.2.4. Prosthodontic
- 5.3. Market Analysis, Insights and Forecast - by Region
- 5.3.1. North America
- 5.3.2. Europe
- 5.3.3. Asia Pacific
- 5.3.4. Middle East and Africa
- 5.3.5. South America
- 5.1. Market Analysis, Insights and Forecast - by Product Type
- 6. North America Dental Burs Market Analysis, Insights and Forecast, 2019-2031
- 6.1. Market Analysis, Insights and Forecast - by Product Type
- 6.1.1. Dental Burs
- 6.1.2. Whitening Materials
- 6.1.3. Dental Biomaterials
- 6.1.4. Dental Anesthetics
- 6.1.5. Crowns and Bridges
- 6.1.6. Dental Implants
- 6.1.7. Other Product Types
- 6.2. Market Analysis, Insights and Forecast - by Treatment
- 6.2.1. Orthodontic
- 6.2.2. Endodontic
- 6.2.3. Periodontic
- 6.2.4. Prosthodontic
- 6.1. Market Analysis, Insights and Forecast - by Product Type
- 7. Europe Dental Burs Market Analysis, Insights and Forecast, 2019-2031
- 7.1. Market Analysis, Insights and Forecast - by Product Type
- 7.1.1. Dental Burs
- 7.1.2. Whitening Materials
- 7.1.3. Dental Biomaterials
- 7.1.4. Dental Anesthetics
- 7.1.5. Crowns and Bridges
- 7.1.6. Dental Implants
- 7.1.7. Other Product Types
- 7.2. Market Analysis, Insights and Forecast - by Treatment
- 7.2.1. Orthodontic
- 7.2.2. Endodontic
- 7.2.3. Periodontic
- 7.2.4. Prosthodontic
- 7.1. Market Analysis, Insights and Forecast - by Product Type
- 8. Asia Pacific Dental Burs Market Analysis, Insights and Forecast, 2019-2031
- 8.1. Market Analysis, Insights and Forecast - by Product Type
- 8.1.1. Dental Burs
- 8.1.2. Whitening Materials
- 8.1.3. Dental Biomaterials
- 8.1.4. Dental Anesthetics
- 8.1.5. Crowns and Bridges
- 8.1.6. Dental Implants
- 8.1.7. Other Product Types
- 8.2. Market Analysis, Insights and Forecast - by Treatment
- 8.2.1. Orthodontic
- 8.2.2. Endodontic
- 8.2.3. Periodontic
- 8.2.4. Prosthodontic
- 8.1. Market Analysis, Insights and Forecast - by Product Type
- 9. Middle East and Africa Dental Burs Market Analysis, Insights and Forecast, 2019-2031
- 9.1. Market Analysis, Insights and Forecast - by Product Type
- 9.1.1. Dental Burs
- 9.1.2. Whitening Materials
- 9.1.3. Dental Biomaterials
- 9.1.4. Dental Anesthetics
- 9.1.5. Crowns and Bridges
- 9.1.6. Dental Implants
- 9.1.7. Other Product Types
- 9.2. Market Analysis, Insights and Forecast - by Treatment
- 9.2.1. Orthodontic
- 9.2.2. Endodontic
- 9.2.3. Periodontic
- 9.2.4. Prosthodontic
- 9.1. Market Analysis, Insights and Forecast - by Product Type
- 10. South America Dental Burs Market Analysis, Insights and Forecast, 2019-2031
- 10.1. Market Analysis, Insights and Forecast - by Product Type
- 10.1.1. Dental Burs
- 10.1.2. Whitening Materials
- 10.1.3. Dental Biomaterials
- 10.1.4. Dental Anesthetics
- 10.1.5. Crowns and Bridges
- 10.1.6. Dental Implants
- 10.1.7. Other Product Types
- 10.2. Market Analysis, Insights and Forecast - by Treatment
- 10.2.1. Orthodontic
- 10.2.2. Endodontic
- 10.2.3. Periodontic
- 10.2.4. Prosthodontic
- 10.1. Market Analysis, Insights and Forecast - by Product Type
- 11. North Americ Dental Burs Market Analysis, Insights and Forecast, 2019-2031
- 11.1. Market Analysis, Insights and Forecast - By Country/Sub-region
- 11.1.1 United States
- 11.1.2 Canada
- 11.1.3 Mexico
- 12. South America Dental Burs Market Analysis, Insights and Forecast, 2019-2031
- 12.1. Market Analysis, Insights and Forecast - By Country/Sub-region
- 12.1.1 Brazil
- 12.1.2 Mexico
- 12.1.3 Rest of South America
- 13. Europe Dental Burs Market Analysis, Insights and Forecast, 2019-2031
- 13.1. Market Analysis, Insights and Forecast - By Country/Sub-region
- 13.1.1 Germany
- 13.1.2 United Kingdom
- 13.1.3 France
- 13.1.4 Italy
- 13.1.5 Spain
- 13.1.6 Rest of Europe
- 14. Asia Pacific Dental Burs Market Analysis, Insights and Forecast, 2019-2031
- 14.1. Market Analysis, Insights and Forecast - By Country/Sub-region
- 14.1.1 China
- 14.1.2 Japan
- 14.1.3 India
- 14.1.4 South Korea
- 14.1.5 Taiwan
- 14.1.6 Australia
- 14.1.7 Rest of Asia-Pacific
- 15. MEA Dental Burs Market Analysis, Insights and Forecast, 2019-2031
- 15.1. Market Analysis, Insights and Forecast - By Country/Sub-region
- 15.1.1 Middle East
- 15.1.2 Africa
- 16. Competitive Analysis
- 16.1. Global Market Share Analysis 2024
- 16.2. Company Profiles
- 16.2.1 Henry Schein Inc.
- 16.2.1.1. Overview
- 16.2.1.2. Products
- 16.2.1.3. SWOT Analysis
- 16.2.1.4. Recent Developments
- 16.2.1.5. Financials (Based on Availability)
- 16.2.2 ZimVie Inc.
- 16.2.2.1. Overview
- 16.2.2.2. Products
- 16.2.2.3. SWOT Analysis
- 16.2.2.4. Recent Developments
- 16.2.2.5. Financials (Based on Availability)
- 16.2.3 Thommen Medical AG
- 16.2.3.1. Overview
- 16.2.3.2. Products
- 16.2.3.3. SWOT Analysis
- 16.2.3.4. Recent Developments
- 16.2.3.5. Financials (Based on Availability)
- 16.2.4 Osstem Implant Co Ltd.
- 16.2.4.1. Overview
- 16.2.4.2. Products
- 16.2.4.3. SWOT Analysis
- 16.2.4.4. Recent Developments
- 16.2.4.5. Financials (Based on Availability)
- 16.2.5 Hu-Friedy Mfg Co.
- 16.2.5.1. Overview
- 16.2.5.2. Products
- 16.2.5.3. SWOT Analysis
- 16.2.5.4. Recent Developments
- 16.2.5.5. Financials (Based on Availability)
- 16.2.6 Dentsply Sirona
- 16.2.6.1. Overview
- 16.2.6.2. Products
- 16.2.6.3. SWOT Analysis
- 16.2.6.4. Recent Developments
- 16.2.6.5. Financials (Based on Availability)
- 16.2.7 Ivoclar Vivadent AG
- 16.2.7.1. Overview
- 16.2.7.2. Products
- 16.2.7.3. SWOT Analysis
- 16.2.7.4. Recent Developments
- 16.2.7.5. Financials (Based on Availability)
- 16.2.8 Ultradent Products Inc.
- 16.2.8.1. Overview
- 16.2.8.2. Products
- 16.2.8.3. SWOT Analysis
- 16.2.8.4. Recent Developments
- 16.2.8.5. Financials (Based on Availability)
- 16.2.9 3M Company
- 16.2.9.1. Overview
- 16.2.9.2. Products
- 16.2.9.3. SWOT Analysis
- 16.2.9.4. Recent Developments
- 16.2.9.5. Financials (Based on Availability)
- 16.2.10 Young Innovations Inc.
- 16.2.10.1. Overview
- 16.2.10.2. Products
- 16.2.10.3. SWOT Analysis
- 16.2.10.4. Recent Developments
- 16.2.10.5. Financials (Based on Availability)
- 16.2.11 Ziacom Medical
- 16.2.11.1. Overview
- 16.2.11.2. Products
- 16.2.11.3. SWOT Analysis
- 16.2.11.4. Recent Developments
- 16.2.11.5. Financials (Based on Availability)
- 16.2.12 Nakanishi Inc.
- 16.2.12.1. Overview
- 16.2.12.2. Products
- 16.2.12.3. SWOT Analysis
- 16.2.12.4. Recent Developments
- 16.2.12.5. Financials (Based on Availability)
- 16.2.13 Jeil Medical Corporation
- 16.2.13.1. Overview
- 16.2.13.2. Products
- 16.2.13.3. SWOT Analysis
- 16.2.13.4. Recent Developments
- 16.2.13.5. Financials (Based on Availability)
- 16.2.14 Patterson Companies Inc.
- 16.2.14.1. Overview
- 16.2.14.2. Products
- 16.2.14.3. SWOT Analysis
- 16.2.14.4. Recent Developments
- 16.2.14.5. Financials (Based on Availability)
- 16.2.1 Henry Schein Inc.
List of Figures
- Figure 1: Global Dental Burs Market Revenue Breakdown (Million, %) by Region 2024 & 2032
- Figure 2: Global Dental Burs Market Volume Breakdown (K Units, %) by Region 2024 & 2032
- Figure 3: North Americ Dental Burs Market Revenue (Million), by Country 2024 & 2032
- Figure 4: North Americ Dental Burs Market Volume (K Units), by Country 2024 & 2032
- Figure 5: North Americ Dental Burs Market Revenue Share (%), by Country 2024 & 2032
- Figure 6: North Americ Dental Burs Market Volume Share (%), by Country 2024 & 2032
- Figure 7: South America Dental Burs Market Revenue (Million), by Country 2024 & 2032
- Figure 8: South America Dental Burs Market Volume (K Units), by Country 2024 & 2032
- Figure 9: South America Dental Burs Market Revenue Share (%), by Country 2024 & 2032
- Figure 10: South America Dental Burs Market Volume Share (%), by Country 2024 & 2032
- Figure 11: Europe Dental Burs Market Revenue (Million), by Country 2024 & 2032
- Figure 12: Europe Dental Burs Market Volume (K Units), by Country 2024 & 2032
- Figure 13: Europe Dental Burs Market Revenue Share (%), by Country 2024 & 2032
- Figure 14: Europe Dental Burs Market Volume Share (%), by Country 2024 & 2032
- Figure 15: Asia Pacific Dental Burs Market Revenue (Million), by Country 2024 & 2032
- Figure 16: Asia Pacific Dental Burs Market Volume (K Units), by Country 2024 & 2032
- Figure 17: Asia Pacific Dental Burs Market Revenue Share (%), by Country 2024 & 2032
- Figure 18: Asia Pacific Dental Burs Market Volume Share (%), by Country 2024 & 2032
- Figure 19: MEA Dental Burs Market Revenue (Million), by Country 2024 & 2032
- Figure 20: MEA Dental Burs Market Volume (K Units), by Country 2024 & 2032
- Figure 21: MEA Dental Burs Market Revenue Share (%), by Country 2024 & 2032
- Figure 22: MEA Dental Burs Market Volume Share (%), by Country 2024 & 2032
- Figure 23: North America Dental Burs Market Revenue (Million), by Product Type 2024 & 2032
- Figure 24: North America Dental Burs Market Volume (K Units), by Product Type 2024 & 2032
- Figure 25: North America Dental Burs Market Revenue Share (%), by Product Type 2024 & 2032
- Figure 26: North America Dental Burs Market Volume Share (%), by Product Type 2024 & 2032
- Figure 27: North America Dental Burs Market Revenue (Million), by Treatment 2024 & 2032
- Figure 28: North America Dental Burs Market Volume (K Units), by Treatment 2024 & 2032
- Figure 29: North America Dental Burs Market Revenue Share (%), by Treatment 2024 & 2032
- Figure 30: North America Dental Burs Market Volume Share (%), by Treatment 2024 & 2032
- Figure 31: North America Dental Burs Market Revenue (Million), by Country 2024 & 2032
- Figure 32: North America Dental Burs Market Volume (K Units), by Country 2024 & 2032
- Figure 33: North America Dental Burs Market Revenue Share (%), by Country 2024 & 2032
- Figure 34: North America Dental Burs Market Volume Share (%), by Country 2024 & 2032
- Figure 35: Europe Dental Burs Market Revenue (Million), by Product Type 2024 & 2032
- Figure 36: Europe Dental Burs Market Volume (K Units), by Product Type 2024 & 2032
- Figure 37: Europe Dental Burs Market Revenue Share (%), by Product Type 2024 & 2032
- Figure 38: Europe Dental Burs Market Volume Share (%), by Product Type 2024 & 2032
- Figure 39: Europe Dental Burs Market Revenue (Million), by Treatment 2024 & 2032
- Figure 40: Europe Dental Burs Market Volume (K Units), by Treatment 2024 & 2032
- Figure 41: Europe Dental Burs Market Revenue Share (%), by Treatment 2024 & 2032
- Figure 42: Europe Dental Burs Market Volume Share (%), by Treatment 2024 & 2032
- Figure 43: Europe Dental Burs Market Revenue (Million), by Country 2024 & 2032
- Figure 44: Europe Dental Burs Market Volume (K Units), by Country 2024 & 2032
- Figure 45: Europe Dental Burs Market Revenue Share (%), by Country 2024 & 2032
- Figure 46: Europe Dental Burs Market Volume Share (%), by Country 2024 & 2032
- Figure 47: Asia Pacific Dental Burs Market Revenue (Million), by Product Type 2024 & 2032
- Figure 48: Asia Pacific Dental Burs Market Volume (K Units), by Product Type 2024 & 2032
- Figure 49: Asia Pacific Dental Burs Market Revenue Share (%), by Product Type 2024 & 2032
- Figure 50: Asia Pacific Dental Burs Market Volume Share (%), by Product Type 2024 & 2032
- Figure 51: Asia Pacific Dental Burs Market Revenue (Million), by Treatment 2024 & 2032
- Figure 52: Asia Pacific Dental Burs Market Volume (K Units), by Treatment 2024 & 2032
- Figure 53: Asia Pacific Dental Burs Market Revenue Share (%), by Treatment 2024 & 2032
- Figure 54: Asia Pacific Dental Burs Market Volume Share (%), by Treatment 2024 & 2032
- Figure 55: Asia Pacific Dental Burs Market Revenue (Million), by Country 2024 & 2032
- Figure 56: Asia Pacific Dental Burs Market Volume (K Units), by Country 2024 & 2032
- Figure 57: Asia Pacific Dental Burs Market Revenue Share (%), by Country 2024 & 2032
- Figure 58: Asia Pacific Dental Burs Market Volume Share (%), by Country 2024 & 2032
- Figure 59: Middle East and Africa Dental Burs Market Revenue (Million), by Product Type 2024 & 2032
- Figure 60: Middle East and Africa Dental Burs Market Volume (K Units), by Product Type 2024 & 2032
- Figure 61: Middle East and Africa Dental Burs Market Revenue Share (%), by Product Type 2024 & 2032
- Figure 62: Middle East and Africa Dental Burs Market Volume Share (%), by Product Type 2024 & 2032
- Figure 63: Middle East and Africa Dental Burs Market Revenue (Million), by Treatment 2024 & 2032
- Figure 64: Middle East and Africa Dental Burs Market Volume (K Units), by Treatment 2024 & 2032
- Figure 65: Middle East and Africa Dental Burs Market Revenue Share (%), by Treatment 2024 & 2032
- Figure 66: Middle East and Africa Dental Burs Market Volume Share (%), by Treatment 2024 & 2032
- Figure 67: Middle East and Africa Dental Burs Market Revenue (Million), by Country 2024 & 2032
- Figure 68: Middle East and Africa Dental Burs Market Volume (K Units), by Country 2024 & 2032
- Figure 69: Middle East and Africa Dental Burs Market Revenue Share (%), by Country 2024 & 2032
- Figure 70: Middle East and Africa Dental Burs Market Volume Share (%), by Country 2024 & 2032
- Figure 71: South America Dental Burs Market Revenue (Million), by Product Type 2024 & 2032
- Figure 72: South America Dental Burs Market Volume (K Units), by Product Type 2024 & 2032
- Figure 73: South America Dental Burs Market Revenue Share (%), by Product Type 2024 & 2032
- Figure 74: South America Dental Burs Market Volume Share (%), by Product Type 2024 & 2032
- Figure 75: South America Dental Burs Market Revenue (Million), by Treatment 2024 & 2032
- Figure 76: South America Dental Burs Market Volume (K Units), by Treatment 2024 & 2032
- Figure 77: South America Dental Burs Market Revenue Share (%), by Treatment 2024 & 2032
- Figure 78: South America Dental Burs Market Volume Share (%), by Treatment 2024 & 2032
- Figure 79: South America Dental Burs Market Revenue (Million), by Country 2024 & 2032
- Figure 80: South America Dental Burs Market Volume (K Units), by Country 2024 & 2032
- Figure 81: South America Dental Burs Market Revenue Share (%), by Country 2024 & 2032
- Figure 82: South America Dental Burs Market Volume Share (%), by Country 2024 & 2032
List of Tables
- Table 1: Global Dental Burs Market Revenue Million Forecast, by Region 2019 & 2032
- Table 2: Global Dental Burs Market Volume K Units Forecast, by Region 2019 & 2032
- Table 3: Global Dental Burs Market Revenue Million Forecast, by Product Type 2019 & 2032
- Table 4: Global Dental Burs Market Volume K Units Forecast, by Product Type 2019 & 2032
- Table 5: Global Dental Burs Market Revenue Million Forecast, by Treatment 2019 & 2032
- Table 6: Global Dental Burs Market Volume K Units Forecast, by Treatment 2019 & 2032
- Table 7: Global Dental Burs Market Revenue Million Forecast, by Region 2019 & 2032
- Table 8: Global Dental Burs Market Volume K Units Forecast, by Region 2019 & 2032
- Table 9: Global Dental Burs Market Revenue Million Forecast, by Country 2019 & 2032
- Table 10: Global Dental Burs Market Volume K Units Forecast, by Country 2019 & 2032
- Table 11: United States Dental Burs Market Revenue (Million) Forecast, by Application 2019 & 2032
- Table 12: United States Dental Burs Market Volume (K Units) Forecast, by Application 2019 & 2032
- Table 13: Canada Dental Burs Market Revenue (Million) Forecast, by Application 2019 & 2032
- Table 14: Canada Dental Burs Market Volume (K Units) Forecast, by Application 2019 & 2032
- Table 15: Mexico Dental Burs Market Revenue (Million) Forecast, by Application 2019 & 2032
- Table 16: Mexico Dental Burs Market Volume (K Units) Forecast, by Application 2019 & 2032
- Table 17: Global Dental Burs Market Revenue Million Forecast, by Country 2019 & 2032
- Table 18: Global Dental Burs Market Volume K Units Forecast, by Country 2019 & 2032
- Table 19: Brazil Dental Burs Market Revenue (Million) Forecast, by Application 2019 & 2032
- Table 20: Brazil Dental Burs Market Volume (K Units) Forecast, by Application 2019 & 2032
- Table 21: Mexico Dental Burs Market Revenue (Million) Forecast, by Application 2019 & 2032
- Table 22: Mexico Dental Burs Market Volume (K Units) Forecast, by Application 2019 & 2032
- Table 23: Rest of South America Dental Burs Market Revenue (Million) Forecast, by Application 2019 & 2032
- Table 24: Rest of South America Dental Burs Market Volume (K Units) Forecast, by Application 2019 & 2032
- Table 25: Global Dental Burs Market Revenue Million Forecast, by Country 2019 & 2032
- Table 26: Global Dental Burs Market Volume K Units Forecast, by Country 2019 & 2032
- Table 27: Germany Dental Burs Market Revenue (Million) Forecast, by Application 2019 & 2032
- Table 28: Germany Dental Burs Market Volume (K Units) Forecast, by Application 2019 & 2032
- Table 29: United Kingdom Dental Burs Market Revenue (Million) Forecast, by Application 2019 & 2032
- Table 30: United Kingdom Dental Burs Market Volume (K Units) Forecast, by Application 2019 & 2032
- Table 31: France Dental Burs Market Revenue (Million) Forecast, by Application 2019 & 2032
- Table 32: France Dental Burs Market Volume (K Units) Forecast, by Application 2019 & 2032
- Table 33: Italy Dental Burs Market Revenue (Million) Forecast, by Application 2019 & 2032
- Table 34: Italy Dental Burs Market Volume (K Units) Forecast, by Application 2019 & 2032
- Table 35: Spain Dental Burs Market Revenue (Million) Forecast, by Application 2019 & 2032
- Table 36: Spain Dental Burs Market Volume (K Units) Forecast, by Application 2019 & 2032
- Table 37: Rest of Europe Dental Burs Market Revenue (Million) Forecast, by Application 2019 & 2032
- Table 38: Rest of Europe Dental Burs Market Volume (K Units) Forecast, by Application 2019 & 2032
- Table 39: Global Dental Burs Market Revenue Million Forecast, by Country 2019 & 2032
- Table 40: Global Dental Burs Market Volume K Units Forecast, by Country 2019 & 2032
- Table 41: China Dental Burs Market Revenue (Million) Forecast, by Application 2019 & 2032
- Table 42: China Dental Burs Market Volume (K Units) Forecast, by Application 2019 & 2032
- Table 43: Japan Dental Burs Market Revenue (Million) Forecast, by Application 2019 & 2032
- Table 44: Japan Dental Burs Market Volume (K Units) Forecast, by Application 2019 & 2032
- Table 45: India Dental Burs Market Revenue (Million) Forecast, by Application 2019 & 2032
- Table 46: India Dental Burs Market Volume (K Units) Forecast, by Application 2019 & 2032
- Table 47: South Korea Dental Burs Market Revenue (Million) Forecast, by Application 2019 & 2032
- Table 48: South Korea Dental Burs Market Volume (K Units) Forecast, by Application 2019 & 2032
- Table 49: Taiwan Dental Burs Market Revenue (Million) Forecast, by Application 2019 & 2032
- Table 50: Taiwan Dental Burs Market Volume (K Units) Forecast, by Application 2019 & 2032
- Table 51: Australia Dental Burs Market Revenue (Million) Forecast, by Application 2019 & 2032
- Table 52: Australia Dental Burs Market Volume (K Units) Forecast, by Application 2019 & 2032
- Table 53: Rest of Asia-Pacific Dental Burs Market Revenue (Million) Forecast, by Application 2019 & 2032
- Table 54: Rest of Asia-Pacific Dental Burs Market Volume (K Units) Forecast, by Application 2019 & 2032
- Table 55: Global Dental Burs Market Revenue Million Forecast, by Country 2019 & 2032
- Table 56: Global Dental Burs Market Volume K Units Forecast, by Country 2019 & 2032
- Table 57: Middle East Dental Burs Market Revenue (Million) Forecast, by Application 2019 & 2032
- Table 58: Middle East Dental Burs Market Volume (K Units) Forecast, by Application 2019 & 2032
- Table 59: Africa Dental Burs Market Revenue (Million) Forecast, by Application 2019 & 2032
- Table 60: Africa Dental Burs Market Volume (K Units) Forecast, by Application 2019 & 2032
- Table 61: Global Dental Burs Market Revenue Million Forecast, by Product Type 2019 & 2032
- Table 62: Global Dental Burs Market Volume K Units Forecast, by Product Type 2019 & 2032
- Table 63: Global Dental Burs Market Revenue Million Forecast, by Treatment 2019 & 2032
- Table 64: Global Dental Burs Market Volume K Units Forecast, by Treatment 2019 & 2032
- Table 65: Global Dental Burs Market Revenue Million Forecast, by Country 2019 & 2032
- Table 66: Global Dental Burs Market Volume K Units Forecast, by Country 2019 & 2032
- Table 67: United States Dental Burs Market Revenue (Million) Forecast, by Application 2019 & 2032
- Table 68: United States Dental Burs Market Volume (K Units) Forecast, by Application 2019 & 2032
- Table 69: Canada Dental Burs Market Revenue (Million) Forecast, by Application 2019 & 2032
- Table 70: Canada Dental Burs Market Volume (K Units) Forecast, by Application 2019 & 2032
- Table 71: Mexico Dental Burs Market Revenue (Million) Forecast, by Application 2019 & 2032
- Table 72: Mexico Dental Burs Market Volume (K Units) Forecast, by Application 2019 & 2032
- Table 73: Global Dental Burs Market Revenue Million Forecast, by Product Type 2019 & 2032
- Table 74: Global Dental Burs Market Volume K Units Forecast, by Product Type 2019 & 2032
- Table 75: Global Dental Burs Market Revenue Million Forecast, by Treatment 2019 & 2032
- Table 76: Global Dental Burs Market Volume K Units Forecast, by Treatment 2019 & 2032
- Table 77: Global Dental Burs Market Revenue Million Forecast, by Country 2019 & 2032
- Table 78: Global Dental Burs Market Volume K Units Forecast, by Country 2019 & 2032
- Table 79: Germany Dental Burs Market Revenue (Million) Forecast, by Application 2019 & 2032
- Table 80: Germany Dental Burs Market Volume (K Units) Forecast, by Application 2019 & 2032
- Table 81: United Kingdom Dental Burs Market Revenue (Million) Forecast, by Application 2019 & 2032
- Table 82: United Kingdom Dental Burs Market Volume (K Units) Forecast, by Application 2019 & 2032
- Table 83: France Dental Burs Market Revenue (Million) Forecast, by Application 2019 & 2032
- Table 84: France Dental Burs Market Volume (K Units) Forecast, by Application 2019 & 2032
- Table 85: Italy Dental Burs Market Revenue (Million) Forecast, by Application 2019 & 2032
- Table 86: Italy Dental Burs Market Volume (K Units) Forecast, by Application 2019 & 2032
- Table 87: Spain Dental Burs Market Revenue (Million) Forecast, by Application 2019 & 2032
- Table 88: Spain Dental Burs Market Volume (K Units) Forecast, by Application 2019 & 2032
- Table 89: Rest of Europe Dental Burs Market Revenue (Million) Forecast, by Application 2019 & 2032
- Table 90: Rest of Europe Dental Burs Market Volume (K Units) Forecast, by Application 2019 & 2032
- Table 91: Global Dental Burs Market Revenue Million Forecast, by Product Type 2019 & 2032
- Table 92: Global Dental Burs Market Volume K Units Forecast, by Product Type 2019 & 2032
- Table 93: Global Dental Burs Market Revenue Million Forecast, by Treatment 2019 & 2032
- Table 94: Global Dental Burs Market Volume K Units Forecast, by Treatment 2019 & 2032
- Table 95: Global Dental Burs Market Revenue Million Forecast, by Country 2019 & 2032
- Table 96: Global Dental Burs Market Volume K Units Forecast, by Country 2019 & 2032
- Table 97: China Dental Burs Market Revenue (Million) Forecast, by Application 2019 & 2032
- Table 98: China Dental Burs Market Volume (K Units) Forecast, by Application 2019 & 2032
- Table 99: Japan Dental Burs Market Revenue (Million) Forecast, by Application 2019 & 2032
- Table 100: Japan Dental Burs Market Volume (K Units) Forecast, by Application 2019 & 2032
- Table 101: India Dental Burs Market Revenue (Million) Forecast, by Application 2019 & 2032
- Table 102: India Dental Burs Market Volume (K Units) Forecast, by Application 2019 & 2032
- Table 103: Australia Dental Burs Market Revenue (Million) Forecast, by Application 2019 & 2032
- Table 104: Australia Dental Burs Market Volume (K Units) Forecast, by Application 2019 & 2032
- Table 105: South Korea Dental Burs Market Revenue (Million) Forecast, by Application 2019 & 2032
- Table 106: South Korea Dental Burs Market Volume (K Units) Forecast, by Application 2019 & 2032
- Table 107: Rest of Asia Pacific Dental Burs Market Revenue (Million) Forecast, by Application 2019 & 2032
- Table 108: Rest of Asia Pacific Dental Burs Market Volume (K Units) Forecast, by Application 2019 & 2032
- Table 109: Global Dental Burs Market Revenue Million Forecast, by Product Type 2019 & 2032
- Table 110: Global Dental Burs Market Volume K Units Forecast, by Product Type 2019 & 2032
- Table 111: Global Dental Burs Market Revenue Million Forecast, by Treatment 2019 & 2032
- Table 112: Global Dental Burs Market Volume K Units Forecast, by Treatment 2019 & 2032
- Table 113: Global Dental Burs Market Revenue Million Forecast, by Country 2019 & 2032
- Table 114: Global Dental Burs Market Volume K Units Forecast, by Country 2019 & 2032
- Table 115: GCC Dental Burs Market Revenue (Million) Forecast, by Application 2019 & 2032
- Table 116: GCC Dental Burs Market Volume (K Units) Forecast, by Application 2019 & 2032
- Table 117: South Africa Dental Burs Market Revenue (Million) Forecast, by Application 2019 & 2032
- Table 118: South Africa Dental Burs Market Volume (K Units) Forecast, by Application 2019 & 2032
- Table 119: Rest of Middle East and Africa Dental Burs Market Revenue (Million) Forecast, by Application 2019 & 2032
- Table 120: Rest of Middle East and Africa Dental Burs Market Volume (K Units) Forecast, by Application 2019 & 2032
- Table 121: Global Dental Burs Market Revenue Million Forecast, by Product Type 2019 & 2032
- Table 122: Global Dental Burs Market Volume K Units Forecast, by Product Type 2019 & 2032
- Table 123: Global Dental Burs Market Revenue Million Forecast, by Treatment 2019 & 2032
- Table 124: Global Dental Burs Market Volume K Units Forecast, by Treatment 2019 & 2032
- Table 125: Global Dental Burs Market Revenue Million Forecast, by Country 2019 & 2032
- Table 126: Global Dental Burs Market Volume K Units Forecast, by Country 2019 & 2032
- Table 127: Brazil Dental Burs Market Revenue (Million) Forecast, by Application 2019 & 2032
- Table 128: Brazil Dental Burs Market Volume (K Units) Forecast, by Application 2019 & 2032
- Table 129: Argentina Dental Burs Market Revenue (Million) Forecast, by Application 2019 & 2032
- Table 130: Argentina Dental Burs Market Volume (K Units) Forecast, by Application 2019 & 2032
- Table 131: Rest of South America Dental Burs Market Revenue (Million) Forecast, by Application 2019 & 2032
- Table 132: Rest of South America Dental Burs Market Volume (K Units) Forecast, by Application 2019 & 2032
Frequently Asked Questions
1. What is the projected Compound Annual Growth Rate (CAGR) of the Dental Burs Market?
The projected CAGR is approximately 4.74%.
2. Which companies are prominent players in the Dental Burs Market?
Key companies in the market include Henry Schein Inc., ZimVie Inc., Thommen Medical AG, Osstem Implant Co Ltd., Hu-Friedy Mfg Co., Dentsply Sirona, Ivoclar Vivadent AG, Ultradent Products Inc., 3M Company, Young Innovations Inc., Ziacom Medical, Nakanishi Inc., Jeil Medical Corporation, Patterson Companies Inc..
3. What are the main segments of the Dental Burs Market?
The market segments include Product Type, Treatment.
4. Can you provide details about the market size?
The market size is estimated to be USD 2.86 Million as of 2022.
5. What are some drivers contributing to market growth?
Rising Demand for Cosmetic Dentistry; Increasing Incidences of Dental Diseases.
6. What are the notable trends driving market growth?
Dental Implants Expected to Hold Significant Market Share Over the Forecast Period.
7. Are there any restraints impacting market growth?
High Cost and Limited Reimbursement for Dental Treatments; High Risk and Complications Associated with Dental Bridges and Orthodontic Treatments.
8. Can you provide examples of recent developments in the market?
In June 2022, ZimVie Inc. launched the T3 PRO Tapered Implant and Encode Emergence Healing Abutment in the United States.
9. What pricing options are available for accessing the report?
Pricing options include single-user, multi-user, and enterprise licenses priced at USD 4750, USD 5250, and USD 8750 respectively.
10. Is the market size provided in terms of value or volume?
The market size is provided in terms of value, measured in Million and volume, measured in K Units.
11. Are there any specific market keywords associated with the report?
Yes, the market keyword associated with the report is "Dental Burs Market," which aids in identifying and referencing the specific market segment covered.
12. How do I determine which pricing option suits my needs best?
The pricing options vary based on user requirements and access needs. Individual users may opt for single-user licenses, while businesses requiring broader access may choose multi-user or enterprise licenses for cost-effective access to the report.
13. Are there any additional resources or data provided in the Dental Burs Market report?
While the report offers comprehensive insights, it's advisable to review the specific contents or supplementary materials provided to ascertain if additional resources or data are available.
14. How can I stay updated on further developments or reports in the Dental Burs Market?
To stay informed about further developments, trends, and reports in the Dental Burs Market, consider subscribing to industry newsletters, following relevant companies and organizations, or regularly checking reputable industry news sources and publications.
Methodology
Step 1 - Identification of Relevant Samples Size from Population Database


Step 2 - Approaches for Defining Global Market Size (Value, Volume* & Price*)

Note*: In applicable scenarios
Step 3 - Data Sources
Primary Research
- Web Analytics
- Survey Reports
- Research Institute
- Latest Research Reports
- Opinion Leaders
Secondary Research
- Annual Reports
- White Paper
- Latest Press Release
- Industry Association
- Paid Database
- Investor Presentations

Step 4 - Data Triangulation
Involves using different sources of information in order to increase the validity of a study
These sources are likely to be stakeholders in a program - participants, other researchers, program staff, other community members, and so on.
Then we put all data in single framework & apply various statistical tools to find out the dynamic on the market.
During the analysis stage, feedback from the stakeholder groups would be compared to determine areas of agreement as well as areas of divergence


