


Key Insights
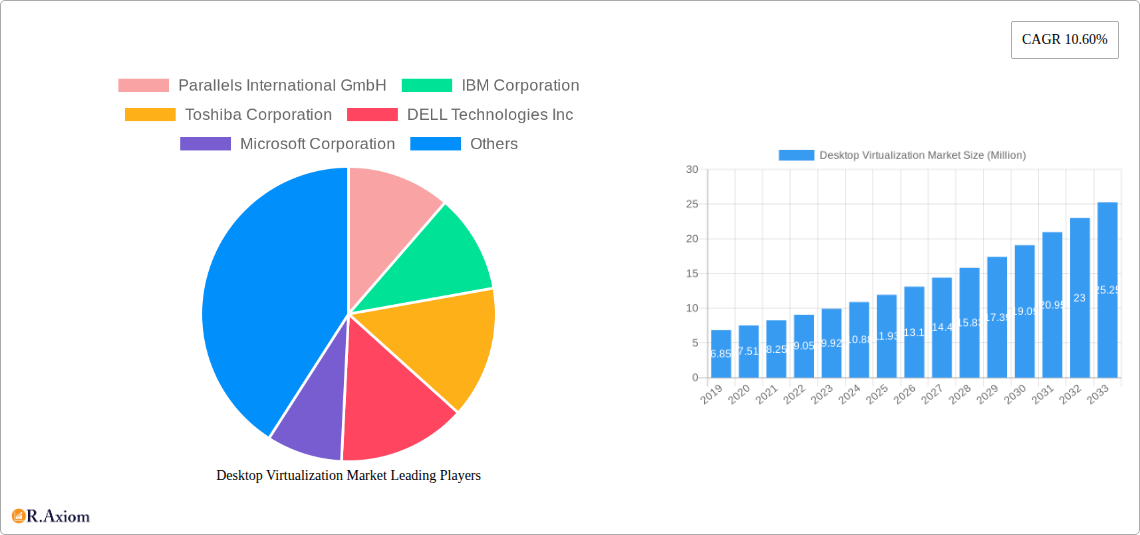
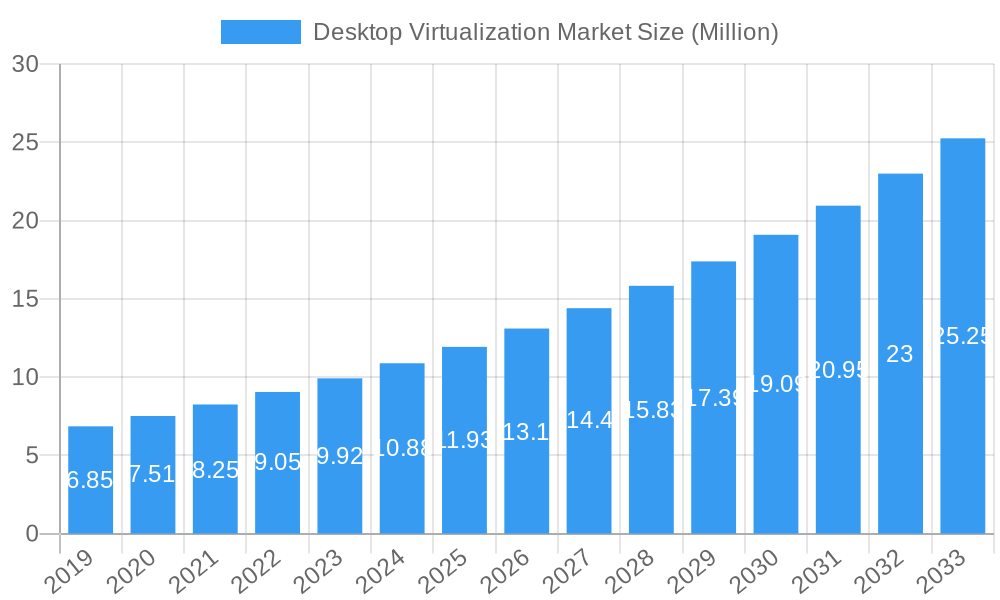
The Desktop Virtualization Market is poised for substantial expansion, projected to reach $13.79 Billion by 2033, exhibiting a robust Compound Annual Growth Rate (CAGR) of 10.60%. This significant growth trajectory is primarily fueled by the escalating demand for flexible and secure work environments, accelerated by the widespread adoption of remote and hybrid work models. Key drivers include the imperative for enhanced data security, reduced IT operational costs through centralized management, and improved employee productivity via seamless access to applications and data from any device. The increasing adoption of cloud-based solutions for desktop delivery is a major trend, offering scalability and cost-effectiveness that traditional on-premise deployments struggle to match. Furthermore, the continuous innovation in virtualization technologies, coupled with the growing need for BYOD (Bring Your Own Device) support and stringent regulatory compliance across various industries, are collectively propelling market growth.
Desktop Virtualization Market Market Size (In Million)

The market is segmented across various delivery platforms, including Hosted Virtual Desktops (HVD) and Hosted Shared Desktops (HSD), with HVD expected to see particularly strong adoption due to its enhanced personalization and security features. Deployment modes are bifurcated between on-premise and cloud, with the cloud segment anticipated to dominate due to its inherent agility and reduced capital expenditure. Leading end-user verticals such as Financial Services, Healthcare, and IT & Telecommunications are at the forefront of adopting desktop virtualization to safeguard sensitive data and improve operational efficiency. While the market presents immense opportunities, certain restraints like initial implementation costs and potential latency issues in high-latency networks need to be addressed. However, ongoing technological advancements and strategic partnerships among key players are actively mitigating these challenges, paving the way for sustained market growth.
Desktop Virtualization Market Company Market Share
This in-depth report provides a comprehensive analysis of the global Desktop Virtualization Market, offering critical insights for stakeholders navigating this dynamic landscape. Covering the historical period from 2019 to 2024, the base year of 2025, and a robust forecast period extending to 2033, this study delivers actionable intelligence on market size, growth drivers, competitive strategies, and emerging trends. Our analysis is segmented across key dimensions including Desktop Delivery Platform (Hosted Virtual Desktop (HVD), Hosted Shared Desktop (HSD), Other Desktop Delivery Forms), Deployment Mode (On-premise, Cloud), and End-User Verticals (Financial Services, Healthcare, Manufacturing, IT & Telecommunications, Other End-User Verticals).
Desktop Virtualization Market Market Concentration & Innovation
The Desktop Virtualization Market exhibits a moderate to high level of concentration, with a few key players dominating significant market share. Innovation remains a primary driver, fueled by the relentless pursuit of enhanced security, improved user experience, and greater cost-efficiency. Regulatory frameworks, particularly concerning data privacy and compliance in sectors like Healthcare and Financial Services, play a crucial role in shaping product development and deployment strategies. The emergence of robust product substitutes, such as advanced remote collaboration tools, necessitates continuous innovation in VDI solutions to maintain competitive advantage. End-user trends, including the widespread adoption of hybrid work models and BYOD policies, are accelerating demand for flexible and secure desktop virtualization. Mergers and Acquisitions (M&A) activities are prevalent, with strategic consolidations aimed at expanding product portfolios, acquiring new technologies, and increasing market reach. Deal values in the past year have been in the range of hundreds of millions to over a billion dollars.
- Key Innovation Drivers:
- AI and Machine Learning for performance optimization and predictive maintenance.
- Enhanced security features for data protection and threat mitigation.
- Cloud-native VDI solutions for scalability and flexibility.
- Improved user experience through high-definition graphics and low latency.
- Market Concentration Metrics:
- Top 5 vendors hold approximately 60% of the global market share.
- M&A deal values reaching upwards of $1,500 Million in recent years.
Desktop Virtualization Market Industry Trends & Insights
The Desktop Virtualization Market is experiencing substantial growth, propelled by an escalating demand for flexible, secure, and cost-effective IT infrastructure solutions. The pervasive shift towards remote and hybrid work environments has become a paramount growth driver, compelling organizations across all sectors to invest in robust virtual desktop infrastructure (VDI). Technological disruptions, including the rapid advancement of cloud computing, 5G connectivity, and edge computing, are further revolutionizing the VDI landscape, enabling more seamless and accessible virtual desktop experiences. Consumer preferences are increasingly leaning towards unified communication and collaboration (UCC) platforms integrated with virtual desktops, prioritizing productivity and ease of access. The competitive dynamics are intensifying, with established players and emerging startups vying for market dominance through innovation, strategic partnerships, and aggressive pricing strategies. The market penetration of VDI solutions is steadily increasing, driven by the need for centralized IT management, enhanced data security, and improved business continuity.
- CAGR Projection (2025-2033): Approximately 15.5%
- Market Penetration: Expected to reach over 70% in major enterprise segments by 2033.
- Key Market Growth Drivers:
- Remote work enablement and digital transformation initiatives.
- Heightened cybersecurity concerns and data protection mandates.
- Cost optimization through hardware consolidation and lifecycle management.
- BYOD (Bring Your Own Device) policies and mobile workforce support.
- Scalability and agility offered by cloud-based VDI.
Dominant Markets & Segments in Desktop Virtualization Market
The global Desktop Virtualization Market is characterized by the dominance of specific regions, countries, and segments, each driven by unique economic, technological, and regulatory factors.
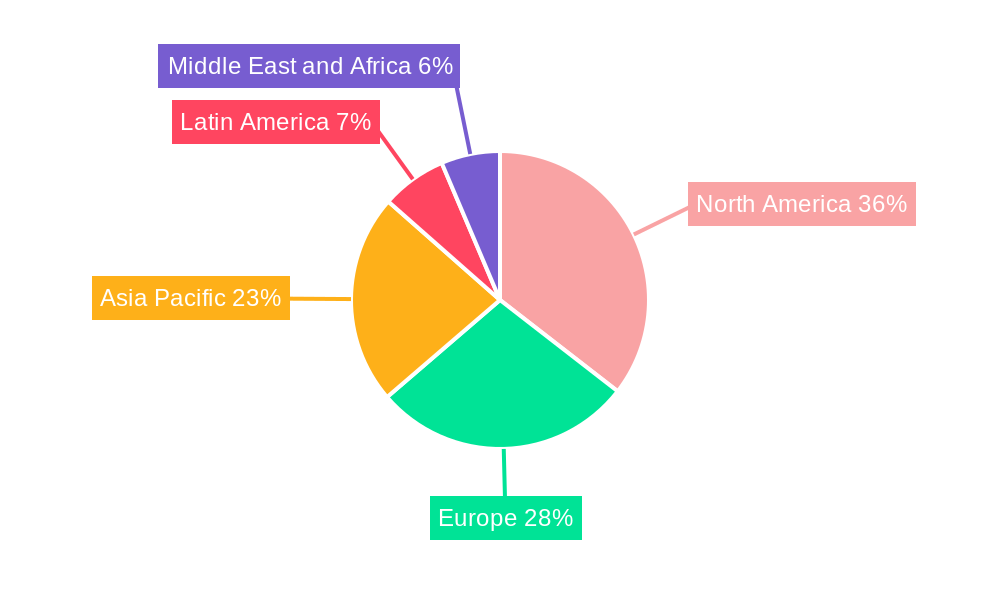
Leading Region: North America currently holds a significant share of the Desktop Virtualization Market, driven by early adoption of advanced technologies, robust IT infrastructure, and a strong presence of key market players. The United States, in particular, benefits from extensive cloud adoption and a highly digitized business environment, especially within the IT & Telecommunications and Financial Services sectors.
Dominant Desktop Delivery Platform: Hosted Virtual Desktop (HVD) is emerging as the dominant platform, offering dedicated virtual machines for each user. This provides a superior user experience and greater control, making it highly attractive for performance-intensive applications and specialized user roles.
- Key Drivers for HVD Dominance:
- Enhanced performance for demanding applications.
- Greater personalization and user control.
- Ideal for specialized workloads in sectors like design and engineering.
Dominant Deployment Mode: Cloud deployment is rapidly gaining traction and is projected to be the most dominant mode. The scalability, flexibility, and cost-effectiveness of cloud-based VDI solutions, coupled with reduced upfront capital expenditure, are compelling businesses to migrate their desktop virtualization infrastructure to the cloud.
- Key Drivers for Cloud Dominance:
- Scalability and elasticity to meet fluctuating demands.
- Reduced IT management overhead and operational costs.
- Enhanced disaster recovery and business continuity capabilities.
- Accessibility from anywhere, on any device.
Dominant End-User Vertical: The IT & Telecommunications sector consistently leads in the adoption of desktop virtualization, owing to its inherent need for flexibility, security, and efficient resource management. However, the Financial Services and Healthcare sectors are witnessing rapid growth in VDI adoption due to stringent regulatory compliance requirements and the need for secure access to sensitive data.
- Key Drivers for IT & Telecommunications Dominance:
- Need for agile IT infrastructure to support rapid innovation.
- Secure management of a large and distributed workforce.
- Cost optimization and resource allocation efficiency.
Desktop Virtualization Market Product Developments
Product developments in the Desktop Virtualization Market are primarily focused on enhancing security, improving user experience, and expanding compatibility with emerging technologies. Innovations include the integration of advanced AI and machine learning for performance optimization and predictive maintenance, enabling proactive issue resolution. Companies are also developing more lightweight and efficient endpoint operating systems designed for secure access to any digital workspace. Enhanced multi-factor authentication (MFA) and single sign-on (SSO) capabilities are becoming standard, particularly for sensitive industries like healthcare, ensuring secure access to virtual applications and desktops. Furthermore, the development of seamless integration with cloud platforms like Microsoft Azure Virtual Desktop (AVD) and Windows 365 Cloud PC highlights the trend towards hybrid and multi-cloud VDI strategies, offering greater flexibility and choice to end-users.
Report Scope & Segmentation Analysis
This report meticulously analyzes the Desktop Virtualization Market across its key segments.
- Desktop Delivery Platform: This segment is further divided into Hosted Virtual Desktop (HVD), which offers dedicated virtual machines to each user, providing maximum control and performance, and Hosted Shared Desktop (HSD), which pools resources to serve multiple users from a single server, offering cost efficiencies. "Other Desktop Delivery Forms" encompasses emerging or niche solutions.
- Deployment Mode: The market is segmented into On-premise, where organizations manage their VDI infrastructure in their own data centers, and Cloud, which leverages public, private, or hybrid cloud environments for hosting virtual desktops.
- End-User Vertical: This segmentation covers critical industries such as Financial Services, characterized by high security and compliance needs; Healthcare, demanding secure access to patient data and robust regulatory adherence; Manufacturing, requiring specialized software and hardware access; and IT & Telecommunications, a key driver of VDI adoption due to its dynamic nature. "Other End-User Verticals" includes sectors like education, government, and retail.
Key Drivers of Desktop Virtualization Market Growth
The Desktop Virtualization Market is propelled by several significant growth drivers. The escalating adoption of remote and hybrid work models necessitates secure and flexible access to corporate resources from any location and device. Heightened cybersecurity threats and stringent data privacy regulations, such as GDPR and HIPAA, are compelling organizations to invest in centralized and secure desktop environments. The need for cost optimization through hardware consolidation, extended hardware lifespan, and reduced IT management overhead further fuels VDI adoption. Moreover, the desire for improved business continuity and disaster recovery capabilities, along with the increasing demand for BYOD (Bring Your Own Device) policies, are significant contributors to market expansion.
Challenges in the Desktop Virtualization Market Sector
Despite its robust growth, the Desktop Virtualization Market faces several challenges. Initial implementation costs, including hardware, software, and skilled personnel, can be a barrier for smaller organizations. Ensuring consistent and high-performance user experience, especially for graphics-intensive applications or users with poor network connectivity, remains a technical hurdle. Regulatory compliance, while a driver for adoption, also presents complexities in configuring and managing virtual environments to meet specific industry mandates. Furthermore, resistance to change from end-users accustomed to traditional desktop environments and the need for comprehensive training can slow down adoption rates. Supply chain disruptions can also impact the availability and cost of necessary hardware components.
Emerging Opportunities in Desktop Virtualization Market
The Desktop Virtualization Market presents numerous emerging opportunities. The continued growth of the Internet of Things (IoT) and edge computing opens avenues for more distributed and localized VDI solutions. The increasing demand for specialized virtual desktops for specific tasks, such as AI/ML development, data analytics, and high-performance computing, presents a significant growth area. The rise of the metaverse and immersive technologies will likely drive the need for high-fidelity virtual desktop experiences. Furthermore, the expansion of VDI solutions into emerging economies and smaller businesses, driven by simplified deployment models and subscription-based pricing, offers substantial untapped market potential. The development of more intelligent and automated VDI management tools will also unlock new efficiencies.
Leading Players in the Desktop Virtualization Market Market
- Parallels International GmbH
- IBM Corporation
- Toshiba Corporation
- DELL Technologies Inc
- Microsoft Corporation
- Red Hat Inc
- NComputing Co Ltd
- Huawei Technologies Co Ltd
- Ericom Software Inc
- Citrix Systems Inc
Key Developments in Desktop Virtualization Market Industry
- November 2023: IGEL and Imprivata announced the availability of an integrated solution for IGEL and Imprivata consumers, enabling multi-factor authentication (MFA) and single sign-on (SSO) for clinicians accessing their virtual apps and desktops. The new IGEL Agent for Imprivata OneSign Enterprise Access Management provides secure, no-click access to Microsoft Azure Virtual Desktop (AVD) and Windows 365 Cloud PC cloud resources.
- April 2023: Virtual Cable and Huawei Cloud signed a technology alliance to drive public cloud adoption in digital work environments, enhancing organizations' security, productivity, and efficiency. This collaboration focuses on UDS Enterprise software for desktop and application virtualization.
Strategic Outlook for Desktop Virtualization Market Market
The strategic outlook for the Desktop Virtualization Market remains exceptionally positive, driven by the ongoing digital transformation and the permanent integration of remote work paradigms. The market is poised for sustained growth as organizations increasingly recognize VDI as a foundational technology for agility, security, and operational efficiency. Key growth catalysts include the continued expansion of cloud-native VDI solutions, the development of AI-powered VDI management platforms, and the growing demand for secure, high-performance virtual desktops in specialized industries. Strategic partnerships and ecosystem collaborations will be crucial for addressing complex end-user needs and expanding market reach. Companies that prioritize innovation in user experience, security, and cost-effectiveness will be well-positioned to capitalize on future market opportunities. The projected market size is expected to reach approximately $70,000 Million by 2033.
Desktop Virtualization Market Segmentation
-
1. Desktop Delivery Platform
- 1.1. Hosted Virtual Desktop (HVD)
- 1.2. Hosted Shared Desktop (HSD)
- 1.3. Other Desktop Delivery Forms
-
2. Deployment Mode
- 2.1. On-premise
- 2.2. Cloud
-
3. End-User Vertical
- 3.1. Financial Services
- 3.2. Healthcare
- 3.3. Manufacturing
- 3.4. IT & Telecommunications
- 3.5. Other End-User Verticals
Desktop Virtualization Market Segmentation By Geography
- 1. North America
- 2. Europe
- 3. Asia Pacific
- 4. Latin America
- 5. Middle East and Africa
Desktop Virtualization Market Regional Market Share
Geographic Coverage of Desktop Virtualization Market
Desktop Virtualization Market REPORT HIGHLIGHTS
| Aspects | Details |
|---|---|
| Study Period | 2020-2034 |
| Base Year | 2025 |
| Estimated Year | 2026 |
| Forecast Period | 2026-2034 |
| Historical Period | 2020-2025 |
| Growth Rate | CAGR of 10.60% from 2020-2034 |
| Segmentation |
|
Table of Contents
- 1. Introduction
- 1.1. Research Scope
- 1.2. Market Segmentation
- 1.3. Research Methodology
- 1.4. Definitions and Assumptions
- 2. Executive Summary
- 2.1. Introduction
- 3. Market Dynamics
- 3.1. Introduction
- 3.2. Market Drivers
- 3.2.1. Increasing Demand for Bring Your Own Device; Growing Adoption of Cloud Computing
- 3.3. Market Restrains
- 3.3.1. Infrastructural Constraints
- 3.4. Market Trends
- 3.4.1. Cloud Deployment Mode is Expected to Witness Significant Growth
- 4. Market Factor Analysis
- 4.1. Porters Five Forces
- 4.2. Supply/Value Chain
- 4.3. PESTEL analysis
- 4.4. Market Entropy
- 4.5. Patent/Trademark Analysis
- 5. Global Desktop Virtualization Market Analysis, Insights and Forecast, 2020-2032
- 5.1. Market Analysis, Insights and Forecast - by Desktop Delivery Platform
- 5.1.1. Hosted Virtual Desktop (HVD)
- 5.1.2. Hosted Shared Desktop (HSD)
- 5.1.3. Other Desktop Delivery Forms
- 5.2. Market Analysis, Insights and Forecast - by Deployment Mode
- 5.2.1. On-premise
- 5.2.2. Cloud
- 5.3. Market Analysis, Insights and Forecast - by End-User Vertical
- 5.3.1. Financial Services
- 5.3.2. Healthcare
- 5.3.3. Manufacturing
- 5.3.4. IT & Telecommunications
- 5.3.5. Other End-User Verticals
- 5.4. Market Analysis, Insights and Forecast - by Region
- 5.4.1. North America
- 5.4.2. Europe
- 5.4.3. Asia Pacific
- 5.4.4. Latin America
- 5.4.5. Middle East and Africa
- 5.1. Market Analysis, Insights and Forecast - by Desktop Delivery Platform
- 6. North America Desktop Virtualization Market Analysis, Insights and Forecast, 2020-2032
- 6.1. Market Analysis, Insights and Forecast - by Desktop Delivery Platform
- 6.1.1. Hosted Virtual Desktop (HVD)
- 6.1.2. Hosted Shared Desktop (HSD)
- 6.1.3. Other Desktop Delivery Forms
- 6.2. Market Analysis, Insights and Forecast - by Deployment Mode
- 6.2.1. On-premise
- 6.2.2. Cloud
- 6.3. Market Analysis, Insights and Forecast - by End-User Vertical
- 6.3.1. Financial Services
- 6.3.2. Healthcare
- 6.3.3. Manufacturing
- 6.3.4. IT & Telecommunications
- 6.3.5. Other End-User Verticals
- 6.1. Market Analysis, Insights and Forecast - by Desktop Delivery Platform
- 7. Europe Desktop Virtualization Market Analysis, Insights and Forecast, 2020-2032
- 7.1. Market Analysis, Insights and Forecast - by Desktop Delivery Platform
- 7.1.1. Hosted Virtual Desktop (HVD)
- 7.1.2. Hosted Shared Desktop (HSD)
- 7.1.3. Other Desktop Delivery Forms
- 7.2. Market Analysis, Insights and Forecast - by Deployment Mode
- 7.2.1. On-premise
- 7.2.2. Cloud
- 7.3. Market Analysis, Insights and Forecast - by End-User Vertical
- 7.3.1. Financial Services
- 7.3.2. Healthcare
- 7.3.3. Manufacturing
- 7.3.4. IT & Telecommunications
- 7.3.5. Other End-User Verticals
- 7.1. Market Analysis, Insights and Forecast - by Desktop Delivery Platform
- 8. Asia Pacific Desktop Virtualization Market Analysis, Insights and Forecast, 2020-2032
- 8.1. Market Analysis, Insights and Forecast - by Desktop Delivery Platform
- 8.1.1. Hosted Virtual Desktop (HVD)
- 8.1.2. Hosted Shared Desktop (HSD)
- 8.1.3. Other Desktop Delivery Forms
- 8.2. Market Analysis, Insights and Forecast - by Deployment Mode
- 8.2.1. On-premise
- 8.2.2. Cloud
- 8.3. Market Analysis, Insights and Forecast - by End-User Vertical
- 8.3.1. Financial Services
- 8.3.2. Healthcare
- 8.3.3. Manufacturing
- 8.3.4. IT & Telecommunications
- 8.3.5. Other End-User Verticals
- 8.1. Market Analysis, Insights and Forecast - by Desktop Delivery Platform
- 9. Latin America Desktop Virtualization Market Analysis, Insights and Forecast, 2020-2032
- 9.1. Market Analysis, Insights and Forecast - by Desktop Delivery Platform
- 9.1.1. Hosted Virtual Desktop (HVD)
- 9.1.2. Hosted Shared Desktop (HSD)
- 9.1.3. Other Desktop Delivery Forms
- 9.2. Market Analysis, Insights and Forecast - by Deployment Mode
- 9.2.1. On-premise
- 9.2.2. Cloud
- 9.3. Market Analysis, Insights and Forecast - by End-User Vertical
- 9.3.1. Financial Services
- 9.3.2. Healthcare
- 9.3.3. Manufacturing
- 9.3.4. IT & Telecommunications
- 9.3.5. Other End-User Verticals
- 9.1. Market Analysis, Insights and Forecast - by Desktop Delivery Platform
- 10. Middle East and Africa Desktop Virtualization Market Analysis, Insights and Forecast, 2020-2032
- 10.1. Market Analysis, Insights and Forecast - by Desktop Delivery Platform
- 10.1.1. Hosted Virtual Desktop (HVD)
- 10.1.2. Hosted Shared Desktop (HSD)
- 10.1.3. Other Desktop Delivery Forms
- 10.2. Market Analysis, Insights and Forecast - by Deployment Mode
- 10.2.1. On-premise
- 10.2.2. Cloud
- 10.3. Market Analysis, Insights and Forecast - by End-User Vertical
- 10.3.1. Financial Services
- 10.3.2. Healthcare
- 10.3.3. Manufacturing
- 10.3.4. IT & Telecommunications
- 10.3.5. Other End-User Verticals
- 10.1. Market Analysis, Insights and Forecast - by Desktop Delivery Platform
- 11. Competitive Analysis
- 11.1. Global Market Share Analysis 2025
- 11.2. Company Profiles
- 11.2.1 Parallels International GmbH
- 11.2.1.1. Overview
- 11.2.1.2. Products
- 11.2.1.3. SWOT Analysis
- 11.2.1.4. Recent Developments
- 11.2.1.5. Financials (Based on Availability)
- 11.2.2 IBM Corporation
- 11.2.2.1. Overview
- 11.2.2.2. Products
- 11.2.2.3. SWOT Analysis
- 11.2.2.4. Recent Developments
- 11.2.2.5. Financials (Based on Availability)
- 11.2.3 Toshiba Corporation
- 11.2.3.1. Overview
- 11.2.3.2. Products
- 11.2.3.3. SWOT Analysis
- 11.2.3.4. Recent Developments
- 11.2.3.5. Financials (Based on Availability)
- 11.2.4 DELL Technologies Inc
- 11.2.4.1. Overview
- 11.2.4.2. Products
- 11.2.4.3. SWOT Analysis
- 11.2.4.4. Recent Developments
- 11.2.4.5. Financials (Based on Availability)
- 11.2.5 Microsoft Corporation
- 11.2.5.1. Overview
- 11.2.5.2. Products
- 11.2.5.3. SWOT Analysis
- 11.2.5.4. Recent Developments
- 11.2.5.5. Financials (Based on Availability)
- 11.2.6 Red Hat Inc
- 11.2.6.1. Overview
- 11.2.6.2. Products
- 11.2.6.3. SWOT Analysis
- 11.2.6.4. Recent Developments
- 11.2.6.5. Financials (Based on Availability)
- 11.2.7 NComputing Co Ltd
- 11.2.7.1. Overview
- 11.2.7.2. Products
- 11.2.7.3. SWOT Analysis
- 11.2.7.4. Recent Developments
- 11.2.7.5. Financials (Based on Availability)
- 11.2.8 Huawei Technologies Co Ltd
- 11.2.8.1. Overview
- 11.2.8.2. Products
- 11.2.8.3. SWOT Analysis
- 11.2.8.4. Recent Developments
- 11.2.8.5. Financials (Based on Availability)
- 11.2.9 Ericom Software Inc
- 11.2.9.1. Overview
- 11.2.9.2. Products
- 11.2.9.3. SWOT Analysis
- 11.2.9.4. Recent Developments
- 11.2.9.5. Financials (Based on Availability)
- 11.2.10 Citrix Systems Inc
- 11.2.10.1. Overview
- 11.2.10.2. Products
- 11.2.10.3. SWOT Analysis
- 11.2.10.4. Recent Developments
- 11.2.10.5. Financials (Based on Availability)
- 11.2.1 Parallels International GmbH
List of Figures
- Figure 1: Global Desktop Virtualization Market Revenue Breakdown (Million, %) by Region 2025 & 2033
- Figure 2: North America Desktop Virtualization Market Revenue (Million), by Desktop Delivery Platform 2025 & 2033
- Figure 3: North America Desktop Virtualization Market Revenue Share (%), by Desktop Delivery Platform 2025 & 2033
- Figure 4: North America Desktop Virtualization Market Revenue (Million), by Deployment Mode 2025 & 2033
- Figure 5: North America Desktop Virtualization Market Revenue Share (%), by Deployment Mode 2025 & 2033
- Figure 6: North America Desktop Virtualization Market Revenue (Million), by End-User Vertical 2025 & 2033
- Figure 7: North America Desktop Virtualization Market Revenue Share (%), by End-User Vertical 2025 & 2033
- Figure 8: North America Desktop Virtualization Market Revenue (Million), by Country 2025 & 2033
- Figure 9: North America Desktop Virtualization Market Revenue Share (%), by Country 2025 & 2033
- Figure 10: Europe Desktop Virtualization Market Revenue (Million), by Desktop Delivery Platform 2025 & 2033
- Figure 11: Europe Desktop Virtualization Market Revenue Share (%), by Desktop Delivery Platform 2025 & 2033
- Figure 12: Europe Desktop Virtualization Market Revenue (Million), by Deployment Mode 2025 & 2033
- Figure 13: Europe Desktop Virtualization Market Revenue Share (%), by Deployment Mode 2025 & 2033
- Figure 14: Europe Desktop Virtualization Market Revenue (Million), by End-User Vertical 2025 & 2033
- Figure 15: Europe Desktop Virtualization Market Revenue Share (%), by End-User Vertical 2025 & 2033
- Figure 16: Europe Desktop Virtualization Market Revenue (Million), by Country 2025 & 2033
- Figure 17: Europe Desktop Virtualization Market Revenue Share (%), by Country 2025 & 2033
- Figure 18: Asia Pacific Desktop Virtualization Market Revenue (Million), by Desktop Delivery Platform 2025 & 2033
- Figure 19: Asia Pacific Desktop Virtualization Market Revenue Share (%), by Desktop Delivery Platform 2025 & 2033
- Figure 20: Asia Pacific Desktop Virtualization Market Revenue (Million), by Deployment Mode 2025 & 2033
- Figure 21: Asia Pacific Desktop Virtualization Market Revenue Share (%), by Deployment Mode 2025 & 2033
- Figure 22: Asia Pacific Desktop Virtualization Market Revenue (Million), by End-User Vertical 2025 & 2033
- Figure 23: Asia Pacific Desktop Virtualization Market Revenue Share (%), by End-User Vertical 2025 & 2033
- Figure 24: Asia Pacific Desktop Virtualization Market Revenue (Million), by Country 2025 & 2033
- Figure 25: Asia Pacific Desktop Virtualization Market Revenue Share (%), by Country 2025 & 2033
- Figure 26: Latin America Desktop Virtualization Market Revenue (Million), by Desktop Delivery Platform 2025 & 2033
- Figure 27: Latin America Desktop Virtualization Market Revenue Share (%), by Desktop Delivery Platform 2025 & 2033
- Figure 28: Latin America Desktop Virtualization Market Revenue (Million), by Deployment Mode 2025 & 2033
- Figure 29: Latin America Desktop Virtualization Market Revenue Share (%), by Deployment Mode 2025 & 2033
- Figure 30: Latin America Desktop Virtualization Market Revenue (Million), by End-User Vertical 2025 & 2033
- Figure 31: Latin America Desktop Virtualization Market Revenue Share (%), by End-User Vertical 2025 & 2033
- Figure 32: Latin America Desktop Virtualization Market Revenue (Million), by Country 2025 & 2033
- Figure 33: Latin America Desktop Virtualization Market Revenue Share (%), by Country 2025 & 2033
- Figure 34: Middle East and Africa Desktop Virtualization Market Revenue (Million), by Desktop Delivery Platform 2025 & 2033
- Figure 35: Middle East and Africa Desktop Virtualization Market Revenue Share (%), by Desktop Delivery Platform 2025 & 2033
- Figure 36: Middle East and Africa Desktop Virtualization Market Revenue (Million), by Deployment Mode 2025 & 2033
- Figure 37: Middle East and Africa Desktop Virtualization Market Revenue Share (%), by Deployment Mode 2025 & 2033
- Figure 38: Middle East and Africa Desktop Virtualization Market Revenue (Million), by End-User Vertical 2025 & 2033
- Figure 39: Middle East and Africa Desktop Virtualization Market Revenue Share (%), by End-User Vertical 2025 & 2033
- Figure 40: Middle East and Africa Desktop Virtualization Market Revenue (Million), by Country 2025 & 2033
- Figure 41: Middle East and Africa Desktop Virtualization Market Revenue Share (%), by Country 2025 & 2033
List of Tables
- Table 1: Global Desktop Virtualization Market Revenue Million Forecast, by Desktop Delivery Platform 2020 & 2033
- Table 2: Global Desktop Virtualization Market Revenue Million Forecast, by Deployment Mode 2020 & 2033
- Table 3: Global Desktop Virtualization Market Revenue Million Forecast, by End-User Vertical 2020 & 2033
- Table 4: Global Desktop Virtualization Market Revenue Million Forecast, by Region 2020 & 2033
- Table 5: Global Desktop Virtualization Market Revenue Million Forecast, by Desktop Delivery Platform 2020 & 2033
- Table 6: Global Desktop Virtualization Market Revenue Million Forecast, by Deployment Mode 2020 & 2033
- Table 7: Global Desktop Virtualization Market Revenue Million Forecast, by End-User Vertical 2020 & 2033
- Table 8: Global Desktop Virtualization Market Revenue Million Forecast, by Country 2020 & 2033
- Table 9: Global Desktop Virtualization Market Revenue Million Forecast, by Desktop Delivery Platform 2020 & 2033
- Table 10: Global Desktop Virtualization Market Revenue Million Forecast, by Deployment Mode 2020 & 2033
- Table 11: Global Desktop Virtualization Market Revenue Million Forecast, by End-User Vertical 2020 & 2033
- Table 12: Global Desktop Virtualization Market Revenue Million Forecast, by Country 2020 & 2033
- Table 13: Global Desktop Virtualization Market Revenue Million Forecast, by Desktop Delivery Platform 2020 & 2033
- Table 14: Global Desktop Virtualization Market Revenue Million Forecast, by Deployment Mode 2020 & 2033
- Table 15: Global Desktop Virtualization Market Revenue Million Forecast, by End-User Vertical 2020 & 2033
- Table 16: Global Desktop Virtualization Market Revenue Million Forecast, by Country 2020 & 2033
- Table 17: Global Desktop Virtualization Market Revenue Million Forecast, by Desktop Delivery Platform 2020 & 2033
- Table 18: Global Desktop Virtualization Market Revenue Million Forecast, by Deployment Mode 2020 & 2033
- Table 19: Global Desktop Virtualization Market Revenue Million Forecast, by End-User Vertical 2020 & 2033
- Table 20: Global Desktop Virtualization Market Revenue Million Forecast, by Country 2020 & 2033
- Table 21: Global Desktop Virtualization Market Revenue Million Forecast, by Desktop Delivery Platform 2020 & 2033
- Table 22: Global Desktop Virtualization Market Revenue Million Forecast, by Deployment Mode 2020 & 2033
- Table 23: Global Desktop Virtualization Market Revenue Million Forecast, by End-User Vertical 2020 & 2033
- Table 24: Global Desktop Virtualization Market Revenue Million Forecast, by Country 2020 & 2033
Frequently Asked Questions
1. What is the projected Compound Annual Growth Rate (CAGR) of the Desktop Virtualization Market?
The projected CAGR is approximately 10.60%.
2. Which companies are prominent players in the Desktop Virtualization Market?
Key companies in the market include Parallels International GmbH, IBM Corporation, Toshiba Corporation, DELL Technologies Inc, Microsoft Corporation, Red Hat Inc, NComputing Co Ltd, Huawei Technologies Co Ltd, Ericom Software Inc , Citrix Systems Inc.
3. What are the main segments of the Desktop Virtualization Market?
The market segments include Desktop Delivery Platform, Deployment Mode, End-User Vertical.
4. Can you provide details about the market size?
The market size is estimated to be USD 13.79 Million as of 2022.
5. What are some drivers contributing to market growth?
Increasing Demand for Bring Your Own Device; Growing Adoption of Cloud Computing.
6. What are the notable trends driving market growth?
Cloud Deployment Mode is Expected to Witness Significant Growth.
7. Are there any restraints impacting market growth?
Infrastructural Constraints.
8. Can you provide examples of recent developments in the market?
November 2023 - IGEL, a provider of the managed endpoint operating system for secured access to any digital workspace, and Imprivata announced the availability of an integrated solution for IGEL and Imprivata consumers that enables multi-factor authentication (MFA) and single sign-on (SSO) for clinicians accessing their virtual apps and desktops. The new IGEL Agent for Imprivata OneSign Enterprise Access Management enables and controls digital identities with secure, no-click access to Microsoft Azure Virtual Desktop (AVD) and Windows 365 Cloud PC cloud resources.
9. What pricing options are available for accessing the report?
Pricing options include single-user, multi-user, and enterprise licenses priced at USD 4750, USD 5250, and USD 8750 respectively.
10. Is the market size provided in terms of value or volume?
The market size is provided in terms of value, measured in Million.
11. Are there any specific market keywords associated with the report?
Yes, the market keyword associated with the report is "Desktop Virtualization Market," which aids in identifying and referencing the specific market segment covered.
12. How do I determine which pricing option suits my needs best?
The pricing options vary based on user requirements and access needs. Individual users may opt for single-user licenses, while businesses requiring broader access may choose multi-user or enterprise licenses for cost-effective access to the report.
13. Are there any additional resources or data provided in the Desktop Virtualization Market report?
While the report offers comprehensive insights, it's advisable to review the specific contents or supplementary materials provided to ascertain if additional resources or data are available.
14. How can I stay updated on further developments or reports in the Desktop Virtualization Market?
To stay informed about further developments, trends, and reports in the Desktop Virtualization Market, consider subscribing to industry newsletters, following relevant companies and organizations, or regularly checking reputable industry news sources and publications.
Methodology
Step 1 - Identification of Relevant Samples Size from Population Database


Step 2 - Approaches for Defining Global Market Size (Value, Volume* & Price*)

Note*: In applicable scenarios
Step 3 - Data Sources
Primary Research
- Web Analytics
- Survey Reports
- Research Institute
- Latest Research Reports
- Opinion Leaders
Secondary Research
- Annual Reports
- White Paper
- Latest Press Release
- Industry Association
- Paid Database
- Investor Presentations

Step 4 - Data Triangulation
Involves using different sources of information in order to increase the validity of a study
These sources are likely to be stakeholders in a program - participants, other researchers, program staff, other community members, and so on.
Then we put all data in single framework & apply various statistical tools to find out the dynamic on the market.
During the analysis stage, feedback from the stakeholder groups would be compared to determine areas of agreement as well as areas of divergence