


Key Insights
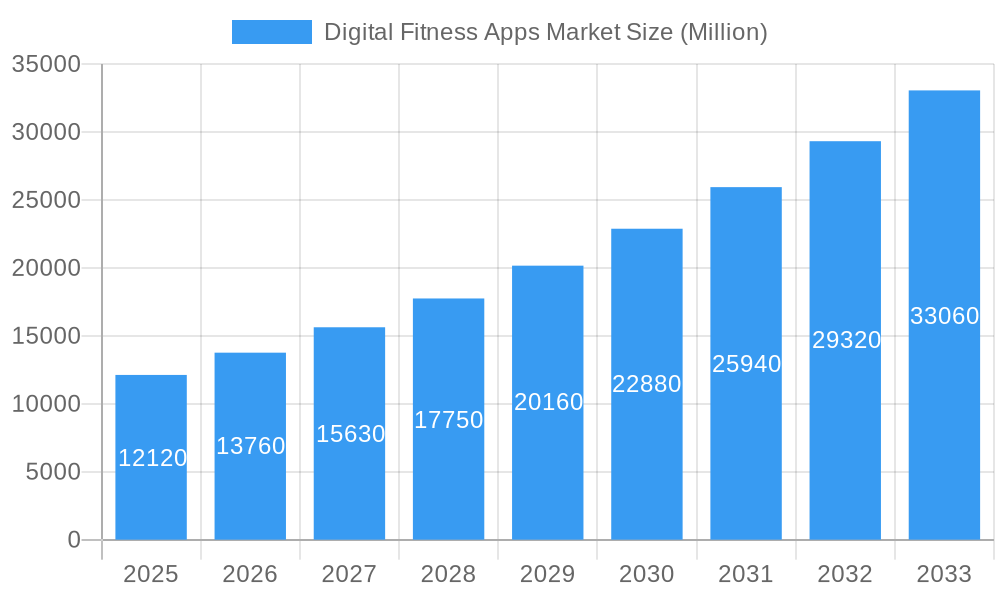
The digital fitness apps market is experiencing robust expansion, projected to reach $12.12 billion in 2025. This growth is fueled by an escalating global emphasis on health and wellness, increased smartphone penetration, and the widespread adoption of wearable technology that seamlessly integrates with fitness applications. The market is characterized by a remarkable CAGR of 13.4%, indicating sustained and significant upward momentum throughout the forecast period of 2025-2033. This surge is driven by a diverse array of app categories catering to various user needs, including fitness tracking, personalized nutrition guidance, mental well-being solutions like meditation apps, and essential health management tools such as contraception, fertility trackers, and medication checkers. The "Others" category, encompassing a broad spectrum of mindfulness and holistic health applications, also contributes substantially to the market's dynamism.
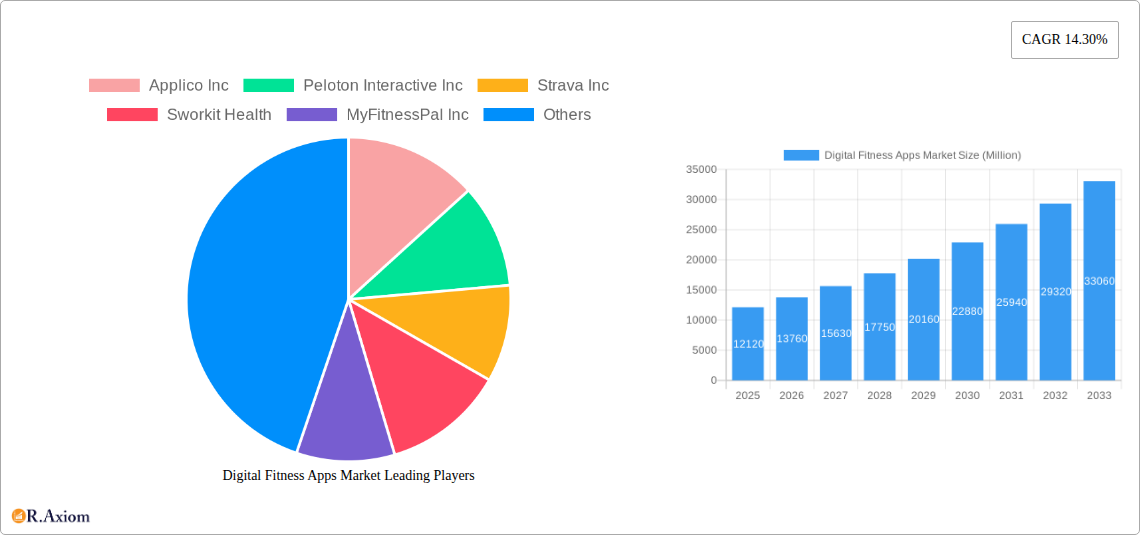
Digital Fitness Apps Market Market Size (In Billion)

The competitive landscape is dynamic, featuring established tech giants like Google and Nike alongside specialized fitness and wellness providers such as Peloton Interactive, Strava, and MyFitnessPal. Emerging players are continually innovating to capture market share by offering advanced features, personalized user experiences, and community-driven engagement. While the market benefits from strong drivers, it also faces potential restraints including data privacy concerns and the need for continuous feature updates to maintain user engagement. However, the overarching trend towards proactive health management, the convenience offered by mobile solutions, and ongoing technological advancements in AI and personalized coaching are expected to propel the digital fitness apps market to new heights, making it a vital component of the global digital health ecosystem.
Digital Fitness Apps Market Company Market Share
This in-depth report provides a detailed analysis of the global Digital Fitness Apps market, covering the historical period from 2019 to 2024 and projecting growth through 2033, with the base and estimated year of 2025. We delve into market concentration, innovation drivers, industry trends, dominant segments, and key players, offering actionable insights for stakeholders. The report forecasts the Digital Fitness Apps market to reach USD 80.23 billion by 2033, exhibiting a robust Compound Annual Growth Rate (CAGR) of 18.7% from 2025 to 2033.
Digital Fitness Apps Market Market Concentration & Innovation
The Digital Fitness Apps market is characterized by a dynamic interplay of established giants and agile startups, leading to a moderately concentrated landscape. Innovation remains a key differentiator, driven by advancements in wearable technology, artificial intelligence for personalized coaching, and the increasing integration of mental wellness features. Regulatory frameworks are evolving, with a growing emphasis on data privacy and health information security, particularly for sensitive segments like contraception and fertility apps. Product substitutes are emerging from traditional fitness clubs and in-person coaching, but the convenience and accessibility of digital solutions continue to fuel market penetration. End-user trends highlight a growing demand for holistic wellness, encompassing physical fitness, nutrition, and mental health, leading to the rise of integrated platforms. Mergers and acquisitions (M&A) activities are significant, with notable deals in the billions of dollars, as major players seek to expand their offerings and market reach. For instance, the acquisition of smaller niche apps by larger corporations has been a recurring theme, contributing to market consolidation and innovation acceleration.
- Market Concentration: Moderate, with key players holding significant market share but substantial room for smaller, specialized app providers.
- Innovation Drivers: AI-powered personalization, wearable integration, gamification, mental wellness features, and enhanced user experience.
- Regulatory Frameworks: Increasing focus on data privacy (GDPR, CCPA), health data security, and app efficacy claims.
- Product Substitutes: Traditional gyms, personal trainers, home exercise equipment, and community-based fitness programs.
- End-User Trends: Demand for personalized fitness plans, holistic wellness solutions, community engagement, and remote health monitoring.
- M&A Activities: Strategic acquisitions to gain market share, acquire new technologies, and diversify product portfolios. Estimated M&A deal values are in the range of USD 500 million to USD 2 billion annually.
Digital Fitness Apps Market Industry Trends & Insights
The Digital Fitness Apps market is experiencing unprecedented growth, fueled by a confluence of technological advancements, evolving consumer behaviors, and a heightened global awareness of health and wellness. The increasing penetration of smartphones and wearables has democratized access to fitness and health tracking, making digital solutions an integral part of daily routines. The COVID-19 pandemic significantly accelerated this trend, compelling individuals to adopt at-home fitness solutions and virtual wellness programs, thereby solidifying the market's upward trajectory. Artificial intelligence (AI) and machine learning (ML) are revolutionizing the industry by enabling highly personalized workout plans, tailored nutrition advice, and adaptive coaching, moving beyond generic recommendations to cater to individual needs and progress. The gamification of fitness, incorporating challenges, rewards, and social competition, is another significant trend that enhances user engagement and retention, turning exercise into an enjoyable and motivating experience.
Furthermore, the market is witnessing a pronounced shift towards holistic well-being, with a substantial segment of users seeking integrated platforms that address not only physical fitness but also mental health, nutrition, and sleep tracking. This has led to the rise of comprehensive wellness apps that combine meditation, mindfulness exercises, sleep analysis, and nutritional guidance alongside traditional fitness tracking. The growing concern over mental health has propelled meditation and mindfulness apps into a prominent position within the digital health ecosystem, offering accessible tools for stress management and emotional well-being. The market penetration for fitness apps is estimated to be around 65% globally, with significant regional variations. The CAGR for the Digital Fitness Apps market is projected to be 18.7% during the forecast period of 2025–2033, indicating sustained and robust growth.
Technological disruptions, such as the development of advanced sensors in wearables, augmented reality (AR) and virtual reality (VR) integrations for immersive workout experiences, and the increasing sophistication of AI-driven analytics, will continue to shape the competitive landscape. Consumer preferences are increasingly leaning towards convenience, affordability, and personalized experiences. The competitive dynamics are characterized by intense innovation, strategic partnerships, and a race to capture market share through compelling user acquisition and retention strategies. Companies are investing heavily in research and development to enhance app functionalities, improve user interfaces, and leverage data analytics to provide more value to their users. The subscription-based revenue model remains dominant, but freemium models and in-app purchases are also prevalent, catering to a diverse user base with varying willingness to pay. The global Digital Fitness Apps market size was valued at USD 25.11 billion in 2023 and is projected to reach USD 80.23 billion by 2033.
Dominant Markets & Segments in Digital Fitness Apps Market
The Digital Fitness Apps market is segmented by type, with Fitness Apps Tracking Fitness Achievements emerging as the dominant segment, commanding a significant market share. This dominance is attributed to the universal appeal of tracking progress, setting goals, and achieving milestones in physical fitness. The widespread adoption of smartphones and wearable devices, coupled with a growing global consciousness about health and fitness, has propelled this segment to the forefront. Countries with higher disposable incomes, robust smartphone penetration, and a proactive approach to public health initiatives tend to exhibit higher adoption rates.
Leading Region: North America currently leads the Digital Fitness Apps market, driven by high disposable incomes, advanced technological infrastructure, and a strong culture of health and fitness. The United States, in particular, represents a substantial portion of this market.
Dominant Segment (Type): Fitness Apps Tracking Fitness Achievements
- Key Drivers:
- Goal-Oriented Motivation: Users are driven by the desire to track progress, achieve personal bests, and monitor health metrics like steps taken, calories burned, distance covered, and heart rate.
- Wearable Integration: Seamless integration with smartwatches and fitness trackers enhances data accuracy and user experience, providing real-time feedback and comprehensive insights.
- Gamification and Social Features: Leaderboards, challenges, badges, and social sharing features foster engagement and create a sense of community and friendly competition.
- Personalization: AI-powered algorithms that create customized workout plans based on fitness levels, goals, and available equipment.
- Data Visualization: Intuitive dashboards and reports that allow users to visualize their progress over time, reinforcing motivation and adherence.
- Economic Policies: Government initiatives promoting healthy lifestyles and digital health adoption.
- Infrastructure: Widespread availability of high-speed internet and affordable smartphones.
- Dominance Analysis: The inherent human desire for self-improvement and measurable results makes fitness tracking apps a foundational element of the digital health landscape. The ability to quantify physical activity and see tangible progress is a powerful motivator for consistent app usage. The ecosystem of wearable devices further solidifies this segment's position, providing a constant stream of data that these apps effectively translate into actionable insights. The market size for Fitness Apps Tracking Fitness Achievements is estimated to be USD 20.10 billion in 2025, with a projected growth to USD 64.18 billion by 2033.
- Key Drivers:
Other Significant Segments:
- Nutrition Apps: Growing awareness of the link between diet and health.
- Meditation Apps: Increased focus on mental well-being and stress management.
- Contraception and Fertility Apps: Rising demand for reproductive health management tools.
- Medication Checker Apps: Focus on medication adherence and health management.
- Others Mindfulness Apps: Broadening scope of mental wellness tools.
Digital Fitness Apps Market Product Developments
Product development in the Digital Fitness Apps market is characterized by a continuous drive towards enhanced personalization, integration, and user experience. Innovations include AI-powered virtual coaches offering real-time feedback and adaptive workout plans, advanced sleep tracking and analysis for holistic recovery, and gamified challenges that boost user engagement. Integration with a wider range of wearables and smart home devices is expanding, creating a more seamless connected wellness ecosystem. Furthermore, the incorporation of mental wellness features, such as guided meditations, mindfulness exercises, and mood tracking, reflects a growing demand for comprehensive health solutions. These developments aim to provide users with highly tailored, convenient, and effective tools for achieving their fitness and well-being goals, thereby gaining a competitive edge in a rapidly evolving market.
Report Scope & Segmentation Analysis
This report provides a comprehensive analysis of the Digital Fitness Apps market segmented by type. The key segments analyzed include:
- Fitness Apps Tracking Fitness Achievements: These apps focus on monitoring physical activity, workouts, and performance metrics.
- Nutrition Apps: Dedicated to tracking food intake, providing dietary recommendations, and managing calorie consumption.
- Meditation Apps: Offering guided meditation sessions, mindfulness exercises, and stress reduction techniques.
- Contraception and Fertility Apps: Tools for tracking menstrual cycles, predicting ovulation, and managing reproductive health.
- Medication Checker Apps: Assisting users in managing their medication schedules, checking for interactions, and providing drug information.
- Others Mindfulness Apps: Encompassing a broader range of mental wellness tools beyond traditional meditation, such as journaling and stress relief techniques.
Each segment is analyzed for its current market size, growth projections, and competitive dynamics. The Fitness Apps Tracking Fitness Achievements segment is projected to hold the largest market share throughout the forecast period.
Key Drivers of Digital Fitness Apps Market Growth
The Digital Fitness Apps market is propelled by several key drivers, most notably the increasing adoption of smartphones and wearable devices, which provide the necessary hardware for tracking and monitoring. A growing global emphasis on health and wellness, driven by rising rates of chronic diseases and a desire for preventative care, also fuels demand for digital fitness solutions. Technological advancements, including AI, machine learning, and sensor technology, enable more personalized and effective user experiences. Furthermore, the convenience and accessibility offered by digital apps, allowing users to exercise anytime and anywhere, cater to increasingly busy lifestyles. The ongoing evolution of online content, from on-demand workouts to virtual coaching, further enhances engagement.
Challenges in the Digital Fitness Apps Market Sector
Despite its robust growth, the Digital Fitness Apps market faces several challenges. High levels of competition and market saturation can make user acquisition and retention difficult, leading to increased marketing costs. Data privacy and security concerns are paramount, as apps collect sensitive personal health information, requiring stringent compliance with regulations like GDPR and CCPA. The accuracy of data from wearables and the effectiveness of app-based guidance can sometimes be questioned, leading to user skepticism. Furthermore, maintaining long-term user engagement and preventing app fatigue are ongoing hurdles, as users may lose motivation or switch to alternative solutions. Regulatory hurdles and the need for continuous innovation to stay ahead of competitors also present significant challenges.
Emerging Opportunities in Digital Fitness Apps Market
Emerging opportunities in the Digital Fitness Apps market are abundant, driven by continuous innovation and evolving consumer needs. The integration of AI and machine learning offers significant potential for hyper-personalized fitness and wellness plans, catering to individual genetic predispositions, lifestyle habits, and health goals. The expanding scope of mental wellness, encompassing mindfulness, stress management, and sleep optimization, presents a vast untapped market for integrated digital solutions. The burgeoning telehealth and remote patient monitoring sectors are creating new avenues for fitness apps to work in conjunction with healthcare providers, offering a more holistic approach to patient care. Furthermore, the increasing adoption of gamification and immersive technologies like AR and VR promises to make fitness more engaging and enjoyable, attracting new user demographics. The expansion into corporate wellness programs and insurance partnerships also represents a significant growth opportunity.
Leading Players in the Digital Fitness Apps Market Market
- Applico Inc
- Peloton Interactive Inc
- Strava Inc
- Sworkit Health
- MyFitnessPal Inc
- Famometer
- Headspace Inc
- Noom Inc
- Nike
- Fitbit Inc
- Azumio Inc
- Adidas
- Flo Health Inc
Key Developments in Digital Fitness Apps Market Industry
- November 2022: Headspace Health, a leading digital mental health platform, unveiled a unified product experience combining Ginger's coaching, therapy, and psychiatry services with Headspace's meditation and mindfulness offerings. This innovation aims to provide a centralized, high-quality mental health support system for employees and simplify administrative burdens for employers.
- June 2022: Flo Health introduced Flo for Business, an inclusive women's health strategy for employees. Accessible globally and in multiple languages, this initiative aims to empower staff with knowledge about period tracking, ovulation, and general reproductive health, offering comprehensive, science-based support across various life stages as an employee benefit.
Strategic Outlook for Digital Fitness Apps Market Market
The strategic outlook for the Digital Fitness Apps market is overwhelmingly positive, with significant growth catalysts poised to shape its future. The ongoing convergence of fitness, health, and wellness technologies, coupled with advancements in AI and wearable integration, will continue to drive product innovation and personalization. The increasing consumer demand for holistic well-being solutions, encompassing physical, mental, and nutritional health, presents a substantial opportunity for integrated platforms. Strategic partnerships with healthcare providers, insurance companies, and corporate wellness programs are expected to accelerate market penetration and expand service offerings. The focus on data-driven insights and personalized user journeys will be crucial for maintaining competitive advantage. The market's ability to adapt to evolving consumer preferences and technological advancements, while addressing data privacy and security concerns, will be key to sustained success.
Digital Fitness Apps Market Segmentation
-
1. Type
- 1.1. Fitness Apps Tracking Fitness Achievements
- 1.2. Nutrition Apps
- 1.3. Meditation Apps
- 1.4. Contraception and Fertility Apps
- 1.5. Medication Checker Apps
- 1.6. Others Mindfulness Apps
Digital Fitness Apps Market Segmentation By Geography
- 1. North America
- 2. Europe
- 3. Asia Pacific
- 4. Latin America
- 5. Middle East and Africa
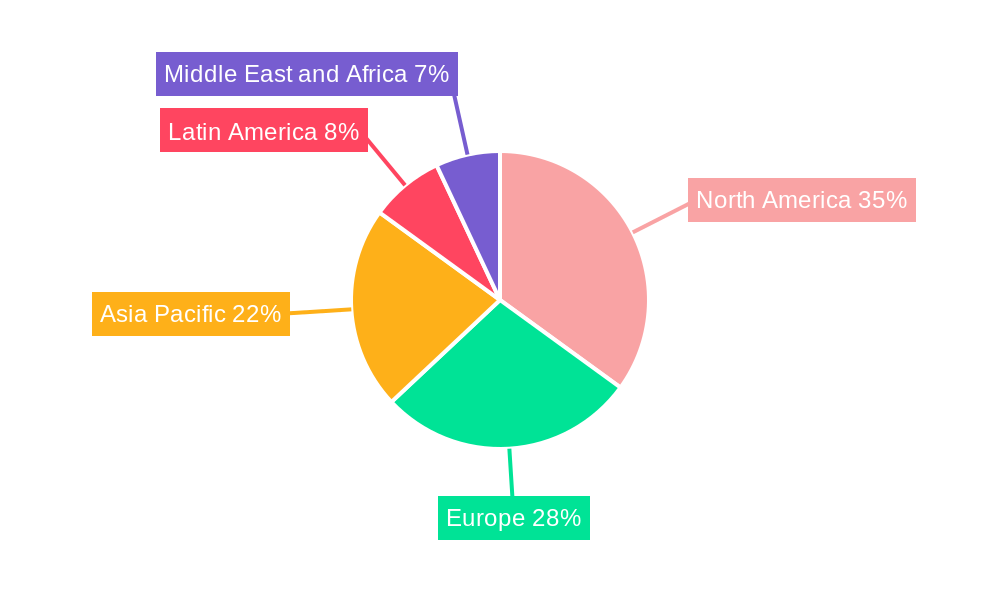
Digital Fitness Apps Market Regional Market Share
Geographic Coverage of Digital Fitness Apps Market
Digital Fitness Apps Market REPORT HIGHLIGHTS
| Aspects | Details |
|---|---|
| Study Period | 2020-2034 |
| Base Year | 2025 |
| Estimated Year | 2026 |
| Forecast Period | 2026-2034 |
| Historical Period | 2020-2025 |
| Growth Rate | CAGR of 13.4% from 2020-2034 |
| Segmentation |
|
Table of Contents
- 1. Introduction
- 1.1. Research Scope
- 1.2. Market Segmentation
- 1.3. Research Methodology
- 1.4. Definitions and Assumptions
- 2. Executive Summary
- 2.1. Introduction
- 3. Market Dynamics
- 3.1. Introduction
- 3.2. Market Drivers
- 3.2.1. Significant Smartphone Penetration and Internet Coverage; Increased Investment on Digital Health
- 3.3. Market Restrains
- 3.3.1. Risk of Data Security Threats
- 3.4. Market Trends
- 3.4.1. Rapid Digitalization Aids Market Growth
- 4. Market Factor Analysis
- 4.1. Porters Five Forces
- 4.2. Supply/Value Chain
- 4.3. PESTEL analysis
- 4.4. Market Entropy
- 4.5. Patent/Trademark Analysis
- 5. Global Digital Fitness Apps Market Analysis, Insights and Forecast, 2020-2032
- 5.1. Market Analysis, Insights and Forecast - by Type
- 5.1.1. Fitness Apps Tracking Fitness Achievements
- 5.1.2. Nutrition Apps
- 5.1.3. Meditation Apps
- 5.1.4. Contraception and Fertility Apps
- 5.1.5. Medication Checker Apps
- 5.1.6. Others Mindfulness Apps
- 5.2. Market Analysis, Insights and Forecast - by Region
- 5.2.1. North America
- 5.2.2. Europe
- 5.2.3. Asia Pacific
- 5.2.4. Latin America
- 5.2.5. Middle East and Africa
- 5.1. Market Analysis, Insights and Forecast - by Type
- 6. North America Digital Fitness Apps Market Analysis, Insights and Forecast, 2020-2032
- 6.1. Market Analysis, Insights and Forecast - by Type
- 6.1.1. Fitness Apps Tracking Fitness Achievements
- 6.1.2. Nutrition Apps
- 6.1.3. Meditation Apps
- 6.1.4. Contraception and Fertility Apps
- 6.1.5. Medication Checker Apps
- 6.1.6. Others Mindfulness Apps
- 6.1. Market Analysis, Insights and Forecast - by Type
- 7. Europe Digital Fitness Apps Market Analysis, Insights and Forecast, 2020-2032
- 7.1. Market Analysis, Insights and Forecast - by Type
- 7.1.1. Fitness Apps Tracking Fitness Achievements
- 7.1.2. Nutrition Apps
- 7.1.3. Meditation Apps
- 7.1.4. Contraception and Fertility Apps
- 7.1.5. Medication Checker Apps
- 7.1.6. Others Mindfulness Apps
- 7.1. Market Analysis, Insights and Forecast - by Type
- 8. Asia Pacific Digital Fitness Apps Market Analysis, Insights and Forecast, 2020-2032
- 8.1. Market Analysis, Insights and Forecast - by Type
- 8.1.1. Fitness Apps Tracking Fitness Achievements
- 8.1.2. Nutrition Apps
- 8.1.3. Meditation Apps
- 8.1.4. Contraception and Fertility Apps
- 8.1.5. Medication Checker Apps
- 8.1.6. Others Mindfulness Apps
- 8.1. Market Analysis, Insights and Forecast - by Type
- 9. Latin America Digital Fitness Apps Market Analysis, Insights and Forecast, 2020-2032
- 9.1. Market Analysis, Insights and Forecast - by Type
- 9.1.1. Fitness Apps Tracking Fitness Achievements
- 9.1.2. Nutrition Apps
- 9.1.3. Meditation Apps
- 9.1.4. Contraception and Fertility Apps
- 9.1.5. Medication Checker Apps
- 9.1.6. Others Mindfulness Apps
- 9.1. Market Analysis, Insights and Forecast - by Type
- 10. Middle East and Africa Digital Fitness Apps Market Analysis, Insights and Forecast, 2020-2032
- 10.1. Market Analysis, Insights and Forecast - by Type
- 10.1.1. Fitness Apps Tracking Fitness Achievements
- 10.1.2. Nutrition Apps
- 10.1.3. Meditation Apps
- 10.1.4. Contraception and Fertility Apps
- 10.1.5. Medication Checker Apps
- 10.1.6. Others Mindfulness Apps
- 10.1. Market Analysis, Insights and Forecast - by Type
- 11. Competitive Analysis
- 11.1. Global Market Share Analysis 2025
- 11.2. Company Profiles
- 11.2.1 Applico Inc
- 11.2.1.1. Overview
- 11.2.1.2. Products
- 11.2.1.3. SWOT Analysis
- 11.2.1.4. Recent Developments
- 11.2.1.5. Financials (Based on Availability)
- 11.2.2 Peloton Interactive Inc
- 11.2.2.1. Overview
- 11.2.2.2. Products
- 11.2.2.3. SWOT Analysis
- 11.2.2.4. Recent Developments
- 11.2.2.5. Financials (Based on Availability)
- 11.2.3 Strava Inc
- 11.2.3.1. Overview
- 11.2.3.2. Products
- 11.2.3.3. SWOT Analysis
- 11.2.3.4. Recent Developments
- 11.2.3.5. Financials (Based on Availability)
- 11.2.4 Sworkit Health
- 11.2.4.1. Overview
- 11.2.4.2. Products
- 11.2.4.3. SWOT Analysis
- 11.2.4.4. Recent Developments
- 11.2.4.5. Financials (Based on Availability)
- 11.2.5 MyFitnessPal Inc
- 11.2.5.1. Overview
- 11.2.5.2. Products
- 11.2.5.3. SWOT Analysis
- 11.2.5.4. Recent Developments
- 11.2.5.5. Financials (Based on Availability)
- 11.2.6 Famometer
- 11.2.6.1. Overview
- 11.2.6.2. Products
- 11.2.6.3. SWOT Analysis
- 11.2.6.4. Recent Developments
- 11.2.6.5. Financials (Based on Availability)
- 11.2.7 Headspace Inc
- 11.2.7.1. Overview
- 11.2.7.2. Products
- 11.2.7.3. SWOT Analysis
- 11.2.7.4. Recent Developments
- 11.2.7.5. Financials (Based on Availability)
- 11.2.8 Google
- 11.2.8.1. Overview
- 11.2.8.2. Products
- 11.2.8.3. SWOT Analysis
- 11.2.8.4. Recent Developments
- 11.2.8.5. Financials (Based on Availability)
- 11.2.9 Noom Inc
- 11.2.9.1. Overview
- 11.2.9.2. Products
- 11.2.9.3. SWOT Analysis
- 11.2.9.4. Recent Developments
- 11.2.9.5. Financials (Based on Availability)
- 11.2.10 Nike
- 11.2.10.1. Overview
- 11.2.10.2. Products
- 11.2.10.3. SWOT Analysis
- 11.2.10.4. Recent Developments
- 11.2.10.5. Financials (Based on Availability)
- 11.2.11 Firbit Inc
- 11.2.11.1. Overview
- 11.2.11.2. Products
- 11.2.11.3. SWOT Analysis
- 11.2.11.4. Recent Developments
- 11.2.11.5. Financials (Based on Availability)
- 11.2.12 Azumio Inc
- 11.2.12.1. Overview
- 11.2.12.2. Products
- 11.2.12.3. SWOT Analysis
- 11.2.12.4. Recent Developments
- 11.2.12.5. Financials (Based on Availability)
- 11.2.13 Adidas
- 11.2.13.1. Overview
- 11.2.13.2. Products
- 11.2.13.3. SWOT Analysis
- 11.2.13.4. Recent Developments
- 11.2.13.5. Financials (Based on Availability)
- 11.2.14 Flo Health Inc
- 11.2.14.1. Overview
- 11.2.14.2. Products
- 11.2.14.3. SWOT Analysis
- 11.2.14.4. Recent Developments
- 11.2.14.5. Financials (Based on Availability)
- 11.2.1 Applico Inc
List of Figures
- Figure 1: Global Digital Fitness Apps Market Revenue Breakdown (undefined, %) by Region 2025 & 2033
- Figure 2: Global Digital Fitness Apps Market Volume Breakdown (K Unit, %) by Region 2025 & 2033
- Figure 3: North America Digital Fitness Apps Market Revenue (undefined), by Type 2025 & 2033
- Figure 4: North America Digital Fitness Apps Market Volume (K Unit), by Type 2025 & 2033
- Figure 5: North America Digital Fitness Apps Market Revenue Share (%), by Type 2025 & 2033
- Figure 6: North America Digital Fitness Apps Market Volume Share (%), by Type 2025 & 2033
- Figure 7: North America Digital Fitness Apps Market Revenue (undefined), by Country 2025 & 2033
- Figure 8: North America Digital Fitness Apps Market Volume (K Unit), by Country 2025 & 2033
- Figure 9: North America Digital Fitness Apps Market Revenue Share (%), by Country 2025 & 2033
- Figure 10: North America Digital Fitness Apps Market Volume Share (%), by Country 2025 & 2033
- Figure 11: Europe Digital Fitness Apps Market Revenue (undefined), by Type 2025 & 2033
- Figure 12: Europe Digital Fitness Apps Market Volume (K Unit), by Type 2025 & 2033
- Figure 13: Europe Digital Fitness Apps Market Revenue Share (%), by Type 2025 & 2033
- Figure 14: Europe Digital Fitness Apps Market Volume Share (%), by Type 2025 & 2033
- Figure 15: Europe Digital Fitness Apps Market Revenue (undefined), by Country 2025 & 2033
- Figure 16: Europe Digital Fitness Apps Market Volume (K Unit), by Country 2025 & 2033
- Figure 17: Europe Digital Fitness Apps Market Revenue Share (%), by Country 2025 & 2033
- Figure 18: Europe Digital Fitness Apps Market Volume Share (%), by Country 2025 & 2033
- Figure 19: Asia Pacific Digital Fitness Apps Market Revenue (undefined), by Type 2025 & 2033
- Figure 20: Asia Pacific Digital Fitness Apps Market Volume (K Unit), by Type 2025 & 2033
- Figure 21: Asia Pacific Digital Fitness Apps Market Revenue Share (%), by Type 2025 & 2033
- Figure 22: Asia Pacific Digital Fitness Apps Market Volume Share (%), by Type 2025 & 2033
- Figure 23: Asia Pacific Digital Fitness Apps Market Revenue (undefined), by Country 2025 & 2033
- Figure 24: Asia Pacific Digital Fitness Apps Market Volume (K Unit), by Country 2025 & 2033
- Figure 25: Asia Pacific Digital Fitness Apps Market Revenue Share (%), by Country 2025 & 2033
- Figure 26: Asia Pacific Digital Fitness Apps Market Volume Share (%), by Country 2025 & 2033
- Figure 27: Latin America Digital Fitness Apps Market Revenue (undefined), by Type 2025 & 2033
- Figure 28: Latin America Digital Fitness Apps Market Volume (K Unit), by Type 2025 & 2033
- Figure 29: Latin America Digital Fitness Apps Market Revenue Share (%), by Type 2025 & 2033
- Figure 30: Latin America Digital Fitness Apps Market Volume Share (%), by Type 2025 & 2033
- Figure 31: Latin America Digital Fitness Apps Market Revenue (undefined), by Country 2025 & 2033
- Figure 32: Latin America Digital Fitness Apps Market Volume (K Unit), by Country 2025 & 2033
- Figure 33: Latin America Digital Fitness Apps Market Revenue Share (%), by Country 2025 & 2033
- Figure 34: Latin America Digital Fitness Apps Market Volume Share (%), by Country 2025 & 2033
- Figure 35: Middle East and Africa Digital Fitness Apps Market Revenue (undefined), by Type 2025 & 2033
- Figure 36: Middle East and Africa Digital Fitness Apps Market Volume (K Unit), by Type 2025 & 2033
- Figure 37: Middle East and Africa Digital Fitness Apps Market Revenue Share (%), by Type 2025 & 2033
- Figure 38: Middle East and Africa Digital Fitness Apps Market Volume Share (%), by Type 2025 & 2033
- Figure 39: Middle East and Africa Digital Fitness Apps Market Revenue (undefined), by Country 2025 & 2033
- Figure 40: Middle East and Africa Digital Fitness Apps Market Volume (K Unit), by Country 2025 & 2033
- Figure 41: Middle East and Africa Digital Fitness Apps Market Revenue Share (%), by Country 2025 & 2033
- Figure 42: Middle East and Africa Digital Fitness Apps Market Volume Share (%), by Country 2025 & 2033
List of Tables
- Table 1: Global Digital Fitness Apps Market Revenue undefined Forecast, by Type 2020 & 2033
- Table 2: Global Digital Fitness Apps Market Volume K Unit Forecast, by Type 2020 & 2033
- Table 3: Global Digital Fitness Apps Market Revenue undefined Forecast, by Region 2020 & 2033
- Table 4: Global Digital Fitness Apps Market Volume K Unit Forecast, by Region 2020 & 2033
- Table 5: Global Digital Fitness Apps Market Revenue undefined Forecast, by Type 2020 & 2033
- Table 6: Global Digital Fitness Apps Market Volume K Unit Forecast, by Type 2020 & 2033
- Table 7: Global Digital Fitness Apps Market Revenue undefined Forecast, by Country 2020 & 2033
- Table 8: Global Digital Fitness Apps Market Volume K Unit Forecast, by Country 2020 & 2033
- Table 9: Global Digital Fitness Apps Market Revenue undefined Forecast, by Type 2020 & 2033
- Table 10: Global Digital Fitness Apps Market Volume K Unit Forecast, by Type 2020 & 2033
- Table 11: Global Digital Fitness Apps Market Revenue undefined Forecast, by Country 2020 & 2033
- Table 12: Global Digital Fitness Apps Market Volume K Unit Forecast, by Country 2020 & 2033
- Table 13: Global Digital Fitness Apps Market Revenue undefined Forecast, by Type 2020 & 2033
- Table 14: Global Digital Fitness Apps Market Volume K Unit Forecast, by Type 2020 & 2033
- Table 15: Global Digital Fitness Apps Market Revenue undefined Forecast, by Country 2020 & 2033
- Table 16: Global Digital Fitness Apps Market Volume K Unit Forecast, by Country 2020 & 2033
- Table 17: Global Digital Fitness Apps Market Revenue undefined Forecast, by Type 2020 & 2033
- Table 18: Global Digital Fitness Apps Market Volume K Unit Forecast, by Type 2020 & 2033
- Table 19: Global Digital Fitness Apps Market Revenue undefined Forecast, by Country 2020 & 2033
- Table 20: Global Digital Fitness Apps Market Volume K Unit Forecast, by Country 2020 & 2033
- Table 21: Global Digital Fitness Apps Market Revenue undefined Forecast, by Type 2020 & 2033
- Table 22: Global Digital Fitness Apps Market Volume K Unit Forecast, by Type 2020 & 2033
- Table 23: Global Digital Fitness Apps Market Revenue undefined Forecast, by Country 2020 & 2033
- Table 24: Global Digital Fitness Apps Market Volume K Unit Forecast, by Country 2020 & 2033
Frequently Asked Questions
1. What is the projected Compound Annual Growth Rate (CAGR) of the Digital Fitness Apps Market?
The projected CAGR is approximately 13.4%.
2. Which companies are prominent players in the Digital Fitness Apps Market?
Key companies in the market include Applico Inc, Peloton Interactive Inc, Strava Inc, Sworkit Health, MyFitnessPal Inc, Famometer, Headspace Inc, Google, Noom Inc, Nike, Firbit Inc, Azumio Inc, Adidas, Flo Health Inc.
3. What are the main segments of the Digital Fitness Apps Market?
The market segments include Type.
4. Can you provide details about the market size?
The market size is estimated to be USD XXX N/A as of 2022.
5. What are some drivers contributing to market growth?
Significant Smartphone Penetration and Internet Coverage; Increased Investment on Digital Health.
6. What are the notable trends driving market growth?
Rapid Digitalization Aids Market Growth.
7. Are there any restraints impacting market growth?
Risk of Data Security Threats.
8. Can you provide examples of recent developments in the market?
In November 2022, Headspace Health, the provider of the world's most user-friendly, comprehensive digital mental health platform, unveiled a unique product experience that combines the top-tier coaching, therapy, and psychiatry services provided by Ginger with Headspace's world-class meditation and mindfulness offerings. The new experience offers employees a centralized location for high-quality mental health and well-being support and an underpinning platform that eases employers' complexity and administrative strain.
9. What pricing options are available for accessing the report?
Pricing options include single-user, multi-user, and enterprise licenses priced at USD 4750, USD 5250, and USD 8750 respectively.
10. Is the market size provided in terms of value or volume?
The market size is provided in terms of value, measured in N/A and volume, measured in K Unit.
11. Are there any specific market keywords associated with the report?
Yes, the market keyword associated with the report is "Digital Fitness Apps Market," which aids in identifying and referencing the specific market segment covered.
12. How do I determine which pricing option suits my needs best?
The pricing options vary based on user requirements and access needs. Individual users may opt for single-user licenses, while businesses requiring broader access may choose multi-user or enterprise licenses for cost-effective access to the report.
13. Are there any additional resources or data provided in the Digital Fitness Apps Market report?
While the report offers comprehensive insights, it's advisable to review the specific contents or supplementary materials provided to ascertain if additional resources or data are available.
14. How can I stay updated on further developments or reports in the Digital Fitness Apps Market?
To stay informed about further developments, trends, and reports in the Digital Fitness Apps Market, consider subscribing to industry newsletters, following relevant companies and organizations, or regularly checking reputable industry news sources and publications.
Methodology
Step 1 - Identification of Relevant Samples Size from Population Database


Step 2 - Approaches for Defining Global Market Size (Value, Volume* & Price*)

Note*: In applicable scenarios
Step 3 - Data Sources
Primary Research
- Web Analytics
- Survey Reports
- Research Institute
- Latest Research Reports
- Opinion Leaders
Secondary Research
- Annual Reports
- White Paper
- Latest Press Release
- Industry Association
- Paid Database
- Investor Presentations

Step 4 - Data Triangulation
Involves using different sources of information in order to increase the validity of a study
These sources are likely to be stakeholders in a program - participants, other researchers, program staff, other community members, and so on.
Then we put all data in single framework & apply various statistical tools to find out the dynamic on the market.
During the analysis stage, feedback from the stakeholder groups would be compared to determine areas of agreement as well as areas of divergence