


Key Insights
The global digital microfluidic chip market is experiencing robust growth, driven by increasing demand in diverse sectors like diagnostics, drug discovery, and point-of-care testing. The market's expansion is fueled by the technology's inherent advantages: high throughput, miniaturization capabilities, reduced reagent consumption, and ease of integration with other lab-on-a-chip devices. The substantial cost savings associated with automation and reduced manual handling contribute significantly to its adoption. While the market currently faces challenges related to manufacturing complexities and the need for standardized protocols, ongoing research and development efforts are addressing these limitations, paving the way for wider applications and increased market penetration. Key players like Illumina, PerkinElmer, and Boe Technology Group are actively investing in innovative designs and partnerships, further accelerating market growth. The forecast period of 2025-2033 promises substantial expansion, driven by innovations in microfabrication techniques and the integration of digital microfluidics with other advanced technologies like AI-powered diagnostics. This convergence is likely to unlock new opportunities across various healthcare and research applications.
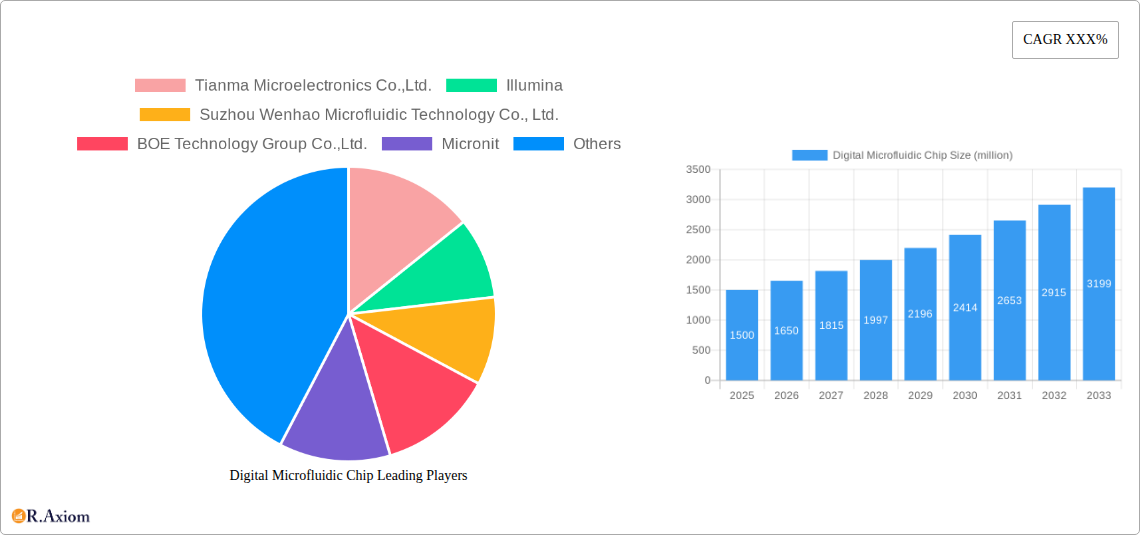
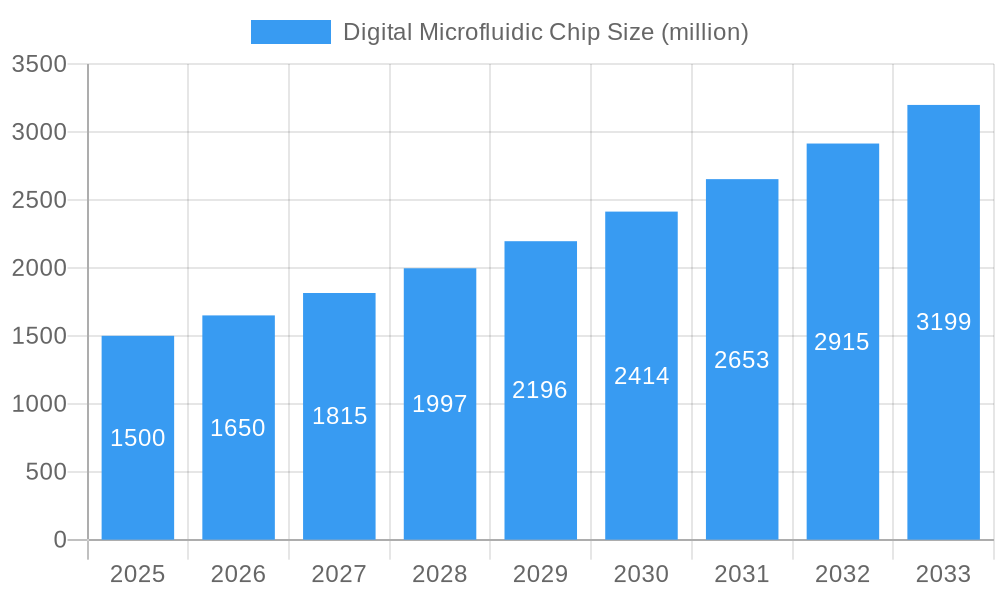
Digital Microfluidic Chip Market Size (In Billion)

The segment breakdown reveals strong growth in the healthcare sector, specifically in diagnostics and personalized medicine. The adoption of digital microfluidic chips in portable and point-of-care diagnostics is a major driver, enabling rapid and accurate results outside of traditional laboratory settings. The North American and European markets currently hold a significant share, owing to advanced healthcare infrastructure and regulatory support. However, Asia-Pacific is emerging as a rapidly growing region, propelled by increasing investment in research and development and a rising middle class with greater access to healthcare services. The competitive landscape is characterized by a mix of established players and innovative startups, leading to continuous innovation and a dynamic market environment.
Digital Microfluidic Chip Company Market Share
Digital Microfluidic Chip Market Report: A Comprehensive Analysis (2019-2033)
This in-depth report provides a comprehensive analysis of the global Digital Microfluidic Chip market, offering invaluable insights for stakeholders across the industry. With a study period spanning 2019-2033, a base year of 2025, and a forecast period of 2025-2033, this report delivers actionable intelligence on market size, segmentation, growth drivers, challenges, and emerging opportunities. The market is projected to reach xx million by 2033, showcasing significant growth potential. This report analyzes key players such as Tianma Microelectronics Co.,Ltd., Illumina, Suzhou Wenhao Microfluidic Technology Co., Ltd., BOE Technology Group Co.,Ltd., Micronit, Fluigent, PerkinElmer, Micralyne, Inc, and Hicomp Microtech (Suzhou) Co., Ltd., providing crucial competitive landscape analysis.
Digital Microfluidic Chip Market Concentration & Innovation
The Digital Microfluidic Chip market exhibits a moderately concentrated landscape, with a few major players commanding significant market share. While precise market share figures for individual companies remain confidential, we estimate that the top five companies collectively hold approximately 60% of the market. Innovation is a key driver, fueled by advancements in microfabrication techniques, material science, and control algorithms. Regulatory frameworks, while not overly restrictive, play a significant role in ensuring the safety and efficacy of these devices, particularly in healthcare applications. Product substitutes, such as traditional microfluidic systems, face competition from the inherent advantages of digital microfluidics in terms of flexibility and precision. End-user trends show increasing adoption across diverse sectors, including diagnostics, drug discovery, and point-of-care testing. M&A activity in the sector has seen several significant deals in recent years, with total deal values exceeding $xx million.
- Market Share Concentration: Top 5 players: ~60%
- M&A Deal Value (2019-2024): $xx million
- Key Innovation Drivers: Advanced microfabrication, material science, control algorithms.
Digital Microfluidic Chip Industry Trends & Insights
The Digital Microfluidic Chip market is experiencing robust growth, driven by a compelling confluence of factors. Technological disruptions, such as the integration of artificial intelligence and machine learning, are enhancing the capabilities and efficiency of these chips. Consumer preferences are shifting towards portable, automated, and high-throughput diagnostic tools, further fueling market demand. The increasing prevalence of chronic diseases globally contributes significantly to the market's expansion. The competitive dynamics are intense, with companies focusing on product differentiation, technological advancements, and strategic partnerships. The Compound Annual Growth Rate (CAGR) for the forecast period (2025-2033) is estimated to be xx%, while market penetration across various sectors is steadily increasing. Specific metrics relating to market penetration are included in the detailed report.
Dominant Markets & Segments in Digital Microfluidic Chip
The North American market currently holds the dominant position in the Digital Microfluidic Chip market, accounting for approximately xx% of the global market share in 2024. This dominance is attributable to several key factors:
- Robust R&D investment: Significant funding directed towards research and development in microfluidics.
- Strong regulatory framework: Well-established regulatory bodies ensuring product safety and efficacy.
- High adoption rates: Increased adoption of digital microfluidic chips in healthcare and diagnostics.
- Well-established infrastructure: Strong infrastructure facilitating the development and deployment of advanced technologies.
Detailed analysis within the report reveals that the diagnostics segment is also a leading segment within the market, driven by the growing need for efficient and portable diagnostic tools.
Digital Microfluidic Chip Product Developments
Recent product innovations focus on miniaturization, enhanced control systems, improved biocompatibility, and integration with advanced detection methods. New applications are constantly emerging, extending beyond diagnostics to encompass areas such as environmental monitoring, food safety, and industrial process control. Competitive advantages are achieved through proprietary technologies, superior performance, and strategic partnerships. Technological trends indicate a move towards fully integrated, automated systems, further enhancing the market appeal of digital microfluidic chips.
Report Scope & Segmentation Analysis
The report offers a comprehensive segmentation analysis of the Digital Microfluidic Chip market based on several key parameters. These include segmentation by type (e.g., material, size, function), application (e.g., diagnostics, drug discovery, environmental monitoring), and end-user (e.g., healthcare, research institutions, industrial). Each segment's growth projections, market sizes, and competitive dynamics are analyzed in detail within the report, offering a granular perspective on the market landscape.
Key Drivers of Digital Microfluidic Chip Growth
Several factors contribute to the significant growth trajectory of the Digital Microfluidic Chip market. Technological advancements, such as improved fabrication techniques and control algorithms, are central to this growth. The increasing demand for point-of-care diagnostics and personalized medicine, coupled with supportive government regulations and initiatives, drives market expansion. The cost-effectiveness and scalability of digital microfluidic chips contribute to their wider adoption.
Challenges in the Digital Microfluidic Chip Sector
The Digital Microfluidic Chip market faces challenges including high initial investment costs associated with chip fabrication and specialized equipment. Supply chain complexities and potential material scarcity can impact production efficiency. Intense competition among established players and new entrants create pricing pressures. Regulatory hurdles and stringent quality control standards necessitate significant compliance efforts. These factors can collectively impact market growth if not addressed effectively. The overall impact is estimated to result in a loss of approximately $xx million annually.
Emerging Opportunities in Digital Microfluidic Chip
Emerging opportunities abound in the Digital Microfluidic Chip market. Expansion into new application areas, such as environmental monitoring, food safety testing, and industrial process control, offers significant growth potential. The integration of advanced technologies, such as artificial intelligence and nanotechnology, can enhance chip functionality and create new market niches. Growing consumer demand for personalized and accessible healthcare fuels the market further.
Leading Players in the Digital Microfluidic Chip Market
- Tianma Microelectronics Co.,Ltd.
- Illumina
- Suzhou Wenhao Microfluidic Technology Co., Ltd.
- BOE Technology Group Co.,Ltd.
- Micronit
- Fluigent
- PerkinElmer
- Micralyne, Inc
- Hicomp Microtech (Suzhou) Co., Ltd
Key Developments in Digital Microfluidic Chip Industry
- 2022 Q4: Illumina launched a new digital microfluidic chip with enhanced sensitivity.
- 2023 Q1: Micronit announced a strategic partnership for the development of a new generation of chips for point-of-care diagnostics.
- 2024 Q2: BOE Technology Group invested $xx million in expanding its digital microfluidic chip production capacity. (Further details in the full report.)
Strategic Outlook for Digital Microfluidic Chip Market
The Digital Microfluidic Chip market exhibits strong potential for continued growth driven by technological innovation, increasing healthcare demand, and expansion into new applications. Strategic partnerships, investments in R&D, and expansion into emerging markets will be crucial for companies seeking to capitalize on the market's future opportunities. The market is poised for substantial expansion in the next decade, presenting a compelling investment proposition for both existing and new players.
Digital Microfluidic Chip Segmentation
-
1. Application
- 1.1. Chemical Synthesis
- 1.2. Biological Analysis
- 1.3. In Vitro Diagnostics
- 1.4. Other
-
2. Type
- 2.1. Active Digital Microfluidic Chip
- 2.2. Passive Digital Microfluidic Chip
Digital Microfluidic Chip Segmentation By Geography
-
1. North America
- 1.1. United States
- 1.2. Canada
- 1.3. Mexico
-
2. South America
- 2.1. Brazil
- 2.2. Argentina
- 2.3. Rest of South America
-
3. Europe
- 3.1. United Kingdom
- 3.2. Germany
- 3.3. France
- 3.4. Italy
- 3.5. Spain
- 3.6. Russia
- 3.7. Benelux
- 3.8. Nordics
- 3.9. Rest of Europe
-
4. Middle East & Africa
- 4.1. Turkey
- 4.2. Israel
- 4.3. GCC
- 4.4. North Africa
- 4.5. South Africa
- 4.6. Rest of Middle East & Africa
-
5. Asia Pacific
- 5.1. China
- 5.2. India
- 5.3. Japan
- 5.4. South Korea
- 5.5. ASEAN
- 5.6. Oceania
- 5.7. Rest of Asia Pacific

Digital Microfluidic Chip Regional Market Share
Geographic Coverage of Digital Microfluidic Chip
Digital Microfluidic Chip REPORT HIGHLIGHTS
| Aspects | Details |
|---|---|
| Study Period | 2020-2034 |
| Base Year | 2025 |
| Estimated Year | 2026 |
| Forecast Period | 2026-2034 |
| Historical Period | 2020-2025 |
| Growth Rate | CAGR of 12.22% from 2020-2034 |
| Segmentation |
|
Table of Contents
- 1. Introduction
- 1.1. Research Scope
- 1.2. Market Segmentation
- 1.3. Research Methodology
- 1.4. Definitions and Assumptions
- 2. Executive Summary
- 2.1. Introduction
- 3. Market Dynamics
- 3.1. Introduction
- 3.2. Market Drivers
- 3.3. Market Restrains
- 3.4. Market Trends
- 4. Market Factor Analysis
- 4.1. Porters Five Forces
- 4.2. Supply/Value Chain
- 4.3. PESTEL analysis
- 4.4. Market Entropy
- 4.5. Patent/Trademark Analysis
- 5. Global Digital Microfluidic Chip Analysis, Insights and Forecast, 2020-2032
- 5.1. Market Analysis, Insights and Forecast - by Application
- 5.1.1. Chemical Synthesis
- 5.1.2. Biological Analysis
- 5.1.3. In Vitro Diagnostics
- 5.1.4. Other
- 5.2. Market Analysis, Insights and Forecast - by Type
- 5.2.1. Active Digital Microfluidic Chip
- 5.2.2. Passive Digital Microfluidic Chip
- 5.3. Market Analysis, Insights and Forecast - by Region
- 5.3.1. North America
- 5.3.2. South America
- 5.3.3. Europe
- 5.3.4. Middle East & Africa
- 5.3.5. Asia Pacific
- 5.1. Market Analysis, Insights and Forecast - by Application
- 6. North America Digital Microfluidic Chip Analysis, Insights and Forecast, 2020-2032
- 6.1. Market Analysis, Insights and Forecast - by Application
- 6.1.1. Chemical Synthesis
- 6.1.2. Biological Analysis
- 6.1.3. In Vitro Diagnostics
- 6.1.4. Other
- 6.2. Market Analysis, Insights and Forecast - by Type
- 6.2.1. Active Digital Microfluidic Chip
- 6.2.2. Passive Digital Microfluidic Chip
- 6.1. Market Analysis, Insights and Forecast - by Application
- 7. South America Digital Microfluidic Chip Analysis, Insights and Forecast, 2020-2032
- 7.1. Market Analysis, Insights and Forecast - by Application
- 7.1.1. Chemical Synthesis
- 7.1.2. Biological Analysis
- 7.1.3. In Vitro Diagnostics
- 7.1.4. Other
- 7.2. Market Analysis, Insights and Forecast - by Type
- 7.2.1. Active Digital Microfluidic Chip
- 7.2.2. Passive Digital Microfluidic Chip
- 7.1. Market Analysis, Insights and Forecast - by Application
- 8. Europe Digital Microfluidic Chip Analysis, Insights and Forecast, 2020-2032
- 8.1. Market Analysis, Insights and Forecast - by Application
- 8.1.1. Chemical Synthesis
- 8.1.2. Biological Analysis
- 8.1.3. In Vitro Diagnostics
- 8.1.4. Other
- 8.2. Market Analysis, Insights and Forecast - by Type
- 8.2.1. Active Digital Microfluidic Chip
- 8.2.2. Passive Digital Microfluidic Chip
- 8.1. Market Analysis, Insights and Forecast - by Application
- 9. Middle East & Africa Digital Microfluidic Chip Analysis, Insights and Forecast, 2020-2032
- 9.1. Market Analysis, Insights and Forecast - by Application
- 9.1.1. Chemical Synthesis
- 9.1.2. Biological Analysis
- 9.1.3. In Vitro Diagnostics
- 9.1.4. Other
- 9.2. Market Analysis, Insights and Forecast - by Type
- 9.2.1. Active Digital Microfluidic Chip
- 9.2.2. Passive Digital Microfluidic Chip
- 9.1. Market Analysis, Insights and Forecast - by Application
- 10. Asia Pacific Digital Microfluidic Chip Analysis, Insights and Forecast, 2020-2032
- 10.1. Market Analysis, Insights and Forecast - by Application
- 10.1.1. Chemical Synthesis
- 10.1.2. Biological Analysis
- 10.1.3. In Vitro Diagnostics
- 10.1.4. Other
- 10.2. Market Analysis, Insights and Forecast - by Type
- 10.2.1. Active Digital Microfluidic Chip
- 10.2.2. Passive Digital Microfluidic Chip
- 10.1. Market Analysis, Insights and Forecast - by Application
- 11. Competitive Analysis
- 11.1. Global Market Share Analysis 2025
- 11.2. Company Profiles
- 11.2.1 Tianma Microelectronics Co.Ltd.
- 11.2.1.1. Overview
- 11.2.1.2. Products
- 11.2.1.3. SWOT Analysis
- 11.2.1.4. Recent Developments
- 11.2.1.5. Financials (Based on Availability)
- 11.2.2 Illumina
- 11.2.2.1. Overview
- 11.2.2.2. Products
- 11.2.2.3. SWOT Analysis
- 11.2.2.4. Recent Developments
- 11.2.2.5. Financials (Based on Availability)
- 11.2.3 Suzhou Wenhao Microfluidic Technology Co. Ltd.
- 11.2.3.1. Overview
- 11.2.3.2. Products
- 11.2.3.3. SWOT Analysis
- 11.2.3.4. Recent Developments
- 11.2.3.5. Financials (Based on Availability)
- 11.2.4 BOE Technology Group Co.Ltd.
- 11.2.4.1. Overview
- 11.2.4.2. Products
- 11.2.4.3. SWOT Analysis
- 11.2.4.4. Recent Developments
- 11.2.4.5. Financials (Based on Availability)
- 11.2.5 Micronit
- 11.2.5.1. Overview
- 11.2.5.2. Products
- 11.2.5.3. SWOT Analysis
- 11.2.5.4. Recent Developments
- 11.2.5.5. Financials (Based on Availability)
- 11.2.6 Fluigent
- 11.2.6.1. Overview
- 11.2.6.2. Products
- 11.2.6.3. SWOT Analysis
- 11.2.6.4. Recent Developments
- 11.2.6.5. Financials (Based on Availability)
- 11.2.7 PerkinElmer
- 11.2.7.1. Overview
- 11.2.7.2. Products
- 11.2.7.3. SWOT Analysis
- 11.2.7.4. Recent Developments
- 11.2.7.5. Financials (Based on Availability)
- 11.2.8 Micralyne Inc
- 11.2.8.1. Overview
- 11.2.8.2. Products
- 11.2.8.3. SWOT Analysis
- 11.2.8.4. Recent Developments
- 11.2.8.5. Financials (Based on Availability)
- 11.2.9 Hicomp Microtech (Suzhou) Co. Ltd
- 11.2.9.1. Overview
- 11.2.9.2. Products
- 11.2.9.3. SWOT Analysis
- 11.2.9.4. Recent Developments
- 11.2.9.5. Financials (Based on Availability)
- 11.2.1 Tianma Microelectronics Co.Ltd.
List of Figures
- Figure 1: Global Digital Microfluidic Chip Revenue Breakdown (undefined, %) by Region 2025 & 2033
- Figure 2: Global Digital Microfluidic Chip Volume Breakdown (K, %) by Region 2025 & 2033
- Figure 3: North America Digital Microfluidic Chip Revenue (undefined), by Application 2025 & 2033
- Figure 4: North America Digital Microfluidic Chip Volume (K), by Application 2025 & 2033
- Figure 5: North America Digital Microfluidic Chip Revenue Share (%), by Application 2025 & 2033
- Figure 6: North America Digital Microfluidic Chip Volume Share (%), by Application 2025 & 2033
- Figure 7: North America Digital Microfluidic Chip Revenue (undefined), by Type 2025 & 2033
- Figure 8: North America Digital Microfluidic Chip Volume (K), by Type 2025 & 2033
- Figure 9: North America Digital Microfluidic Chip Revenue Share (%), by Type 2025 & 2033
- Figure 10: North America Digital Microfluidic Chip Volume Share (%), by Type 2025 & 2033
- Figure 11: North America Digital Microfluidic Chip Revenue (undefined), by Country 2025 & 2033
- Figure 12: North America Digital Microfluidic Chip Volume (K), by Country 2025 & 2033
- Figure 13: North America Digital Microfluidic Chip Revenue Share (%), by Country 2025 & 2033
- Figure 14: North America Digital Microfluidic Chip Volume Share (%), by Country 2025 & 2033
- Figure 15: South America Digital Microfluidic Chip Revenue (undefined), by Application 2025 & 2033
- Figure 16: South America Digital Microfluidic Chip Volume (K), by Application 2025 & 2033
- Figure 17: South America Digital Microfluidic Chip Revenue Share (%), by Application 2025 & 2033
- Figure 18: South America Digital Microfluidic Chip Volume Share (%), by Application 2025 & 2033
- Figure 19: South America Digital Microfluidic Chip Revenue (undefined), by Type 2025 & 2033
- Figure 20: South America Digital Microfluidic Chip Volume (K), by Type 2025 & 2033
- Figure 21: South America Digital Microfluidic Chip Revenue Share (%), by Type 2025 & 2033
- Figure 22: South America Digital Microfluidic Chip Volume Share (%), by Type 2025 & 2033
- Figure 23: South America Digital Microfluidic Chip Revenue (undefined), by Country 2025 & 2033
- Figure 24: South America Digital Microfluidic Chip Volume (K), by Country 2025 & 2033
- Figure 25: South America Digital Microfluidic Chip Revenue Share (%), by Country 2025 & 2033
- Figure 26: South America Digital Microfluidic Chip Volume Share (%), by Country 2025 & 2033
- Figure 27: Europe Digital Microfluidic Chip Revenue (undefined), by Application 2025 & 2033
- Figure 28: Europe Digital Microfluidic Chip Volume (K), by Application 2025 & 2033
- Figure 29: Europe Digital Microfluidic Chip Revenue Share (%), by Application 2025 & 2033
- Figure 30: Europe Digital Microfluidic Chip Volume Share (%), by Application 2025 & 2033
- Figure 31: Europe Digital Microfluidic Chip Revenue (undefined), by Type 2025 & 2033
- Figure 32: Europe Digital Microfluidic Chip Volume (K), by Type 2025 & 2033
- Figure 33: Europe Digital Microfluidic Chip Revenue Share (%), by Type 2025 & 2033
- Figure 34: Europe Digital Microfluidic Chip Volume Share (%), by Type 2025 & 2033
- Figure 35: Europe Digital Microfluidic Chip Revenue (undefined), by Country 2025 & 2033
- Figure 36: Europe Digital Microfluidic Chip Volume (K), by Country 2025 & 2033
- Figure 37: Europe Digital Microfluidic Chip Revenue Share (%), by Country 2025 & 2033
- Figure 38: Europe Digital Microfluidic Chip Volume Share (%), by Country 2025 & 2033
- Figure 39: Middle East & Africa Digital Microfluidic Chip Revenue (undefined), by Application 2025 & 2033
- Figure 40: Middle East & Africa Digital Microfluidic Chip Volume (K), by Application 2025 & 2033
- Figure 41: Middle East & Africa Digital Microfluidic Chip Revenue Share (%), by Application 2025 & 2033
- Figure 42: Middle East & Africa Digital Microfluidic Chip Volume Share (%), by Application 2025 & 2033
- Figure 43: Middle East & Africa Digital Microfluidic Chip Revenue (undefined), by Type 2025 & 2033
- Figure 44: Middle East & Africa Digital Microfluidic Chip Volume (K), by Type 2025 & 2033
- Figure 45: Middle East & Africa Digital Microfluidic Chip Revenue Share (%), by Type 2025 & 2033
- Figure 46: Middle East & Africa Digital Microfluidic Chip Volume Share (%), by Type 2025 & 2033
- Figure 47: Middle East & Africa Digital Microfluidic Chip Revenue (undefined), by Country 2025 & 2033
- Figure 48: Middle East & Africa Digital Microfluidic Chip Volume (K), by Country 2025 & 2033
- Figure 49: Middle East & Africa Digital Microfluidic Chip Revenue Share (%), by Country 2025 & 2033
- Figure 50: Middle East & Africa Digital Microfluidic Chip Volume Share (%), by Country 2025 & 2033
- Figure 51: Asia Pacific Digital Microfluidic Chip Revenue (undefined), by Application 2025 & 2033
- Figure 52: Asia Pacific Digital Microfluidic Chip Volume (K), by Application 2025 & 2033
- Figure 53: Asia Pacific Digital Microfluidic Chip Revenue Share (%), by Application 2025 & 2033
- Figure 54: Asia Pacific Digital Microfluidic Chip Volume Share (%), by Application 2025 & 2033
- Figure 55: Asia Pacific Digital Microfluidic Chip Revenue (undefined), by Type 2025 & 2033
- Figure 56: Asia Pacific Digital Microfluidic Chip Volume (K), by Type 2025 & 2033
- Figure 57: Asia Pacific Digital Microfluidic Chip Revenue Share (%), by Type 2025 & 2033
- Figure 58: Asia Pacific Digital Microfluidic Chip Volume Share (%), by Type 2025 & 2033
- Figure 59: Asia Pacific Digital Microfluidic Chip Revenue (undefined), by Country 2025 & 2033
- Figure 60: Asia Pacific Digital Microfluidic Chip Volume (K), by Country 2025 & 2033
- Figure 61: Asia Pacific Digital Microfluidic Chip Revenue Share (%), by Country 2025 & 2033
- Figure 62: Asia Pacific Digital Microfluidic Chip Volume Share (%), by Country 2025 & 2033
List of Tables
- Table 1: Global Digital Microfluidic Chip Revenue undefined Forecast, by Application 2020 & 2033
- Table 2: Global Digital Microfluidic Chip Volume K Forecast, by Application 2020 & 2033
- Table 3: Global Digital Microfluidic Chip Revenue undefined Forecast, by Type 2020 & 2033
- Table 4: Global Digital Microfluidic Chip Volume K Forecast, by Type 2020 & 2033
- Table 5: Global Digital Microfluidic Chip Revenue undefined Forecast, by Region 2020 & 2033
- Table 6: Global Digital Microfluidic Chip Volume K Forecast, by Region 2020 & 2033
- Table 7: Global Digital Microfluidic Chip Revenue undefined Forecast, by Application 2020 & 2033
- Table 8: Global Digital Microfluidic Chip Volume K Forecast, by Application 2020 & 2033
- Table 9: Global Digital Microfluidic Chip Revenue undefined Forecast, by Type 2020 & 2033
- Table 10: Global Digital Microfluidic Chip Volume K Forecast, by Type 2020 & 2033
- Table 11: Global Digital Microfluidic Chip Revenue undefined Forecast, by Country 2020 & 2033
- Table 12: Global Digital Microfluidic Chip Volume K Forecast, by Country 2020 & 2033
- Table 13: United States Digital Microfluidic Chip Revenue (undefined) Forecast, by Application 2020 & 2033
- Table 14: United States Digital Microfluidic Chip Volume (K) Forecast, by Application 2020 & 2033
- Table 15: Canada Digital Microfluidic Chip Revenue (undefined) Forecast, by Application 2020 & 2033
- Table 16: Canada Digital Microfluidic Chip Volume (K) Forecast, by Application 2020 & 2033
- Table 17: Mexico Digital Microfluidic Chip Revenue (undefined) Forecast, by Application 2020 & 2033
- Table 18: Mexico Digital Microfluidic Chip Volume (K) Forecast, by Application 2020 & 2033
- Table 19: Global Digital Microfluidic Chip Revenue undefined Forecast, by Application 2020 & 2033
- Table 20: Global Digital Microfluidic Chip Volume K Forecast, by Application 2020 & 2033
- Table 21: Global Digital Microfluidic Chip Revenue undefined Forecast, by Type 2020 & 2033
- Table 22: Global Digital Microfluidic Chip Volume K Forecast, by Type 2020 & 2033
- Table 23: Global Digital Microfluidic Chip Revenue undefined Forecast, by Country 2020 & 2033
- Table 24: Global Digital Microfluidic Chip Volume K Forecast, by Country 2020 & 2033
- Table 25: Brazil Digital Microfluidic Chip Revenue (undefined) Forecast, by Application 2020 & 2033
- Table 26: Brazil Digital Microfluidic Chip Volume (K) Forecast, by Application 2020 & 2033
- Table 27: Argentina Digital Microfluidic Chip Revenue (undefined) Forecast, by Application 2020 & 2033
- Table 28: Argentina Digital Microfluidic Chip Volume (K) Forecast, by Application 2020 & 2033
- Table 29: Rest of South America Digital Microfluidic Chip Revenue (undefined) Forecast, by Application 2020 & 2033
- Table 30: Rest of South America Digital Microfluidic Chip Volume (K) Forecast, by Application 2020 & 2033
- Table 31: Global Digital Microfluidic Chip Revenue undefined Forecast, by Application 2020 & 2033
- Table 32: Global Digital Microfluidic Chip Volume K Forecast, by Application 2020 & 2033
- Table 33: Global Digital Microfluidic Chip Revenue undefined Forecast, by Type 2020 & 2033
- Table 34: Global Digital Microfluidic Chip Volume K Forecast, by Type 2020 & 2033
- Table 35: Global Digital Microfluidic Chip Revenue undefined Forecast, by Country 2020 & 2033
- Table 36: Global Digital Microfluidic Chip Volume K Forecast, by Country 2020 & 2033
- Table 37: United Kingdom Digital Microfluidic Chip Revenue (undefined) Forecast, by Application 2020 & 2033
- Table 38: United Kingdom Digital Microfluidic Chip Volume (K) Forecast, by Application 2020 & 2033
- Table 39: Germany Digital Microfluidic Chip Revenue (undefined) Forecast, by Application 2020 & 2033
- Table 40: Germany Digital Microfluidic Chip Volume (K) Forecast, by Application 2020 & 2033
- Table 41: France Digital Microfluidic Chip Revenue (undefined) Forecast, by Application 2020 & 2033
- Table 42: France Digital Microfluidic Chip Volume (K) Forecast, by Application 2020 & 2033
- Table 43: Italy Digital Microfluidic Chip Revenue (undefined) Forecast, by Application 2020 & 2033
- Table 44: Italy Digital Microfluidic Chip Volume (K) Forecast, by Application 2020 & 2033
- Table 45: Spain Digital Microfluidic Chip Revenue (undefined) Forecast, by Application 2020 & 2033
- Table 46: Spain Digital Microfluidic Chip Volume (K) Forecast, by Application 2020 & 2033
- Table 47: Russia Digital Microfluidic Chip Revenue (undefined) Forecast, by Application 2020 & 2033
- Table 48: Russia Digital Microfluidic Chip Volume (K) Forecast, by Application 2020 & 2033
- Table 49: Benelux Digital Microfluidic Chip Revenue (undefined) Forecast, by Application 2020 & 2033
- Table 50: Benelux Digital Microfluidic Chip Volume (K) Forecast, by Application 2020 & 2033
- Table 51: Nordics Digital Microfluidic Chip Revenue (undefined) Forecast, by Application 2020 & 2033
- Table 52: Nordics Digital Microfluidic Chip Volume (K) Forecast, by Application 2020 & 2033
- Table 53: Rest of Europe Digital Microfluidic Chip Revenue (undefined) Forecast, by Application 2020 & 2033
- Table 54: Rest of Europe Digital Microfluidic Chip Volume (K) Forecast, by Application 2020 & 2033
- Table 55: Global Digital Microfluidic Chip Revenue undefined Forecast, by Application 2020 & 2033
- Table 56: Global Digital Microfluidic Chip Volume K Forecast, by Application 2020 & 2033
- Table 57: Global Digital Microfluidic Chip Revenue undefined Forecast, by Type 2020 & 2033
- Table 58: Global Digital Microfluidic Chip Volume K Forecast, by Type 2020 & 2033
- Table 59: Global Digital Microfluidic Chip Revenue undefined Forecast, by Country 2020 & 2033
- Table 60: Global Digital Microfluidic Chip Volume K Forecast, by Country 2020 & 2033
- Table 61: Turkey Digital Microfluidic Chip Revenue (undefined) Forecast, by Application 2020 & 2033
- Table 62: Turkey Digital Microfluidic Chip Volume (K) Forecast, by Application 2020 & 2033
- Table 63: Israel Digital Microfluidic Chip Revenue (undefined) Forecast, by Application 2020 & 2033
- Table 64: Israel Digital Microfluidic Chip Volume (K) Forecast, by Application 2020 & 2033
- Table 65: GCC Digital Microfluidic Chip Revenue (undefined) Forecast, by Application 2020 & 2033
- Table 66: GCC Digital Microfluidic Chip Volume (K) Forecast, by Application 2020 & 2033
- Table 67: North Africa Digital Microfluidic Chip Revenue (undefined) Forecast, by Application 2020 & 2033
- Table 68: North Africa Digital Microfluidic Chip Volume (K) Forecast, by Application 2020 & 2033
- Table 69: South Africa Digital Microfluidic Chip Revenue (undefined) Forecast, by Application 2020 & 2033
- Table 70: South Africa Digital Microfluidic Chip Volume (K) Forecast, by Application 2020 & 2033
- Table 71: Rest of Middle East & Africa Digital Microfluidic Chip Revenue (undefined) Forecast, by Application 2020 & 2033
- Table 72: Rest of Middle East & Africa Digital Microfluidic Chip Volume (K) Forecast, by Application 2020 & 2033
- Table 73: Global Digital Microfluidic Chip Revenue undefined Forecast, by Application 2020 & 2033
- Table 74: Global Digital Microfluidic Chip Volume K Forecast, by Application 2020 & 2033
- Table 75: Global Digital Microfluidic Chip Revenue undefined Forecast, by Type 2020 & 2033
- Table 76: Global Digital Microfluidic Chip Volume K Forecast, by Type 2020 & 2033
- Table 77: Global Digital Microfluidic Chip Revenue undefined Forecast, by Country 2020 & 2033
- Table 78: Global Digital Microfluidic Chip Volume K Forecast, by Country 2020 & 2033
- Table 79: China Digital Microfluidic Chip Revenue (undefined) Forecast, by Application 2020 & 2033
- Table 80: China Digital Microfluidic Chip Volume (K) Forecast, by Application 2020 & 2033
- Table 81: India Digital Microfluidic Chip Revenue (undefined) Forecast, by Application 2020 & 2033
- Table 82: India Digital Microfluidic Chip Volume (K) Forecast, by Application 2020 & 2033
- Table 83: Japan Digital Microfluidic Chip Revenue (undefined) Forecast, by Application 2020 & 2033
- Table 84: Japan Digital Microfluidic Chip Volume (K) Forecast, by Application 2020 & 2033
- Table 85: South Korea Digital Microfluidic Chip Revenue (undefined) Forecast, by Application 2020 & 2033
- Table 86: South Korea Digital Microfluidic Chip Volume (K) Forecast, by Application 2020 & 2033
- Table 87: ASEAN Digital Microfluidic Chip Revenue (undefined) Forecast, by Application 2020 & 2033
- Table 88: ASEAN Digital Microfluidic Chip Volume (K) Forecast, by Application 2020 & 2033
- Table 89: Oceania Digital Microfluidic Chip Revenue (undefined) Forecast, by Application 2020 & 2033
- Table 90: Oceania Digital Microfluidic Chip Volume (K) Forecast, by Application 2020 & 2033
- Table 91: Rest of Asia Pacific Digital Microfluidic Chip Revenue (undefined) Forecast, by Application 2020 & 2033
- Table 92: Rest of Asia Pacific Digital Microfluidic Chip Volume (K) Forecast, by Application 2020 & 2033
Frequently Asked Questions
1. What is the projected Compound Annual Growth Rate (CAGR) of the Digital Microfluidic Chip?
The projected CAGR is approximately 12.22%.
2. Which companies are prominent players in the Digital Microfluidic Chip?
Key companies in the market include Tianma Microelectronics Co.,Ltd., Illumina, Suzhou Wenhao Microfluidic Technology Co., Ltd., BOE Technology Group Co.,Ltd., Micronit, Fluigent, PerkinElmer, Micralyne, Inc, Hicomp Microtech (Suzhou) Co., Ltd.
3. What are the main segments of the Digital Microfluidic Chip?
The market segments include Application, Type.
4. Can you provide details about the market size?
The market size is estimated to be USD XXX N/A as of 2022.
5. What are some drivers contributing to market growth?
N/A
6. What are the notable trends driving market growth?
N/A
7. Are there any restraints impacting market growth?
N/A
8. Can you provide examples of recent developments in the market?
N/A
9. What pricing options are available for accessing the report?
Pricing options include single-user, multi-user, and enterprise licenses priced at USD 3950.00, USD 5925.00, and USD 7900.00 respectively.
10. Is the market size provided in terms of value or volume?
The market size is provided in terms of value, measured in N/A and volume, measured in K.
11. Are there any specific market keywords associated with the report?
Yes, the market keyword associated with the report is "Digital Microfluidic Chip," which aids in identifying and referencing the specific market segment covered.
12. How do I determine which pricing option suits my needs best?
The pricing options vary based on user requirements and access needs. Individual users may opt for single-user licenses, while businesses requiring broader access may choose multi-user or enterprise licenses for cost-effective access to the report.
13. Are there any additional resources or data provided in the Digital Microfluidic Chip report?
While the report offers comprehensive insights, it's advisable to review the specific contents or supplementary materials provided to ascertain if additional resources or data are available.
14. How can I stay updated on further developments or reports in the Digital Microfluidic Chip?
To stay informed about further developments, trends, and reports in the Digital Microfluidic Chip, consider subscribing to industry newsletters, following relevant companies and organizations, or regularly checking reputable industry news sources and publications.
Methodology
Step 1 - Identification of Relevant Samples Size from Population Database


Step 2 - Approaches for Defining Global Market Size (Value, Volume* & Price*)

Note*: In applicable scenarios
Step 3 - Data Sources
Primary Research
- Web Analytics
- Survey Reports
- Research Institute
- Latest Research Reports
- Opinion Leaders
Secondary Research
- Annual Reports
- White Paper
- Latest Press Release
- Industry Association
- Paid Database
- Investor Presentations

Step 4 - Data Triangulation
Involves using different sources of information in order to increase the validity of a study
These sources are likely to be stakeholders in a program - participants, other researchers, program staff, other community members, and so on.
Then we put all data in single framework & apply various statistical tools to find out the dynamic on the market.
During the analysis stage, feedback from the stakeholder groups would be compared to determine areas of agreement as well as areas of divergence