Key Insights
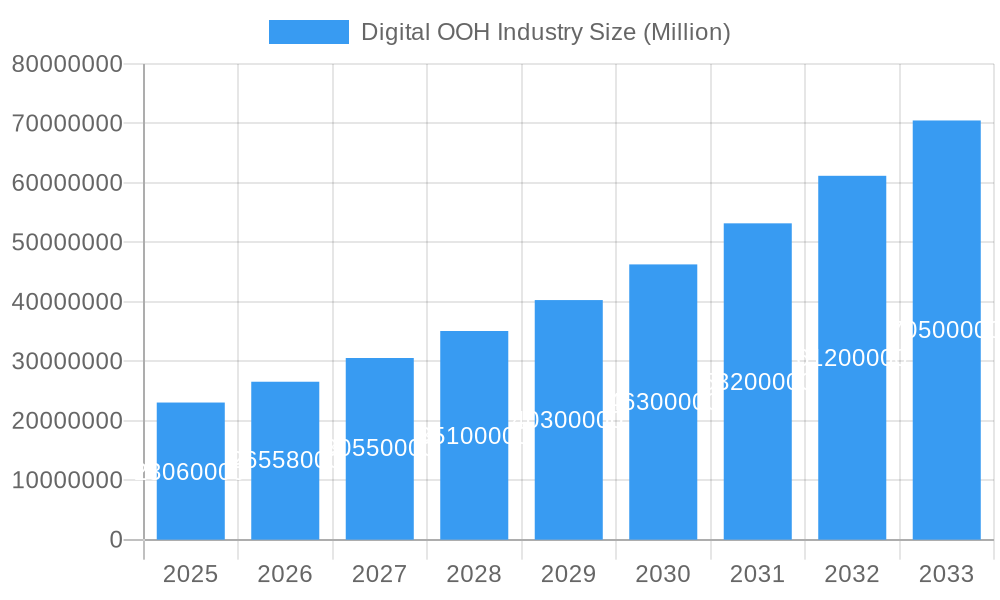
The Digital Out-of-Home (DOOH) advertising market is poised for substantial growth, projected to reach $23.06 million by 2025, with an impressive Compound Annual Growth Rate (CAGR) of 15.20% through 2033. This rapid expansion is fueled by several key drivers, most notably the increasing demand for dynamic and targeted advertising capabilities that digital screens offer over traditional static billboards. The ability to display real-time content, personalize campaigns based on audience demographics, and measure ad performance with greater accuracy makes DOOH an increasingly attractive proposition for advertisers. Furthermore, advancements in programmatic DOOH buying platforms are streamlining the media planning and buying process, making DOOH more accessible and efficient for a wider range of businesses. The integration of interactive elements, such as augmented reality (AR) and mobile integrations, is also enhancing audience engagement and creating memorable brand experiences.
Digital OOH Industry Market Size (In Million)
Key trends shaping the DOOH landscape include the proliferation of digital screens in high-traffic public spaces, such as transit hubs, street furniture, and retail environments, catering to the 'always-on' consumer. The retail sector, in particular, is leveraging DOOH for in-store promotions, brand visibility, and driving foot traffic. The healthcare and pharmaceutical industries are also increasingly adopting DOOH for public health campaigns and product awareness. While the growth is robust, some restraints exist, including initial setup costs for digital infrastructure and the ongoing need for content creation and management. However, the increasing adoption of programmatic technologies and the proven ROI of DOOH campaigns are steadily mitigating these challenges. The market is segmented across various applications like billboards, transit, and street furniture, with a diverse range of end-users including retail, healthcare, financial services, automotive, and government agencies, all contributing to the vibrant and expanding DOOH ecosystem.
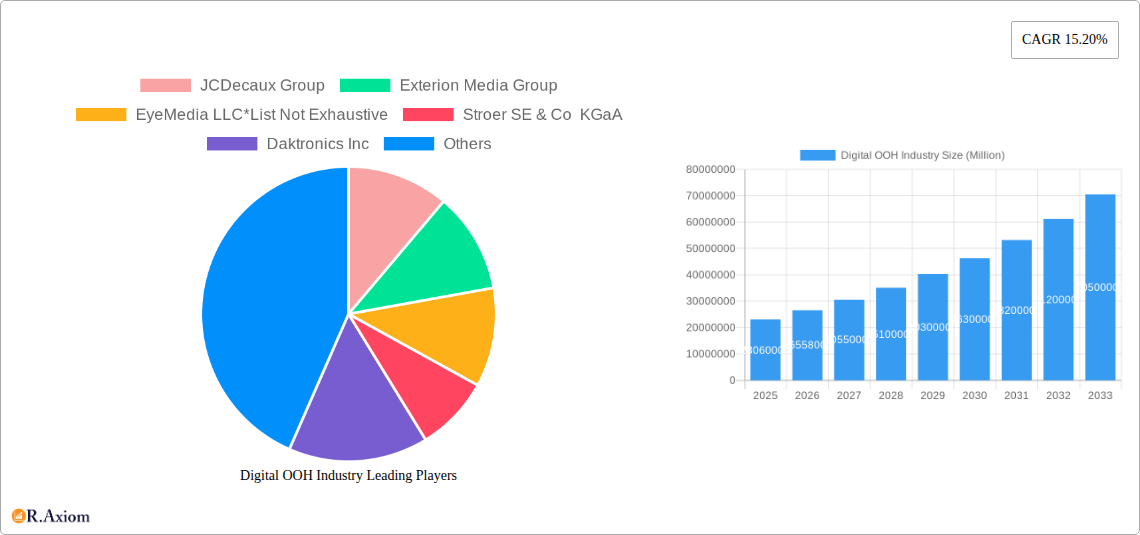
Digital OOH Industry Company Market Share
Digital OOH Industry: Market Analysis and Strategic Outlook (2019-2033)
This comprehensive report offers an in-depth analysis of the global Digital Out-of-Home (DOOH) advertising market, spanning the historical period of 2019-2024, the base and estimated year of 2025, and a robust forecast period from 2025 to 2033. We delve into the intricate dynamics, technological advancements, and evolving consumer behaviors shaping the future of DOOH advertising. With a projected market value exceeding XXX Million by 2025 and a compound annual growth rate (CAGR) of XX% during the forecast period, the DOOH industry is poised for significant expansion. This report is essential for advertisers, media planners, technology providers, investors, and industry stakeholders seeking to navigate and capitalize on this dynamic landscape.
Digital OOH Industry Market Concentration & Innovation
The Digital Out-of-Home (DOOH) industry exhibits a moderate market concentration, with a few dominant players and a growing number of innovative smaller companies. Key market participants like JCDecaux Group, Clear Channel Outdoor Holdings Inc., and OUTFRONT Media hold significant market share, driven by extensive network coverage and established relationships. However, innovation remains a critical differentiator. Technological advancements, particularly in programmatic advertising, real-time data integration, and audience measurement, are driving market expansion. The development of smart city infrastructure and the increasing adoption of IoT devices further fuel innovation in DOOH. Regulatory frameworks are evolving to accommodate the digital nature of DOOH, focusing on data privacy and ad placement standards. Product substitutes, such as digital display advertising on mobile devices and online video platforms, continue to exist, but DOOH offers unique advantages in terms of broad reach and impact. End-user trends show a growing demand for targeted campaigns and measurable results, pushing for more sophisticated DOOH solutions. Merger and acquisition (M&A) activities are prevalent as larger entities seek to acquire innovative technologies and expand their market reach. For instance, the acquisition of specific programmatic platforms or data analytics firms by established OOH giants can be valued in the tens of millions of dollars, consolidating market power and accelerating innovation.
Digital OOH Industry Industry Trends & Insights
The Digital Out-of-Home (DOOH) industry is experiencing a robust growth trajectory, fueled by a confluence of compelling trends and transformative insights. At its core, the market's expansion is driven by the inherent advantages of digital advertising in physical spaces. The ability to deliver dynamic, contextually relevant, and engaging content to captive audiences is unparalleled. Technological advancements are the primary catalyst, with the widespread adoption of programmatic DOOH platforms revolutionizing how campaigns are planned, bought, and executed. This shift enables greater efficiency, precise targeting, and enhanced measurability, moving DOOH away from traditional, static placements towards a more data-driven and agile media channel.
Consumer preferences are also evolving. Audiences are increasingly receptive to personalized advertising experiences, and DOOH, when integrated with data analytics and location-based services, can deliver these tailored messages. The rise of "smart cities" and the integration of digital screens into everyday urban infrastructure further amplify the reach and impact of DOOH advertising. Furthermore, the increasing demand for accountability and return on investment (ROI) from advertisers has pushed the industry towards developing sophisticated measurement tools. Technologies that track foot traffic, audience demographics, and campaign effectiveness are becoming standard, providing advertisers with unprecedented insights into campaign performance.
The competitive landscape is intensifying, with established OOH giants investing heavily in digital infrastructure and programmatic capabilities, while agile tech startups are introducing innovative solutions. This dynamic environment fosters continuous improvement and encourages the development of new ad formats and engagement strategies. The penetration of digital screens in high-traffic locations such as transit hubs, retail centers, and urban landmarks continues to grow, ensuring that DOOH remains a visible and impactful advertising medium. The ability to deliver real-time updates, dynamic content, and interactive experiences positions DOOH as a vital component of integrated marketing campaigns, driving significant market penetration across various sectors. The overall CAGR for the DOOH market is projected to be in the XX% range, underscoring its significant growth potential.
Dominant Markets & Segments in Digital OOH Industry
The Digital Out-of-Home (DOOH) industry's dominance is a multifaceted phenomenon, influenced by regional economic strengths, infrastructural development, and evolving consumer behaviors. Geographically, North America and Europe currently lead in DOOH market penetration, driven by advanced technological adoption and high per capita advertising spend. Asia Pacific, however, is emerging as a rapid growth region, propelled by significant investments in smart city initiatives and a burgeoning middle class.
Application: Billboard
Digital billboards, representing a substantial portion of the DOOH market, dominate urban landscapes and major transportation arteries.
- Key Drivers: High visibility, large-scale impact, and the ability to display dynamic content make digital billboards a preferred choice for brand awareness campaigns. The proliferation of digital screens along highways and in central business districts in major cities contributes to their dominance. The ability to rotate advertisements and update content instantly offers advertisers flexibility and cost-effectiveness compared to traditional billboards.
Transit
DOOH advertising within public transportation systems (buses, trains, subways, airports) is a highly effective segment.
- Key Drivers: Captive audiences with extended dwell times, demographic specificity of transit routes, and integration with travel patterns. Airport DOOH, in particular, offers access to affluent and international travelers, making it a prime segment for luxury brands and financial services. The increasing use of programmatic advertising in airports, as seen with Adani Airports, further solidifies this segment's growth.
Street Furniture
DOOH displays integrated into street furniture like bus shelters, kiosks, and digital street signs offer localized advertising opportunities.
- Key Drivers: High frequency of exposure in everyday life, localized targeting capabilities, and integration into urban planning. This segment is particularly strong in densely populated urban areas and plays a crucial role in local retail and service advertising.
Other Applications
This segment encompasses DOOH in various emerging locations, including gyms, restaurants, gas stations, and digital signage in shopping malls beyond traditional retail spaces.
- Key Drivers: Niche audience targeting, contextually relevant advertising opportunities, and increasing integration into consumer experiences. As digital technology permeates more aspects of daily life, this segment is expected to witness considerable growth.
End-User: Retail
The retail sector is a primary driver of DOOH adoption, leveraging its ability to showcase products, promotions, and enhance in-store experiences.
- Key Drivers: Driving foot traffic, promoting sales, and creating immersive brand experiences. The ability to synchronize in-store promotions with out-of-store DOOH campaigns offers a powerful omnichannel marketing approach.
Healthcare/Pharmaceuticals
This sector utilizes DOOH for public health campaigns, disease awareness, and promoting healthcare services.
- Key Drivers: Reaching broad audiences with important health information, targeted campaigns in medical facilities and high-traffic areas, and building brand trust.
Financial Services
Banks, insurance companies, and investment firms use DOOH for brand building, product promotion, and reaching affluent demographics.
- Key Drivers: Credibility building, reaching decision-makers in business districts, and promoting financial products and services to specific consumer segments.
Automotive
Automotive brands extensively use DOOH for vehicle launches, promotional offers, and brand visibility.
- Key Drivers: Showcasing new models, targeting demographics interested in vehicle purchases, and creating impactful visual advertisements in high-traffic areas.
Telecom/Utilities
These industries utilize DOOH for promoting new services, network upgrades, and customer acquisition.
- Key Drivers: Reaching a wide consumer base, communicating complex service offerings, and promoting limited-time offers.
Government Agencies
Government bodies leverage DOOH for public service announcements, safety campaigns, and civic engagement.
- Key Drivers: Broad reach for public awareness, timely dissemination of critical information, and promoting government initiatives.
Digital OOH Industry Product Developments
The Digital OOH industry is witnessing a rapid evolution in product development, driven by the demand for enhanced interactivity, data integration, and programmatic capabilities. Innovations include dynamic content optimization that adjusts advertisements based on real-time data such as weather, time of day, or audience demographics, significantly improving ad relevance and effectiveness. The integration of AI and machine learning is enabling sophisticated audience analytics and attribution models, providing advertisers with deeper insights into campaign performance. Furthermore, the development of interactive DOOH screens, utilizing touch technology and augmented reality (AR) overlays, is creating immersive brand experiences that capture consumer attention and drive engagement. These product developments are crucial for maintaining a competitive edge and meeting the evolving needs of advertisers seeking measurable and impactful campaigns.
Report Scope & Segmentation Analysis
This report comprehensively analyzes the Digital Out-of-Home (DOOH) advertising market, segmenting it by key application and end-user categories. The Application segmentation includes Billboard, Transit, Street Furniture, and Other Applications, each analyzed for its market size, growth projections, and competitive dynamics. The End-User segmentation delves into Retail, Healthcare/Pharmaceuticals, Financial Services, Automotive, Telecom/Utilities, Government Agencies, and Other End-Users, examining their specific adoption rates, advertising objectives, and market potential. Projections indicate robust growth across all segments, with particular acceleration expected in the Retail and Automotive sectors due to increasing digital integration and consumer engagement strategies.
Key Drivers of Digital OOH Industry Growth
The Digital OOH industry's growth is propelled by several key factors.
- Technological Advancements: The widespread adoption of programmatic DOOH platforms is revolutionizing campaign efficiency, targeting, and measurability. Enhanced digital screen technology, including higher resolution and interactivity, also plays a crucial role.
- Economic Factors: Increased advertising expenditure by businesses seeking to reach wider audiences and drive sales, coupled with economic recovery and growth in key markets, stimulates demand for DOOH advertising.
- Consumer Behavior Shifts: Growing consumer preference for engaging and personalized advertising experiences, coupled with increased time spent in public spaces, makes DOOH a highly effective medium.
- Urbanization and Smart City Initiatives: The expansion of urban centers and government investment in smart city infrastructure, which often includes digital displays, creates new opportunities for DOOH deployment.
Challenges in the Digital OOH Industry Sector
Despite its strong growth, the Digital OOH industry faces several challenges.
- Regulatory Hurdles: Evolving regulations concerning data privacy, ad placement, and content standards can create complexity and compliance burdens for operators and advertisers.
- Measurement Standardization: While improving, the lack of universal standards for audience measurement and campaign attribution can still pose challenges for advertisers seeking precise ROI calculations.
- Technological Obsolescence: The rapid pace of technological advancement requires continuous investment in upgrading hardware and software, leading to potential obsolescence and significant capital expenditure.
- Competition from Digital Channels: Intense competition from digital channels like social media and online video advertising necessitates a continuous demonstration of DOOH's unique value proposition.
Emerging Opportunities in Digital OOH Industry
The Digital OOH industry is ripe with emerging opportunities.
- Programmatic DOOH Expansion: Further proliferation of programmatic buying will unlock greater efficiency and targeting capabilities, attracting new advertisers.
- Data Integration and Personalization: Leveraging big data, AI, and IoT devices to deliver highly personalized and contextually relevant advertising experiences represents a significant growth area.
- Interactive and Experiential DOOH: The development of augmented reality (AR), virtual reality (VR), and other interactive technologies offers new avenues for immersive brand engagement.
- Growth in Emerging Markets: Untapped potential in developing economies, with increasing urbanization and digital infrastructure development, presents substantial growth prospects.
- Integration with Other Media: Synergistic campaigns combining DOOH with mobile, social media, and broadcast advertising can amplify reach and impact.
Leading Players in the Digital OOH Industry Market
- JCDecaux Group
- Clear Channel Outdoor Holdings Inc.
- OUTFRONT Media
- Stroer SE & Co KGaA
- Daktronics Inc.
- BroadSign International LLC
- oOh!media Limited
- QMS Media Limited
- The Times Group
- Exterion Media Group
- SevenOne Media GmbH
- Talon Outdoor Ltd
- EyeMedia LLC
Key Developments in Digital OOH Industry Industry
- June 2022: JCDecaux announced the launch of its programmatic DOOH product for the Brazilian market in collaboration with VIOOH. This initiative allows JCDecaux to offer efficient programmatic digital out-of-home campaigns on its premium screens across Brazil, using the VIOOH platform to assist brands in making meaningful connections with people and optimizing media expenditures.
- April 2022: Adani Airports announced its offering of Programmatic enabled Digital OOH Media through Lemma. This move integrates programmatic advertising across its portfolio of airports in India, aiming to upgrade infrastructure and technology. As India's largest airport infrastructure firm, Adani Airports' adoption of programmatic advertising provides brands and marketers with a powerful channel to connect with varied audience segments via its extensive network, which accounts for 25% of airport footfall.
Strategic Outlook for Digital OOH Industry Market
The strategic outlook for the Digital Out-of-Home (DOOH) industry is exceptionally bright, characterized by sustained innovation and increasing advertiser demand for measurable and engaging advertising solutions. The ongoing shift towards programmatic buying, coupled with advancements in data analytics and audience measurement, will continue to drive efficiency and ROI for advertisers. The integration of DOOH into smart city initiatives and the growing adoption of interactive technologies will create novel opportunities for immersive brand experiences. As businesses increasingly seek to connect with consumers in dynamic, real-world environments, the DOOH industry is poised to capture a significant share of advertising budgets, solidifying its position as a critical component of integrated marketing strategies and a key driver of future growth.
Digital OOH Industry Segmentation
-
1. Application
- 1.1. Billboard
- 1.2. Transit
- 1.3. Street Furniture
- 1.4. Other Applications
-
2. End-User
- 2.1. Retail
- 2.2. Healthcare/Pharmaceuticals
- 2.3. Financial Services
- 2.4. Automotive
- 2.5. Telecom/Utilities
- 2.6. Government Agencies
- 2.7. Other End-Users
Digital OOH Industry Segmentation By Geography
-
1. North America
- 1.1. United States
- 1.2. Canada
-
2. Europe
- 2.1. Germany
- 2.2. United Kingdom
- 2.3. Spain
- 2.4. France
- 2.5. Rest of Europe
-
3. Asia Pacific
- 3.1. China
- 3.2. India
- 3.3. Japan
- 3.4. Singapore
- 3.5. South Korea
- 3.6. Rest of Asia Pacific
-
4. Latin America
- 4.1. Brazil
- 4.2. Mexico
- 4.3. Chile
- 4.4. Rest of Latin America
-
5. Middle East and Africa
- 5.1. GCC
- 5.2. South Africa
- 5.3. Rest of Middle East and Africa
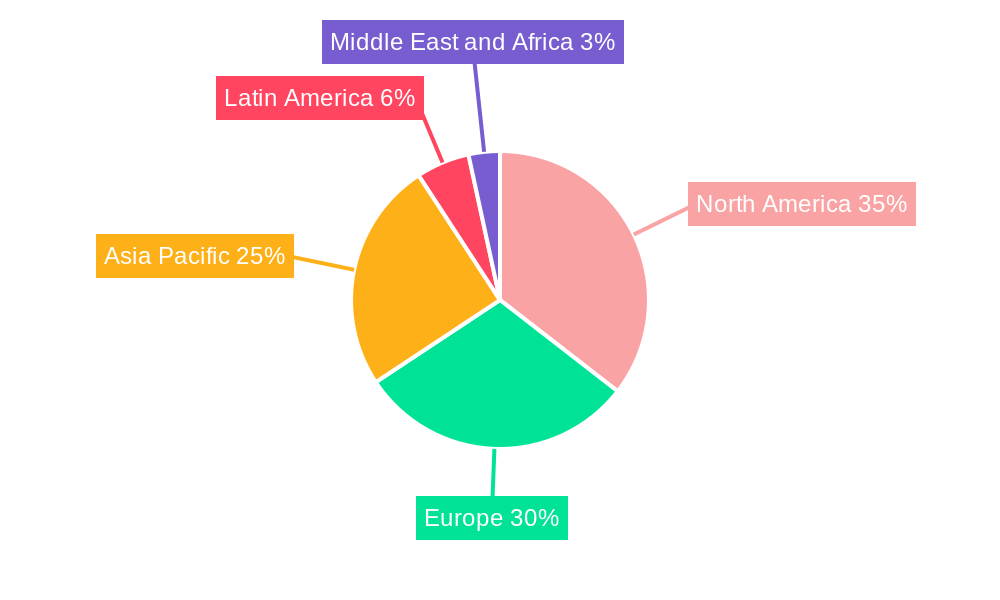
Digital OOH Industry Regional Market Share
Geographic Coverage of Digital OOH Industry
Digital OOH Industry REPORT HIGHLIGHTS
| Aspects | Details |
|---|---|
| Study Period | 2020-2034 |
| Base Year | 2025 |
| Estimated Year | 2026 |
| Forecast Period | 2026-2034 |
| Historical Period | 2020-2025 |
| Growth Rate | CAGR of 15.20% from 2020-2034 |
| Segmentation |
|
Table of Contents
- 1. Introduction
- 1.1. Research Scope
- 1.2. Market Segmentation
- 1.3. Research Objective
- 1.4. Definitions and Assumptions
- 2. Executive Summary
- 2.1. Market Snapshot
- 3. Market Dynamics
- 3.1. Market Drivers
- 3.2. Market Restrains
- 3.3. Market Trends
- 3.4. Market Opportunities
- 4. Market Factor Analysis
- 4.1. Porters Five Forces
- 4.1.1. Bargaining Power of Suppliers
- 4.1.2. Bargaining Power of Buyers
- 4.1.3. Threat of New Entrants
- 4.1.4. Threat of Substitutes
- 4.1.5. Competitive Rivalry
- 4.2. PESTEL analysis
- 4.3. BCG Analysis
- 4.3.1. Stars (High Growth, High Market Share)
- 4.3.2. Cash Cows (Low Growth, High Market Share)
- 4.3.3. Question Mark (High Growth, Low Market Share)
- 4.3.4. Dogs (Low Growth, Low Market Share)
- 4.4. Ansoff Matrix Analysis
- 4.5. Supply Chain Analysis
- 4.6. Regulatory Landscape
- 4.7. Current Market Potential and Opportunity Assessment (TAM–SAM–SOM Framework)
- 4.8. RAX Analyst Note
- 4.1. Porters Five Forces
- 5. Market Analysis, Insights and Forecast 2021-2033
- 5.1. Market Analysis, Insights and Forecast - by Application
- 5.1.1. Billboard
- 5.1.2. Transit
- 5.1.3. Street Furniture
- 5.1.4. Other Applications
- 5.2. Market Analysis, Insights and Forecast - by End-User
- 5.2.1. Retail
- 5.2.2. Healthcare/Pharmaceuticals
- 5.2.3. Financial Services
- 5.2.4. Automotive
- 5.2.5. Telecom/Utilities
- 5.2.6. Government Agencies
- 5.2.7. Other End-Users
- 5.3. Market Analysis, Insights and Forecast - by Region
- 5.3.1. North America
- 5.3.2. Europe
- 5.3.3. Asia Pacific
- 5.3.4. Latin America
- 5.3.5. Middle East and Africa
- 5.1. Market Analysis, Insights and Forecast - by Application
- 6. Global Digital OOH Industry Analysis, Insights and Forecast, 2021-2033
- 6.1. Market Analysis, Insights and Forecast - by Application
- 6.1.1. Billboard
- 6.1.2. Transit
- 6.1.3. Street Furniture
- 6.1.4. Other Applications
- 6.2. Market Analysis, Insights and Forecast - by End-User
- 6.2.1. Retail
- 6.2.2. Healthcare/Pharmaceuticals
- 6.2.3. Financial Services
- 6.2.4. Automotive
- 6.2.5. Telecom/Utilities
- 6.2.6. Government Agencies
- 6.2.7. Other End-Users
- 6.1. Market Analysis, Insights and Forecast - by Application
- 7. North America Digital OOH Industry Analysis, Insights and Forecast, 2020-2032
- 7.1. Market Analysis, Insights and Forecast - by Application
- 7.1.1. Billboard
- 7.1.2. Transit
- 7.1.3. Street Furniture
- 7.1.4. Other Applications
- 7.2. Market Analysis, Insights and Forecast - by End-User
- 7.2.1. Retail
- 7.2.2. Healthcare/Pharmaceuticals
- 7.2.3. Financial Services
- 7.2.4. Automotive
- 7.2.5. Telecom/Utilities
- 7.2.6. Government Agencies
- 7.2.7. Other End-Users
- 7.1. Market Analysis, Insights and Forecast - by Application
- 8. Europe Digital OOH Industry Analysis, Insights and Forecast, 2020-2032
- 8.1. Market Analysis, Insights and Forecast - by Application
- 8.1.1. Billboard
- 8.1.2. Transit
- 8.1.3. Street Furniture
- 8.1.4. Other Applications
- 8.2. Market Analysis, Insights and Forecast - by End-User
- 8.2.1. Retail
- 8.2.2. Healthcare/Pharmaceuticals
- 8.2.3. Financial Services
- 8.2.4. Automotive
- 8.2.5. Telecom/Utilities
- 8.2.6. Government Agencies
- 8.2.7. Other End-Users
- 8.1. Market Analysis, Insights and Forecast - by Application
- 9. Asia Pacific Digital OOH Industry Analysis, Insights and Forecast, 2020-2032
- 9.1. Market Analysis, Insights and Forecast - by Application
- 9.1.1. Billboard
- 9.1.2. Transit
- 9.1.3. Street Furniture
- 9.1.4. Other Applications
- 9.2. Market Analysis, Insights and Forecast - by End-User
- 9.2.1. Retail
- 9.2.2. Healthcare/Pharmaceuticals
- 9.2.3. Financial Services
- 9.2.4. Automotive
- 9.2.5. Telecom/Utilities
- 9.2.6. Government Agencies
- 9.2.7. Other End-Users
- 9.1. Market Analysis, Insights and Forecast - by Application
- 10. Latin America Digital OOH Industry Analysis, Insights and Forecast, 2020-2032
- 10.1. Market Analysis, Insights and Forecast - by Application
- 10.1.1. Billboard
- 10.1.2. Transit
- 10.1.3. Street Furniture
- 10.1.4. Other Applications
- 10.2. Market Analysis, Insights and Forecast - by End-User
- 10.2.1. Retail
- 10.2.2. Healthcare/Pharmaceuticals
- 10.2.3. Financial Services
- 10.2.4. Automotive
- 10.2.5. Telecom/Utilities
- 10.2.6. Government Agencies
- 10.2.7. Other End-Users
- 10.1. Market Analysis, Insights and Forecast - by Application
- 11. Middle East and Africa Digital OOH Industry Analysis, Insights and Forecast, 2020-2032
- 11.1. Market Analysis, Insights and Forecast - by Application
- 11.1.1. Billboard
- 11.1.2. Transit
- 11.1.3. Street Furniture
- 11.1.4. Other Applications
- 11.2. Market Analysis, Insights and Forecast - by End-User
- 11.2.1. Retail
- 11.2.2. Healthcare/Pharmaceuticals
- 11.2.3. Financial Services
- 11.2.4. Automotive
- 11.2.5. Telecom/Utilities
- 11.2.6. Government Agencies
- 11.2.7. Other End-Users
- 11.1. Market Analysis, Insights and Forecast - by Application
- 12. Competitive Analysis
- 12.1. Company Profiles
- 12.1.1 JCDecaux Group
- 12.1.1.1. Company Overview
- 12.1.1.2. Products
- 12.1.1.3. Company Financials
- 12.1.1.4. SWOT Analysis
- 12.1.2 Exterion Media Group
- 12.1.2.1. Company Overview
- 12.1.2.2. Products
- 12.1.2.3. Company Financials
- 12.1.2.4. SWOT Analysis
- 12.1.3 EyeMedia LLC*List Not Exhaustive
- 12.1.3.1. Company Overview
- 12.1.3.2. Products
- 12.1.3.3. Company Financials
- 12.1.3.4. SWOT Analysis
- 12.1.4 Stroer SE & Co KGaA
- 12.1.4.1. Company Overview
- 12.1.4.2. Products
- 12.1.4.3. Company Financials
- 12.1.4.4. SWOT Analysis
- 12.1.5 Daktronics Inc
- 12.1.5.1. Company Overview
- 12.1.5.2. Products
- 12.1.5.3. Company Financials
- 12.1.5.4. SWOT Analysis
- 12.1.6 The Times Group
- 12.1.6.1. Company Overview
- 12.1.6.2. Products
- 12.1.6.3. Company Financials
- 12.1.6.4. SWOT Analysis
- 12.1.7 BroadSign International LLC
- 12.1.7.1. Company Overview
- 12.1.7.2. Products
- 12.1.7.3. Company Financials
- 12.1.7.4. SWOT Analysis
- 12.1.8 OUTFRONT Media
- 12.1.8.1. Company Overview
- 12.1.8.2. Products
- 12.1.8.3. Company Financials
- 12.1.8.4. SWOT Analysis
- 12.1.9 oOh!media Limited
- 12.1.9.1. Company Overview
- 12.1.9.2. Products
- 12.1.9.3. Company Financials
- 12.1.9.4. SWOT Analysis
- 12.1.10 SevenOne Media GmbH
- 12.1.10.1. Company Overview
- 12.1.10.2. Products
- 12.1.10.3. Company Financials
- 12.1.10.4. SWOT Analysis
- 12.1.11 Talon Outdoor Ltd
- 12.1.11.1. Company Overview
- 12.1.11.2. Products
- 12.1.11.3. Company Financials
- 12.1.11.4. SWOT Analysis
- 12.1.12 QMS Media Limited
- 12.1.12.1. Company Overview
- 12.1.12.2. Products
- 12.1.12.3. Company Financials
- 12.1.12.4. SWOT Analysis
- 12.1.13 Clear Channel Outdoor Holdings Inc
- 12.1.13.1. Company Overview
- 12.1.13.2. Products
- 12.1.13.3. Company Financials
- 12.1.13.4. SWOT Analysis
- 12.1.1 JCDecaux Group
- 12.2. Market Entropy
- 12.2.1 Company's Key Areas Served
- 12.2.2 Recent Developments
- 12.3. Company Market Share Analysis 2025
- 12.3.1 Top 5 Companies Market Share Analysis
- 12.3.2 Top 3 Companies Market Share Analysis
- 12.4. List of Potential Customers
- 13. Research Methodology
List of Figures
- Figure 1: Global Digital OOH Industry Revenue Breakdown (Million, %) by Region 2025 & 2033
- Figure 2: North America Digital OOH Industry Revenue (Million), by Application 2025 & 2033
- Figure 3: North America Digital OOH Industry Revenue Share (%), by Application 2025 & 2033
- Figure 4: North America Digital OOH Industry Revenue (Million), by End-User 2025 & 2033
- Figure 5: North America Digital OOH Industry Revenue Share (%), by End-User 2025 & 2033
- Figure 6: North America Digital OOH Industry Revenue (Million), by Country 2025 & 2033
- Figure 7: North America Digital OOH Industry Revenue Share (%), by Country 2025 & 2033
- Figure 8: Europe Digital OOH Industry Revenue (Million), by Application 2025 & 2033
- Figure 9: Europe Digital OOH Industry Revenue Share (%), by Application 2025 & 2033
- Figure 10: Europe Digital OOH Industry Revenue (Million), by End-User 2025 & 2033
- Figure 11: Europe Digital OOH Industry Revenue Share (%), by End-User 2025 & 2033
- Figure 12: Europe Digital OOH Industry Revenue (Million), by Country 2025 & 2033
- Figure 13: Europe Digital OOH Industry Revenue Share (%), by Country 2025 & 2033
- Figure 14: Asia Pacific Digital OOH Industry Revenue (Million), by Application 2025 & 2033
- Figure 15: Asia Pacific Digital OOH Industry Revenue Share (%), by Application 2025 & 2033
- Figure 16: Asia Pacific Digital OOH Industry Revenue (Million), by End-User 2025 & 2033
- Figure 17: Asia Pacific Digital OOH Industry Revenue Share (%), by End-User 2025 & 2033
- Figure 18: Asia Pacific Digital OOH Industry Revenue (Million), by Country 2025 & 2033
- Figure 19: Asia Pacific Digital OOH Industry Revenue Share (%), by Country 2025 & 2033
- Figure 20: Latin America Digital OOH Industry Revenue (Million), by Application 2025 & 2033
- Figure 21: Latin America Digital OOH Industry Revenue Share (%), by Application 2025 & 2033
- Figure 22: Latin America Digital OOH Industry Revenue (Million), by End-User 2025 & 2033
- Figure 23: Latin America Digital OOH Industry Revenue Share (%), by End-User 2025 & 2033
- Figure 24: Latin America Digital OOH Industry Revenue (Million), by Country 2025 & 2033
- Figure 25: Latin America Digital OOH Industry Revenue Share (%), by Country 2025 & 2033
- Figure 26: Middle East and Africa Digital OOH Industry Revenue (Million), by Application 2025 & 2033
- Figure 27: Middle East and Africa Digital OOH Industry Revenue Share (%), by Application 2025 & 2033
- Figure 28: Middle East and Africa Digital OOH Industry Revenue (Million), by End-User 2025 & 2033
- Figure 29: Middle East and Africa Digital OOH Industry Revenue Share (%), by End-User 2025 & 2033
- Figure 30: Middle East and Africa Digital OOH Industry Revenue (Million), by Country 2025 & 2033
- Figure 31: Middle East and Africa Digital OOH Industry Revenue Share (%), by Country 2025 & 2033
List of Tables
- Table 1: Global Digital OOH Industry Revenue Million Forecast, by Application 2020 & 2033
- Table 2: Global Digital OOH Industry Revenue Million Forecast, by End-User 2020 & 2033
- Table 3: Global Digital OOH Industry Revenue Million Forecast, by Region 2020 & 2033
- Table 4: Global Digital OOH Industry Revenue Million Forecast, by Application 2020 & 2033
- Table 5: Global Digital OOH Industry Revenue Million Forecast, by End-User 2020 & 2033
- Table 6: Global Digital OOH Industry Revenue Million Forecast, by Country 2020 & 2033
- Table 7: United States Digital OOH Industry Revenue (Million) Forecast, by Application 2020 & 2033
- Table 8: Canada Digital OOH Industry Revenue (Million) Forecast, by Application 2020 & 2033
- Table 9: Global Digital OOH Industry Revenue Million Forecast, by Application 2020 & 2033
- Table 10: Global Digital OOH Industry Revenue Million Forecast, by End-User 2020 & 2033
- Table 11: Global Digital OOH Industry Revenue Million Forecast, by Country 2020 & 2033
- Table 12: Germany Digital OOH Industry Revenue (Million) Forecast, by Application 2020 & 2033
- Table 13: United Kingdom Digital OOH Industry Revenue (Million) Forecast, by Application 2020 & 2033
- Table 14: Spain Digital OOH Industry Revenue (Million) Forecast, by Application 2020 & 2033
- Table 15: France Digital OOH Industry Revenue (Million) Forecast, by Application 2020 & 2033
- Table 16: Rest of Europe Digital OOH Industry Revenue (Million) Forecast, by Application 2020 & 2033
- Table 17: Global Digital OOH Industry Revenue Million Forecast, by Application 2020 & 2033
- Table 18: Global Digital OOH Industry Revenue Million Forecast, by End-User 2020 & 2033
- Table 19: Global Digital OOH Industry Revenue Million Forecast, by Country 2020 & 2033
- Table 20: China Digital OOH Industry Revenue (Million) Forecast, by Application 2020 & 2033
- Table 21: India Digital OOH Industry Revenue (Million) Forecast, by Application 2020 & 2033
- Table 22: Japan Digital OOH Industry Revenue (Million) Forecast, by Application 2020 & 2033
- Table 23: Singapore Digital OOH Industry Revenue (Million) Forecast, by Application 2020 & 2033
- Table 24: South Korea Digital OOH Industry Revenue (Million) Forecast, by Application 2020 & 2033
- Table 25: Rest of Asia Pacific Digital OOH Industry Revenue (Million) Forecast, by Application 2020 & 2033
- Table 26: Global Digital OOH Industry Revenue Million Forecast, by Application 2020 & 2033
- Table 27: Global Digital OOH Industry Revenue Million Forecast, by End-User 2020 & 2033
- Table 28: Global Digital OOH Industry Revenue Million Forecast, by Country 2020 & 2033
- Table 29: Brazil Digital OOH Industry Revenue (Million) Forecast, by Application 2020 & 2033
- Table 30: Mexico Digital OOH Industry Revenue (Million) Forecast, by Application 2020 & 2033
- Table 31: Chile Digital OOH Industry Revenue (Million) Forecast, by Application 2020 & 2033
- Table 32: Rest of Latin America Digital OOH Industry Revenue (Million) Forecast, by Application 2020 & 2033
- Table 33: Global Digital OOH Industry Revenue Million Forecast, by Application 2020 & 2033
- Table 34: Global Digital OOH Industry Revenue Million Forecast, by End-User 2020 & 2033
- Table 35: Global Digital OOH Industry Revenue Million Forecast, by Country 2020 & 2033
- Table 36: GCC Digital OOH Industry Revenue (Million) Forecast, by Application 2020 & 2033
- Table 37: South Africa Digital OOH Industry Revenue (Million) Forecast, by Application 2020 & 2033
- Table 38: Rest of Middle East and Africa Digital OOH Industry Revenue (Million) Forecast, by Application 2020 & 2033
Frequently Asked Questions
1. What is the projected Compound Annual Growth Rate (CAGR) of the Digital OOH Industry?
The projected CAGR is approximately 15.20%.
2. Which companies are prominent players in the Digital OOH Industry?
Key companies in the market include JCDecaux Group, Exterion Media Group, EyeMedia LLC*List Not Exhaustive, Stroer SE & Co KGaA, Daktronics Inc, The Times Group, BroadSign International LLC, OUTFRONT Media, oOh!media Limited, SevenOne Media GmbH, Talon Outdoor Ltd, QMS Media Limited, Clear Channel Outdoor Holdings Inc.
3. What are the main segments of the Digital OOH Industry?
The market segments include Application, End-User.
4. Can you provide details about the market size?
The market size is estimated to be USD 23.06 Million as of 2022.
5. What are some drivers contributing to market growth?
Increase in Public Transit Infrastructure; Increasing Adoption of Digital Screens; High Advertising Flexibility with Connected Screens.
6. What are the notable trends driving market growth?
Transit Accounts for a Significant Share of Digital OOH Market.
7. Are there any restraints impacting market growth?
High Installation and Maintenance Costs.
8. Can you provide examples of recent developments in the market?
June 2022 - JCDecaux has announced the launch of its programmatic DOOH product for the Brazilian market in collaboration with VIOOH. JCDecaux will be able to offer its customers efficient programmatic digital out-of-home campaigns on its premium screens across Brazil using the VIOOH platform, assisting brands in making meaningful connections with people and ensuring they get the most out of their media expenditures.
9. What pricing options are available for accessing the report?
Pricing options include single-user, multi-user, and enterprise licenses priced at USD 4750, USD 5250, and USD 8750 respectively.
10. Is the market size provided in terms of value or volume?
The market size is provided in terms of value, measured in Million.
11. Are there any specific market keywords associated with the report?
Yes, the market keyword associated with the report is "Digital OOH Industry," which aids in identifying and referencing the specific market segment covered.
12. How do I determine which pricing option suits my needs best?
The pricing options vary based on user requirements and access needs. Individual users may opt for single-user licenses, while businesses requiring broader access may choose multi-user or enterprise licenses for cost-effective access to the report.
13. Are there any additional resources or data provided in the Digital OOH Industry report?
While the report offers comprehensive insights, it's advisable to review the specific contents or supplementary materials provided to ascertain if additional resources or data are available.
14. How can I stay updated on further developments or reports in the Digital OOH Industry?
To stay informed about further developments, trends, and reports in the Digital OOH Industry, consider subscribing to industry newsletters, following relevant companies and organizations, or regularly checking reputable industry news sources and publications.
Methodology
Step 1 - Identification of Relevant Samples Size from Population Database


Step 2 - Approaches for Defining Global Market Size (Value, Volume* & Price*)

Note*: In applicable scenarios
Step 3 - Data Sources
Primary Research
- Web Analytics
- Survey Reports
- Research Institute
- Latest Research Reports
- Opinion Leaders
Secondary Research
- Annual Reports
- White Paper
- Latest Press Release
- Industry Association
- Paid Database
- Investor Presentations

Step 4 - Data Triangulation
Involves using different sources of information in order to increase the validity of a study
These sources are likely to be stakeholders in a program - participants, other researchers, program staff, other community members, and so on.
Then we put all data in single framework & apply various statistical tools to find out the dynamic on the market.
During the analysis stage, feedback from the stakeholder groups would be compared to determine areas of agreement as well as areas of divergence

