Key Insights
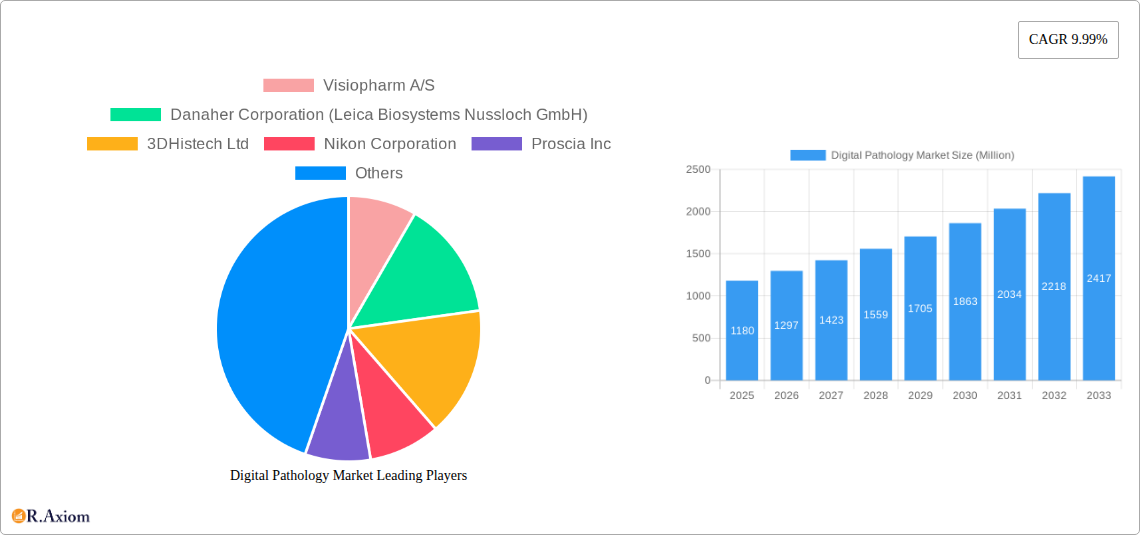
The digital pathology market is experiencing robust growth, projected to reach a substantial size driven by several key factors. The market's Compound Annual Growth Rate (CAGR) of 9.99% from 2019 to 2024 indicates a significant upward trajectory. This expansion is fueled by the increasing adoption of digital pathology solutions across various end-user segments, including pharmaceutical and biotechnology companies, Contract Research Organizations (CROs), hospitals, and reference laboratories. The rising prevalence of chronic diseases globally necessitates advanced diagnostic tools, further bolstering market demand. Technological advancements, such as improved image acquisition and analysis software, along with increasing accessibility to high-speed internet and cloud computing, are streamlining workflows and improving diagnostic accuracy. Furthermore, the growing emphasis on telepathology and remote diagnostics is expanding market reach and creating new opportunities. The shift towards personalized medicine and the associated need for detailed image analysis are also contributing to the market's growth.
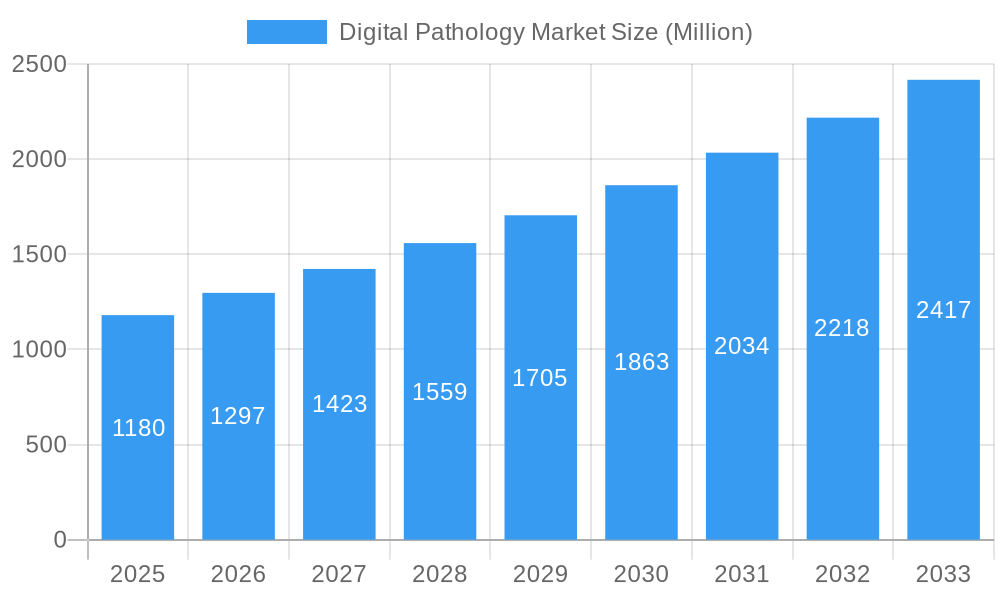
Digital Pathology Market Market Size (In Billion)
While the market enjoys a positive outlook, certain restraints remain. High initial investment costs associated with acquiring and implementing digital pathology systems can be a barrier to entry for smaller healthcare providers. Furthermore, the integration of digital pathology systems into existing workflows can pose a significant challenge, requiring substantial training and adaptation. Data security and regulatory compliance are also crucial considerations that impact market growth. However, the long-term benefits of enhanced diagnostic accuracy, improved efficiency, and reduced operational costs are likely to outweigh these challenges, propelling the market's continued expansion throughout the forecast period (2025-2033). Segmentation analysis reveals a strong demand across all application areas, namely disease diagnosis, drug discovery, and education and training, highlighting the versatility and broad applicability of digital pathology technologies.
Digital Pathology Market Company Market Share
Digital Pathology Market: A Comprehensive Report (2019-2033)
This in-depth report provides a comprehensive analysis of the Digital Pathology Market, offering actionable insights for stakeholders across the industry. The study period spans 2019-2033, with 2025 serving as the base and estimated year. The forecast period covers 2025-2033, and the historical period encompasses 2019-2024. The report leverages extensive market research to provide detailed segmentation analysis, growth projections, and competitive landscapes, focusing on key players like Visiopharm A/S, Danaher Corporation (Leica Biosystems Nussloch GmbH), 3DHistech Ltd, Nikon Corporation, Proscia Inc, F Hoffmann-La Roche Ltd (Ventana Medical Systems Inc), XIFIN Inc, Leica Biosystems, Koninklijke Philips NV, Hamamatsu Photonics K K, Mikroscan Technologies Inc, Olympus Corporation, and Sectra AG.
Digital Pathology Market Concentration & Innovation
The digital pathology market exhibits a moderately consolidated structure, with a few major players holding significant market share. However, the market is witnessing considerable innovation driven by advancements in AI, machine learning, and high-resolution imaging technologies. The regulatory landscape, while evolving, is largely supportive of digital pathology adoption, particularly in regions with robust healthcare infrastructure. Product substitutes, primarily traditional microscopy methods, are gradually losing ground due to the advantages offered by digital pathology in terms of efficiency, collaboration, and data analysis. End-user trends indicate a strong preference for cloud-based solutions and remote diagnostics capabilities. The market has witnessed several M&A activities in recent years, further shaping the competitive landscape. Deal values have ranged from xx Million to xx Million, primarily driven by the consolidation of software and hardware providers. Some key metrics include:
- Market Share: Top 5 players hold approximately xx% of the market share.
- M&A Activity: An average of xx M&A deals per year were observed during the historical period.
Digital Pathology Market Industry Trends & Insights
The global digital pathology market is experiencing robust growth, driven by several factors. Technological advancements, such as the development of high-throughput scanners and sophisticated image analysis software, are significantly enhancing the efficiency and accuracy of disease diagnosis. The increasing adoption of telepathology is enabling remote consultations and improving access to specialized expertise. A rising prevalence of chronic diseases, particularly cancer, is fueling the demand for faster and more accurate diagnostic tools. Furthermore, the growing emphasis on personalized medicine is driving the demand for digital pathology solutions that facilitate the analysis of large datasets. The market is expected to witness a CAGR of xx% during the forecast period, with a significant market penetration expected in developing countries. Consumer preferences are shifting towards solutions that offer seamless integration with existing laboratory information systems (LIS) and electronic health record (EHR) systems. Competitive dynamics are marked by continuous innovation, strategic partnerships, and product differentiation.
Dominant Markets & Segments in Digital Pathology Market
The North American region currently dominates the digital pathology market, driven by factors such as high healthcare expenditure, advanced technological infrastructure, and strong regulatory support. However, the Asia-Pacific region is expected to exhibit the fastest growth rate during the forecast period.
Dominant Segments:
- End User: Hospitals and Reference Laboratories represent the largest segment, driven by increasing demand for efficient diagnostic workflows.
- Product: The software segment is expected to experience the fastest growth, fueled by advancements in AI-powered image analysis and cloud-based solutions.
- Application: Disease diagnosis is the primary application area, accounting for a significant portion of the market revenue.
Key Drivers for Dominance:
- North America: High adoption rates, well-established healthcare infrastructure, and significant funding for research and development.
- Asia-Pacific: Rapidly growing healthcare sector, increasing prevalence of chronic diseases, and government initiatives promoting the adoption of advanced medical technologies.
Digital Pathology Market Product Developments
Recent product developments have focused on integrating artificial intelligence and machine learning algorithms into digital pathology platforms. This is enhancing the accuracy and efficiency of disease diagnosis and facilitating the discovery of new biomarkers. New scanners offer higher throughput and improved image quality. Cloud-based platforms are enhancing collaboration and data sharing among pathologists. The overall trend is towards user-friendly interfaces and seamless integration with existing laboratory workflows.
Report Scope & Segmentation Analysis
This report comprehensively analyzes the digital pathology market across various segments:
- End User: Pharmaceutical, Biotechnology, Companies and CROs, Hospital and Reference Laboratories, Other End Users. Each segment exhibits different growth projections driven by specific needs and priorities.
- Product: Scanner, Software, Storage Systems, Other Products. Software and AI-driven analytical tools show particularly strong growth.
- Application: Disease Diagnosis, Drug Discovery, Education and Training. Disease diagnosis maintains its dominant position, while drug discovery is showing growing adoption of digital tools.
Each segment's market size, growth projections, and competitive dynamics are detailed within the full report.
Key Drivers of Digital Pathology Market Growth
Several factors drive the growth of the digital pathology market. Technological advancements, such as AI-powered image analysis and high-throughput scanners, enhance diagnostic accuracy and efficiency. Increasing prevalence of chronic diseases, especially cancer, fuels demand for improved diagnostic tools. Furthermore, government initiatives promoting the adoption of digital healthcare solutions and the growing emphasis on personalized medicine contribute significantly. Cost savings from streamlined workflows and improved diagnostic accuracy also incentivize adoption.
Challenges in the Digital Pathology Market Sector
Despite its growth potential, the digital pathology market faces challenges. High initial investment costs for hardware and software can hinder adoption, especially in resource-constrained settings. Data security and privacy concerns associated with handling sensitive patient information need to be addressed effectively. Regulatory hurdles related to data compliance and software validation can also impede market expansion. The integration of digital pathology systems with existing laboratory information systems (LIS) can present technical challenges. Finally, competition amongst established players and new entrants continues to intensify.
Emerging Opportunities in Digital Pathology Market
The digital pathology market presents several emerging opportunities. The increasing adoption of cloud-based solutions is expanding accessibility and enabling remote diagnostics. The integration of AI and machine learning for improved diagnostic accuracy and the development of new applications in drug discovery and personalized medicine are expanding the market's scope. Furthermore, the growing need for cost-effective and efficient diagnostic solutions in developing countries presents a significant market opportunity. Expansion into new therapeutic areas beyond oncology is also expected.
Leading Players in the Digital Pathology Market Market
Key Developments in Digital Pathology Market Industry
- June 2022: SpIntellx, Inc. and Inspirata collaborated to integrate SpIntellx HistoMapr-Breast and Inspirata's Dynamyx software, enhancing breast cancer diagnosis.
- June 2022: Roche launched the next-generation Ventana DP 600 slide scanner, receiving CE-IVD marking, improving scanning capabilities.
Strategic Outlook for Digital Pathology Market Market
The digital pathology market is poised for significant growth, driven by ongoing technological advancements, increasing healthcare spending, and the rising prevalence of chronic diseases. Strategic partnerships, acquisitions, and the development of innovative solutions will further shape the market landscape. Focus on AI-powered diagnostics, cloud-based platforms, and seamless integration with existing healthcare systems will be crucial for success. The market holds immense potential for expansion in emerging economies and new therapeutic areas, offering significant opportunities for both established players and new entrants.
Digital Pathology Market Segmentation
-
1. Product
- 1.1. Scanner
- 1.2. Software
- 1.3. Storage Systems
- 1.4. Other Products
-
2. Application
- 2.1. Disease Diagnosis
- 2.2. Drug Discovery
- 2.3. Education and Training
-
3. End User
- 3.1. Pharmaceutical, Biotechnology, Companies and CROs
- 3.2. Hospital and Reference Laboratories
- 3.3. Other End Users
Digital Pathology Market Segmentation By Geography
-
1. North America
- 1.1. United States
- 1.2. Canada
- 1.3. Mexico
-
2. Europe
- 2.1. Germany
- 2.2. United Kingdom
- 2.3. France
- 2.4. Italy
- 2.5. Spain
- 2.6. Rest of Europe
-
3. Asia Pacific
- 3.1. China
- 3.2. Japan
- 3.3. India
- 3.4. Australia
- 3.5. South Korea
- 3.6. Rest of Asia Pacific
-
4. Middle East and Africa
- 4.1. GCC
- 4.2. South Africa
- 4.3. Rest of Middle East and Africa
-
5. South America
- 5.1. Brazil
- 5.2. Argentina
- 5.3. Rest of South America
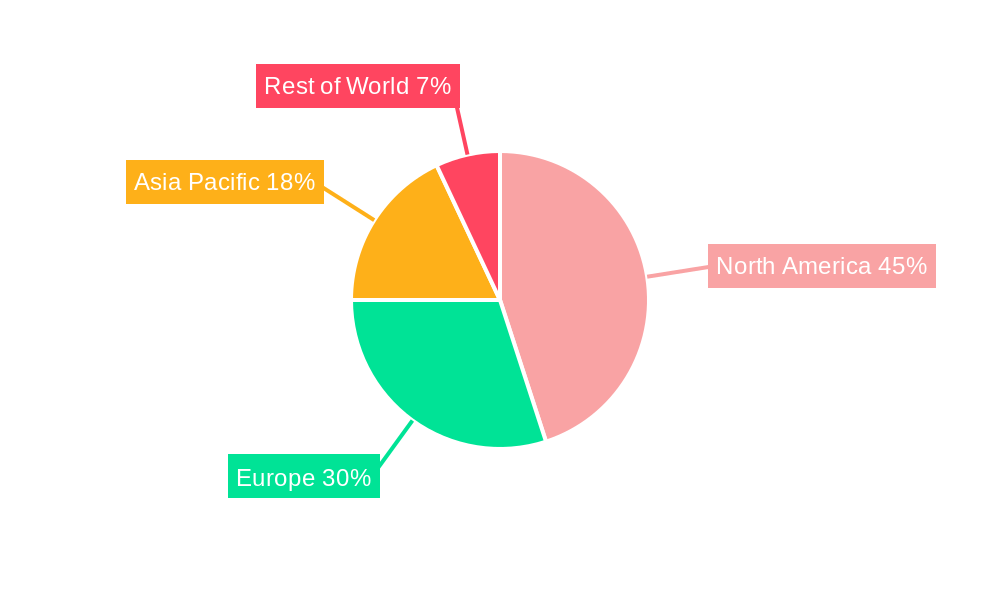
Digital Pathology Market Regional Market Share
Geographic Coverage of Digital Pathology Market
Digital Pathology Market REPORT HIGHLIGHTS
| Aspects | Details |
|---|---|
| Study Period | 2020-2034 |
| Base Year | 2025 |
| Estimated Year | 2026 |
| Forecast Period | 2026-2034 |
| Historical Period | 2020-2025 |
| Growth Rate | CAGR of 9.99% from 2020-2034 |
| Segmentation |
|
Table of Contents
- 1. Introduction
- 1.1. Research Scope
- 1.2. Market Segmentation
- 1.3. Research Objective
- 1.4. Definitions and Assumptions
- 2. Executive Summary
- 2.1. Market Snapshot
- 3. Market Dynamics
- 3.1. Market Drivers
- 3.2. Market Restrains
- 3.3. Market Trends
- 3.4. Market Opportunities
- 4. Market Factor Analysis
- 4.1. Porters Five Forces
- 4.1.1. Bargaining Power of Suppliers
- 4.1.2. Bargaining Power of Buyers
- 4.1.3. Threat of New Entrants
- 4.1.4. Threat of Substitutes
- 4.1.5. Competitive Rivalry
- 4.2. PESTEL analysis
- 4.3. BCG Analysis
- 4.3.1. Stars (High Growth, High Market Share)
- 4.3.2. Cash Cows (Low Growth, High Market Share)
- 4.3.3. Question Mark (High Growth, Low Market Share)
- 4.3.4. Dogs (Low Growth, Low Market Share)
- 4.4. Ansoff Matrix Analysis
- 4.5. Supply Chain Analysis
- 4.6. Regulatory Landscape
- 4.7. Current Market Potential and Opportunity Assessment (TAM–SAM–SOM Framework)
- 4.8. RAX Analyst Note
- 4.1. Porters Five Forces
- 5. Market Analysis, Insights and Forecast 2021-2033
- 5.1. Market Analysis, Insights and Forecast - by Product
- 5.1.1. Scanner
- 5.1.2. Software
- 5.1.3. Storage Systems
- 5.1.4. Other Products
- 5.2. Market Analysis, Insights and Forecast - by Application
- 5.2.1. Disease Diagnosis
- 5.2.2. Drug Discovery
- 5.2.3. Education and Training
- 5.3. Market Analysis, Insights and Forecast - by End User
- 5.3.1. Pharmaceutical, Biotechnology, Companies and CROs
- 5.3.2. Hospital and Reference Laboratories
- 5.3.3. Other End Users
- 5.4. Market Analysis, Insights and Forecast - by Region
- 5.4.1. North America
- 5.4.2. Europe
- 5.4.3. Asia Pacific
- 5.4.4. Middle East and Africa
- 5.4.5. South America
- 5.1. Market Analysis, Insights and Forecast - by Product
- 6. Global Digital Pathology Market Analysis, Insights and Forecast, 2021-2033
- 6.1. Market Analysis, Insights and Forecast - by Product
- 6.1.1. Scanner
- 6.1.2. Software
- 6.1.3. Storage Systems
- 6.1.4. Other Products
- 6.2. Market Analysis, Insights and Forecast - by Application
- 6.2.1. Disease Diagnosis
- 6.2.2. Drug Discovery
- 6.2.3. Education and Training
- 6.3. Market Analysis, Insights and Forecast - by End User
- 6.3.1. Pharmaceutical, Biotechnology, Companies and CROs
- 6.3.2. Hospital and Reference Laboratories
- 6.3.3. Other End Users
- 6.1. Market Analysis, Insights and Forecast - by Product
- 7. North America Digital Pathology Market Analysis, Insights and Forecast, 2020-2032
- 7.1. Market Analysis, Insights and Forecast - by Product
- 7.1.1. Scanner
- 7.1.2. Software
- 7.1.3. Storage Systems
- 7.1.4. Other Products
- 7.2. Market Analysis, Insights and Forecast - by Application
- 7.2.1. Disease Diagnosis
- 7.2.2. Drug Discovery
- 7.2.3. Education and Training
- 7.3. Market Analysis, Insights and Forecast - by End User
- 7.3.1. Pharmaceutical, Biotechnology, Companies and CROs
- 7.3.2. Hospital and Reference Laboratories
- 7.3.3. Other End Users
- 7.1. Market Analysis, Insights and Forecast - by Product
- 8. Europe Digital Pathology Market Analysis, Insights and Forecast, 2020-2032
- 8.1. Market Analysis, Insights and Forecast - by Product
- 8.1.1. Scanner
- 8.1.2. Software
- 8.1.3. Storage Systems
- 8.1.4. Other Products
- 8.2. Market Analysis, Insights and Forecast - by Application
- 8.2.1. Disease Diagnosis
- 8.2.2. Drug Discovery
- 8.2.3. Education and Training
- 8.3. Market Analysis, Insights and Forecast - by End User
- 8.3.1. Pharmaceutical, Biotechnology, Companies and CROs
- 8.3.2. Hospital and Reference Laboratories
- 8.3.3. Other End Users
- 8.1. Market Analysis, Insights and Forecast - by Product
- 9. Asia Pacific Digital Pathology Market Analysis, Insights and Forecast, 2020-2032
- 9.1. Market Analysis, Insights and Forecast - by Product
- 9.1.1. Scanner
- 9.1.2. Software
- 9.1.3. Storage Systems
- 9.1.4. Other Products
- 9.2. Market Analysis, Insights and Forecast - by Application
- 9.2.1. Disease Diagnosis
- 9.2.2. Drug Discovery
- 9.2.3. Education and Training
- 9.3. Market Analysis, Insights and Forecast - by End User
- 9.3.1. Pharmaceutical, Biotechnology, Companies and CROs
- 9.3.2. Hospital and Reference Laboratories
- 9.3.3. Other End Users
- 9.1. Market Analysis, Insights and Forecast - by Product
- 10. Middle East and Africa Digital Pathology Market Analysis, Insights and Forecast, 2020-2032
- 10.1. Market Analysis, Insights and Forecast - by Product
- 10.1.1. Scanner
- 10.1.2. Software
- 10.1.3. Storage Systems
- 10.1.4. Other Products
- 10.2. Market Analysis, Insights and Forecast - by Application
- 10.2.1. Disease Diagnosis
- 10.2.2. Drug Discovery
- 10.2.3. Education and Training
- 10.3. Market Analysis, Insights and Forecast - by End User
- 10.3.1. Pharmaceutical, Biotechnology, Companies and CROs
- 10.3.2. Hospital and Reference Laboratories
- 10.3.3. Other End Users
- 10.1. Market Analysis, Insights and Forecast - by Product
- 11. South America Digital Pathology Market Analysis, Insights and Forecast, 2020-2032
- 11.1. Market Analysis, Insights and Forecast - by Product
- 11.1.1. Scanner
- 11.1.2. Software
- 11.1.3. Storage Systems
- 11.1.4. Other Products
- 11.2. Market Analysis, Insights and Forecast - by Application
- 11.2.1. Disease Diagnosis
- 11.2.2. Drug Discovery
- 11.2.3. Education and Training
- 11.3. Market Analysis, Insights and Forecast - by End User
- 11.3.1. Pharmaceutical, Biotechnology, Companies and CROs
- 11.3.2. Hospital and Reference Laboratories
- 11.3.3. Other End Users
- 11.1. Market Analysis, Insights and Forecast - by Product
- 12. Competitive Analysis
- 12.1. Company Profiles
- 12.1.1 Visiopharm A/S
- 12.1.1.1. Company Overview
- 12.1.1.2. Products
- 12.1.1.3. Company Financials
- 12.1.1.4. SWOT Analysis
- 12.1.2 Danaher Corporation (Leica Biosystems Nussloch GmbH)
- 12.1.2.1. Company Overview
- 12.1.2.2. Products
- 12.1.2.3. Company Financials
- 12.1.2.4. SWOT Analysis
- 12.1.3 3DHistech Ltd
- 12.1.3.1. Company Overview
- 12.1.3.2. Products
- 12.1.3.3. Company Financials
- 12.1.3.4. SWOT Analysis
- 12.1.4 Nikon Corporation
- 12.1.4.1. Company Overview
- 12.1.4.2. Products
- 12.1.4.3. Company Financials
- 12.1.4.4. SWOT Analysis
- 12.1.5 Proscia Inc
- 12.1.5.1. Company Overview
- 12.1.5.2. Products
- 12.1.5.3. Company Financials
- 12.1.5.4. SWOT Analysis
- 12.1.6 F Hoffmann-La Roche Ltd (Ventana Medical Systems Inc )
- 12.1.6.1. Company Overview
- 12.1.6.2. Products
- 12.1.6.3. Company Financials
- 12.1.6.4. SWOT Analysis
- 12.1.7 XIFIN Inc
- 12.1.7.1. Company Overview
- 12.1.7.2. Products
- 12.1.7.3. Company Financials
- 12.1.7.4. SWOT Analysis
- 12.1.8 Leica Biosystems
- 12.1.8.1. Company Overview
- 12.1.8.2. Products
- 12.1.8.3. Company Financials
- 12.1.8.4. SWOT Analysis
- 12.1.9 Koninklijke Philips NV
- 12.1.9.1. Company Overview
- 12.1.9.2. Products
- 12.1.9.3. Company Financials
- 12.1.9.4. SWOT Analysis
- 12.1.10 Hamamatsu Photonics K K
- 12.1.10.1. Company Overview
- 12.1.10.2. Products
- 12.1.10.3. Company Financials
- 12.1.10.4. SWOT Analysis
- 12.1.11 Mikroscan Technologies Inc
- 12.1.11.1. Company Overview
- 12.1.11.2. Products
- 12.1.11.3. Company Financials
- 12.1.11.4. SWOT Analysis
- 12.1.12 Olympus Corporation
- 12.1.12.1. Company Overview
- 12.1.12.2. Products
- 12.1.12.3. Company Financials
- 12.1.12.4. SWOT Analysis
- 12.1.13 Sectra AG
- 12.1.13.1. Company Overview
- 12.1.13.2. Products
- 12.1.13.3. Company Financials
- 12.1.13.4. SWOT Analysis
- 12.1.1 Visiopharm A/S
- 12.2. Market Entropy
- 12.2.1 Company's Key Areas Served
- 12.2.2 Recent Developments
- 12.3. Company Market Share Analysis 2025
- 12.3.1 Top 5 Companies Market Share Analysis
- 12.3.2 Top 3 Companies Market Share Analysis
- 12.4. List of Potential Customers
- 13. Research Methodology
List of Figures
- Figure 1: Global Digital Pathology Market Revenue Breakdown (Million, %) by Region 2025 & 2033
- Figure 2: North America Digital Pathology Market Revenue (Million), by Product 2025 & 2033
- Figure 3: North America Digital Pathology Market Revenue Share (%), by Product 2025 & 2033
- Figure 4: North America Digital Pathology Market Revenue (Million), by Application 2025 & 2033
- Figure 5: North America Digital Pathology Market Revenue Share (%), by Application 2025 & 2033
- Figure 6: North America Digital Pathology Market Revenue (Million), by End User 2025 & 2033
- Figure 7: North America Digital Pathology Market Revenue Share (%), by End User 2025 & 2033
- Figure 8: North America Digital Pathology Market Revenue (Million), by Country 2025 & 2033
- Figure 9: North America Digital Pathology Market Revenue Share (%), by Country 2025 & 2033
- Figure 10: Europe Digital Pathology Market Revenue (Million), by Product 2025 & 2033
- Figure 11: Europe Digital Pathology Market Revenue Share (%), by Product 2025 & 2033
- Figure 12: Europe Digital Pathology Market Revenue (Million), by Application 2025 & 2033
- Figure 13: Europe Digital Pathology Market Revenue Share (%), by Application 2025 & 2033
- Figure 14: Europe Digital Pathology Market Revenue (Million), by End User 2025 & 2033
- Figure 15: Europe Digital Pathology Market Revenue Share (%), by End User 2025 & 2033
- Figure 16: Europe Digital Pathology Market Revenue (Million), by Country 2025 & 2033
- Figure 17: Europe Digital Pathology Market Revenue Share (%), by Country 2025 & 2033
- Figure 18: Asia Pacific Digital Pathology Market Revenue (Million), by Product 2025 & 2033
- Figure 19: Asia Pacific Digital Pathology Market Revenue Share (%), by Product 2025 & 2033
- Figure 20: Asia Pacific Digital Pathology Market Revenue (Million), by Application 2025 & 2033
- Figure 21: Asia Pacific Digital Pathology Market Revenue Share (%), by Application 2025 & 2033
- Figure 22: Asia Pacific Digital Pathology Market Revenue (Million), by End User 2025 & 2033
- Figure 23: Asia Pacific Digital Pathology Market Revenue Share (%), by End User 2025 & 2033
- Figure 24: Asia Pacific Digital Pathology Market Revenue (Million), by Country 2025 & 2033
- Figure 25: Asia Pacific Digital Pathology Market Revenue Share (%), by Country 2025 & 2033
- Figure 26: Middle East and Africa Digital Pathology Market Revenue (Million), by Product 2025 & 2033
- Figure 27: Middle East and Africa Digital Pathology Market Revenue Share (%), by Product 2025 & 2033
- Figure 28: Middle East and Africa Digital Pathology Market Revenue (Million), by Application 2025 & 2033
- Figure 29: Middle East and Africa Digital Pathology Market Revenue Share (%), by Application 2025 & 2033
- Figure 30: Middle East and Africa Digital Pathology Market Revenue (Million), by End User 2025 & 2033
- Figure 31: Middle East and Africa Digital Pathology Market Revenue Share (%), by End User 2025 & 2033
- Figure 32: Middle East and Africa Digital Pathology Market Revenue (Million), by Country 2025 & 2033
- Figure 33: Middle East and Africa Digital Pathology Market Revenue Share (%), by Country 2025 & 2033
- Figure 34: South America Digital Pathology Market Revenue (Million), by Product 2025 & 2033
- Figure 35: South America Digital Pathology Market Revenue Share (%), by Product 2025 & 2033
- Figure 36: South America Digital Pathology Market Revenue (Million), by Application 2025 & 2033
- Figure 37: South America Digital Pathology Market Revenue Share (%), by Application 2025 & 2033
- Figure 38: South America Digital Pathology Market Revenue (Million), by End User 2025 & 2033
- Figure 39: South America Digital Pathology Market Revenue Share (%), by End User 2025 & 2033
- Figure 40: South America Digital Pathology Market Revenue (Million), by Country 2025 & 2033
- Figure 41: South America Digital Pathology Market Revenue Share (%), by Country 2025 & 2033
List of Tables
- Table 1: Global Digital Pathology Market Revenue Million Forecast, by Product 2020 & 2033
- Table 2: Global Digital Pathology Market Revenue Million Forecast, by Application 2020 & 2033
- Table 3: Global Digital Pathology Market Revenue Million Forecast, by End User 2020 & 2033
- Table 4: Global Digital Pathology Market Revenue Million Forecast, by Region 2020 & 2033
- Table 5: Global Digital Pathology Market Revenue Million Forecast, by Product 2020 & 2033
- Table 6: Global Digital Pathology Market Revenue Million Forecast, by Application 2020 & 2033
- Table 7: Global Digital Pathology Market Revenue Million Forecast, by End User 2020 & 2033
- Table 8: Global Digital Pathology Market Revenue Million Forecast, by Country 2020 & 2033
- Table 9: United States Digital Pathology Market Revenue (Million) Forecast, by Application 2020 & 2033
- Table 10: Canada Digital Pathology Market Revenue (Million) Forecast, by Application 2020 & 2033
- Table 11: Mexico Digital Pathology Market Revenue (Million) Forecast, by Application 2020 & 2033
- Table 12: Global Digital Pathology Market Revenue Million Forecast, by Product 2020 & 2033
- Table 13: Global Digital Pathology Market Revenue Million Forecast, by Application 2020 & 2033
- Table 14: Global Digital Pathology Market Revenue Million Forecast, by End User 2020 & 2033
- Table 15: Global Digital Pathology Market Revenue Million Forecast, by Country 2020 & 2033
- Table 16: Germany Digital Pathology Market Revenue (Million) Forecast, by Application 2020 & 2033
- Table 17: United Kingdom Digital Pathology Market Revenue (Million) Forecast, by Application 2020 & 2033
- Table 18: France Digital Pathology Market Revenue (Million) Forecast, by Application 2020 & 2033
- Table 19: Italy Digital Pathology Market Revenue (Million) Forecast, by Application 2020 & 2033
- Table 20: Spain Digital Pathology Market Revenue (Million) Forecast, by Application 2020 & 2033
- Table 21: Rest of Europe Digital Pathology Market Revenue (Million) Forecast, by Application 2020 & 2033
- Table 22: Global Digital Pathology Market Revenue Million Forecast, by Product 2020 & 2033
- Table 23: Global Digital Pathology Market Revenue Million Forecast, by Application 2020 & 2033
- Table 24: Global Digital Pathology Market Revenue Million Forecast, by End User 2020 & 2033
- Table 25: Global Digital Pathology Market Revenue Million Forecast, by Country 2020 & 2033
- Table 26: China Digital Pathology Market Revenue (Million) Forecast, by Application 2020 & 2033
- Table 27: Japan Digital Pathology Market Revenue (Million) Forecast, by Application 2020 & 2033
- Table 28: India Digital Pathology Market Revenue (Million) Forecast, by Application 2020 & 2033
- Table 29: Australia Digital Pathology Market Revenue (Million) Forecast, by Application 2020 & 2033
- Table 30: South Korea Digital Pathology Market Revenue (Million) Forecast, by Application 2020 & 2033
- Table 31: Rest of Asia Pacific Digital Pathology Market Revenue (Million) Forecast, by Application 2020 & 2033
- Table 32: Global Digital Pathology Market Revenue Million Forecast, by Product 2020 & 2033
- Table 33: Global Digital Pathology Market Revenue Million Forecast, by Application 2020 & 2033
- Table 34: Global Digital Pathology Market Revenue Million Forecast, by End User 2020 & 2033
- Table 35: Global Digital Pathology Market Revenue Million Forecast, by Country 2020 & 2033
- Table 36: GCC Digital Pathology Market Revenue (Million) Forecast, by Application 2020 & 2033
- Table 37: South Africa Digital Pathology Market Revenue (Million) Forecast, by Application 2020 & 2033
- Table 38: Rest of Middle East and Africa Digital Pathology Market Revenue (Million) Forecast, by Application 2020 & 2033
- Table 39: Global Digital Pathology Market Revenue Million Forecast, by Product 2020 & 2033
- Table 40: Global Digital Pathology Market Revenue Million Forecast, by Application 2020 & 2033
- Table 41: Global Digital Pathology Market Revenue Million Forecast, by End User 2020 & 2033
- Table 42: Global Digital Pathology Market Revenue Million Forecast, by Country 2020 & 2033
- Table 43: Brazil Digital Pathology Market Revenue (Million) Forecast, by Application 2020 & 2033
- Table 44: Argentina Digital Pathology Market Revenue (Million) Forecast, by Application 2020 & 2033
- Table 45: Rest of South America Digital Pathology Market Revenue (Million) Forecast, by Application 2020 & 2033
Frequently Asked Questions
1. What is the projected Compound Annual Growth Rate (CAGR) of the Digital Pathology Market?
The projected CAGR is approximately 9.99%.
2. Which companies are prominent players in the Digital Pathology Market?
Key companies in the market include Visiopharm A/S, Danaher Corporation (Leica Biosystems Nussloch GmbH), 3DHistech Ltd, Nikon Corporation, Proscia Inc, F Hoffmann-La Roche Ltd (Ventana Medical Systems Inc ), XIFIN Inc, Leica Biosystems, Koninklijke Philips NV, Hamamatsu Photonics K K, Mikroscan Technologies Inc, Olympus Corporation, Sectra AG.
3. What are the main segments of the Digital Pathology Market?
The market segments include Product, Application, End User.
4. Can you provide details about the market size?
The market size is estimated to be USD 1.18 Million as of 2022.
5. What are some drivers contributing to market growth?
Growing Number of Tele-consultations; Rising Adoption of Digital Pathology to Enhance Lab Efficiency; Increasing Application in Drug Discovery and Companion Diagnostics.
6. What are the notable trends driving market growth?
Disease Diagnosis Segment is Expected to Hold Significant Share Over the Forecast Period.
7. Are there any restraints impacting market growth?
Stringent Regulatory Concerns for Primary Diagnosis; Lack of Standard Guidelines for Digital Pathology.
8. Can you provide examples of recent developments in the market?
June 2022: SpIntellx, Inc. and Inspirata have collaborated to integrate the SpIntellx HistoMapr-Breast platform and Inspirata's Dynamyx software into one seamless solution. HistoMapr-Breast is the one and only computational pathology software that taps the power of explainable artificial intelligence (xAI) for healthcare providers to diagnose, prognosticate and treat breast cancer more efficiently and accurately.
9. What pricing options are available for accessing the report?
Pricing options include single-user, multi-user, and enterprise licenses priced at USD 4750, USD 5250, and USD 8750 respectively.
10. Is the market size provided in terms of value or volume?
The market size is provided in terms of value, measured in Million.
11. Are there any specific market keywords associated with the report?
Yes, the market keyword associated with the report is "Digital Pathology Market," which aids in identifying and referencing the specific market segment covered.
12. How do I determine which pricing option suits my needs best?
The pricing options vary based on user requirements and access needs. Individual users may opt for single-user licenses, while businesses requiring broader access may choose multi-user or enterprise licenses for cost-effective access to the report.
13. Are there any additional resources or data provided in the Digital Pathology Market report?
While the report offers comprehensive insights, it's advisable to review the specific contents or supplementary materials provided to ascertain if additional resources or data are available.
14. How can I stay updated on further developments or reports in the Digital Pathology Market?
To stay informed about further developments, trends, and reports in the Digital Pathology Market, consider subscribing to industry newsletters, following relevant companies and organizations, or regularly checking reputable industry news sources and publications.
Methodology
Step 1 - Identification of Relevant Samples Size from Population Database


Step 2 - Approaches for Defining Global Market Size (Value, Volume* & Price*)

Note*: In applicable scenarios
Step 3 - Data Sources
Primary Research
- Web Analytics
- Survey Reports
- Research Institute
- Latest Research Reports
- Opinion Leaders
Secondary Research
- Annual Reports
- White Paper
- Latest Press Release
- Industry Association
- Paid Database
- Investor Presentations

Step 4 - Data Triangulation
Involves using different sources of information in order to increase the validity of a study
These sources are likely to be stakeholders in a program - participants, other researchers, program staff, other community members, and so on.
Then we put all data in single framework & apply various statistical tools to find out the dynamic on the market.
During the analysis stage, feedback from the stakeholder groups would be compared to determine areas of agreement as well as areas of divergence

