

Key Insights
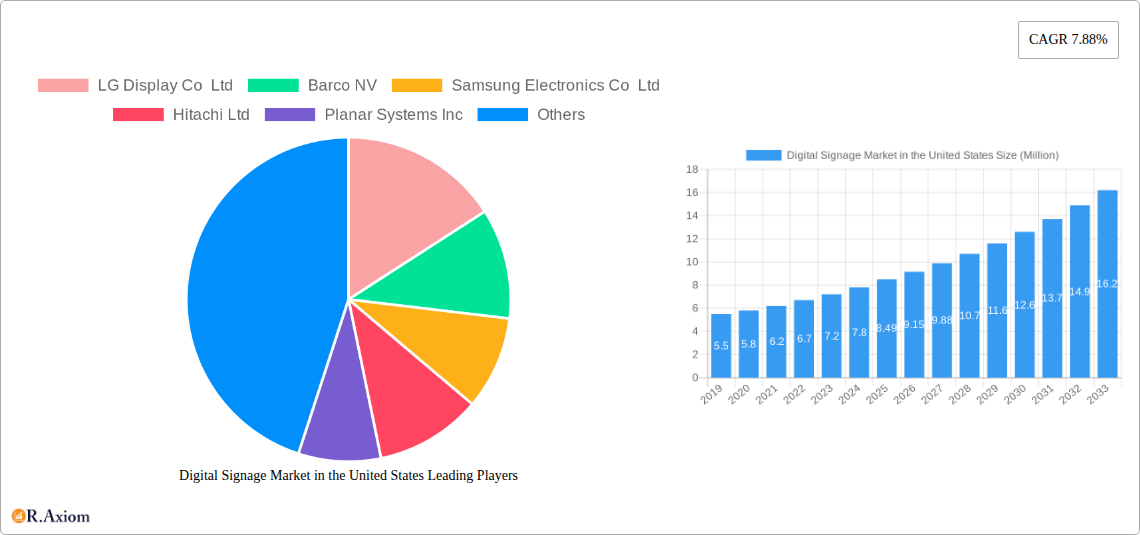
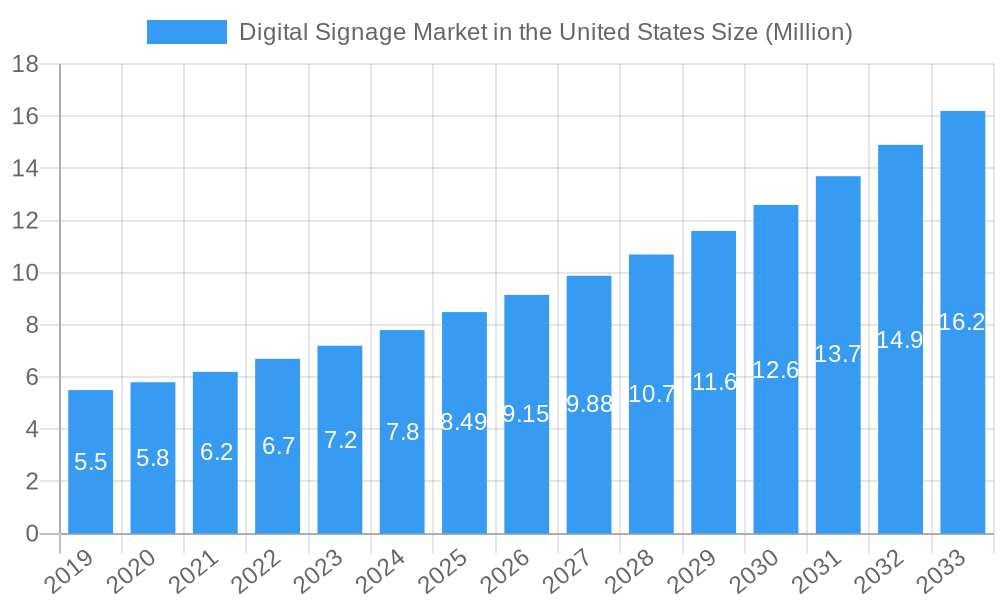
The United States digital signage market is poised for robust expansion, projected to reach approximately $8.49 billion in value by 2025. This growth is fueled by an impressive Compound Annual Growth Rate (CAGR) of 7.88% over the forecast period of 2025-2033, indicating a sustained upward trajectory. Key drivers propelling this market include the increasing demand for dynamic and engaging visual communication across various sectors, the advent of advanced display technologies like OLED and high-definition LCD/LED panels, and the growing integration of interactive features such as touchscreens and AI-powered content management. The retail sector continues to be a dominant force, leveraging digital signage for personalized advertising, in-store navigation, and enhanced customer experiences. Similarly, the transportation industry is adopting these solutions for real-time information dissemination, while the hospitality and education sectors are increasingly recognizing the value of digital displays for branding, wayfinding, and interactive learning environments. The ongoing digital transformation and the need for impactful customer engagement strategies are central to this market's dynamism.
Digital Signage Market in the United States Market Size (In Million)
Several trends are shaping the evolution of the US digital signage market. The rise of programmatic advertising and data analytics is enabling more targeted and personalized content delivery, thereby maximizing return on investment for businesses. Furthermore, the integration of IoT devices and augmented reality (AR) is creating immersive and interactive customer journeys. The shift towards cloud-based solutions is also simplifying content management and deployment, making digital signage more accessible and scalable. However, certain restraints exist, including the initial high cost of hardware installation and maintenance, potential concerns regarding content obsolescence, and the need for skilled personnel to manage complex systems. Despite these challenges, the long-term outlook remains highly positive, with innovation in hardware, software, and services continually pushing the boundaries of what digital signage can achieve. The market is expected to witness significant advancements in energy-efficient displays and sustainable deployment practices in the coming years.
Digital Signage Market in the United States Company Market Share
Unlocking the Future of Visual Communication: The Comprehensive Digital Signage Market Report for the United States
This in-depth report provides an unparalleled analysis of the Digital Signage Market in the United States, a dynamic sector experiencing robust growth driven by technological advancements and evolving consumer engagement strategies. Spanning the study period of 2019–2033, with a focus on 2025 as the base and estimated year, and a forecast period from 2025–2033, this report offers critical insights for industry stakeholders, including manufacturers, software providers, service integrators, and end-users. We delve into market concentration, innovation, industry trends, dominant segments, product developments, growth drivers, challenges, emerging opportunities, leading players, and key industry developments.
Digital Signage Market in the United States Market Concentration & Innovation
The Digital Signage Market in the United States exhibits moderate to high concentration, with a few key players like Samsung Electronics Co Ltd, LG Display Co Ltd, and Sharp Corporation holding significant market share. However, the market is also characterized by ongoing innovation, fueled by advancements in display technologies (e.g., OLED display, LED display) and the increasing demand for interactive and data-driven signage solutions. Regulatory frameworks, while generally supportive of technological adoption, can influence deployment strategies, particularly in sectors like transportation and government. Product substitutes, such as static signage and traditional advertising, are steadily being displaced by the superior engagement and flexibility offered by digital solutions. End-user trends are overwhelmingly leaning towards enhanced customer experiences, personalized content delivery, and efficient operational management, driving demand across all major sectors. Merger and acquisition (M&A) activities are present, though specific deal values are not publicly disclosed for all transactions, the strategic consolidation aims to expand product portfolios and geographical reach. The estimated market share for leading players underscores the competitive landscape.
Digital Signage Market in the United States Industry Trends & Insights
The Digital Signage Market in the United States is poised for substantial expansion, driven by a confluence of technological innovations and evolving consumer preferences. The market is experiencing a significant CAGR, projected to reach trillions of dollars by 2033, as businesses increasingly recognize the power of dynamic visual communication to capture attention, convey information, and influence purchasing decisions. Key growth drivers include the escalating demand for immersive customer experiences in retail environments, the need for real-time information dissemination in transportation hubs, and the adoption of digital menus and promotional displays in the hospitality sector. Technological disruptions, such as the advent of AI-powered content management systems, the integration of IoT devices for personalized interactions, and the proliferation of ultra-high-definition displays, are reshaping the market landscape. Consumer preferences are shifting towards interactive, personalized, and engaging content, making digital signage an indispensable tool for brand building and customer loyalty. The competitive dynamics are intensifying, with established players investing heavily in R&D and new entrants focusing on niche applications and innovative solutions. The market penetration of digital signage solutions continues to climb across various end-user segments, underscoring its growing importance in modern business operations.
Dominant Markets & Segments in Digital Signage Market in the United States
The Digital Signage Market in the United States is characterized by the dominance of specific segments and end-users, driven by distinct market forces and technological adoption rates.
Hardware Segment Dominance: The Hardware segment, particularly LCD/LED Display technologies, currently holds the largest market share within the United States.
- LCD/LED Displays: Their cost-effectiveness, durability, and widespread availability make them the go-to choice for a vast array of applications, from retail store fronts to corporate lobbies. The continuous improvement in brightness, resolution, and energy efficiency further solidifies their position.
- OLED Displays: While more premium, OLED displays are gaining traction in high-end retail and entertainment venues due to their superior contrast ratios and aesthetic appeal.
- Media Players: The robust demand for content playback and management drives the growth of the media player segment, with an increasing focus on integrated solutions and cloud-based platforms.
- Projectors/Projection Screens: These remain relevant for specific applications such as large-format presentations, event spaces, and certain retail displays where flexibility in screen size is paramount.
- Other Hardware: This includes components like mounts, cables, and interactive overlays, which are essential for complete digital signage installations.
Retail End User Leadership: The Retail sector continues to be the most significant end-user of digital signage solutions in the United States.
- Key Drivers: The intense competition in the retail landscape necessitates innovative ways to attract and engage customers. Digital signage plays a crucial role in impulse purchases, brand promotion, in-store navigation, and creating interactive shopping experiences. Economic policies that encourage consumer spending and infrastructure development in commercial spaces directly benefit digital signage adoption in retail.
- Dominance Analysis: Retailers leverage digital signage for dynamic pricing, personalized offers, product demonstrations, and creating immersive brand environments. The ability to update content instantly allows for agile marketing campaigns, crucial in a fast-paced retail market.
Emerging Growth in Transportation and Hospitality: The Transportation and Hospitality sectors are witnessing rapid adoption and significant growth.
- Transportation: Digital signage is essential for real-time flight/train information, wayfinding, and passenger announcements in airports, train stations, and bus terminals.
- Hospitality: Hotels, restaurants, and bars utilize digital signage for digital menus, promotions, ambient advertising, and guest information, enhancing operational efficiency and customer satisfaction.
BFSI, Education, and Government Adoption: The BFSI, Education, and Government sectors are increasingly adopting digital signage for internal and external communication, security, and public information dissemination. The growing emphasis on digital transformation and smart city initiatives further fuels adoption in these segments.
Digital Signage Market in the United States Product Developments
Product developments in the Digital Signage Market in the United States are characterized by a drive towards enhanced interactivity, intelligence, and sustainability. Innovations in LCD/LED Display technology are focusing on higher resolutions, better energy efficiency, and thinner bezels for seamless video walls. The integration of touch capabilities and sensor technology is enabling more engaging user experiences, particularly in interactive kiosks and wayfinding systems. Advancements in OLED Display technology are pushing the boundaries of visual fidelity, finding applications in premium retail and entertainment environments. Software development is heavily focused on AI-powered content management, enabling personalized content delivery, predictive analytics for audience engagement, and simplified remote management of large networks of displays. The introduction of more compact and powerful Media Players supports the deployment of sophisticated digital signage solutions.
Report Scope & Segmentation Analysis
This report meticulously segments the Digital Signage Market in the United States by Type, End User, and key geographical regions.
Type Segmentation: The analysis covers Hardware (including LCD/LED Display, OLED Display, Media Players, Projectors/Projection Screens, and Other Hardware), Software, and Services. The hardware segment is projected to maintain its lead, driven by continuous hardware innovation and declining costs. Software solutions, especially those with AI and analytics capabilities, are expected to witness robust growth, as are specialized installation and maintenance Services.
End User Segmentation: The report details the market penetration and growth projections for Retail, Transportation, Hospitality, BFSI, Education, Government, and Other End Users. The retail sector is anticipated to retain its dominant position throughout the forecast period, with significant growth expected in transportation and hospitality due to increased travel and consumer spending.
Key Drivers of Digital Signage Market in the United States Growth
The Digital Signage Market in the United States is propelled by a multifaceted set of growth drivers.
- Technological Advancements: Continuous innovation in display technology, including higher resolutions, increased brightness, and energy efficiency, makes digital signage more appealing and cost-effective. The development of interactive features like touchscreens and gesture recognition enhances user engagement.
- Growing Demand for Enhanced Customer Experience: Businesses across all sectors are prioritizing customer engagement and personalized interactions. Digital signage offers a dynamic and flexible medium to achieve this, from interactive product showcases in retail to real-time information in transportation hubs.
- Cost-Effectiveness and ROI: Despite initial investment, digital signage offers a strong return on investment by reducing printing costs for static materials, enabling targeted advertising, and improving operational efficiency through dynamic content updates.
- Increased Adoption in Emerging Sectors: The expanding use of digital signage in sectors like healthcare for patient communication and in corporate environments for internal branding and information dissemination further broadens the market's reach.
Challenges in the Digital Signage Market in the United States Sector
The Digital Signage Market in the United States faces several challenges that can impact its growth trajectory.
- High Initial Investment Costs: While costs are decreasing, the initial outlay for hardware, software, and installation can still be a barrier for some smaller businesses.
- Content Creation and Management Complexity: Developing compelling and relevant content requires specialized skills and ongoing effort, which can be a challenge for organizations lacking dedicated resources.
- Integration with Existing IT Infrastructure: Seamless integration of digital signage systems with existing IT networks and software can be complex, requiring careful planning and execution.
- Network Reliability and Security Concerns: Ensuring consistent network connectivity for content delivery and protecting sensitive data from cyber threats are critical concerns that need to be addressed by robust security measures.
Emerging Opportunities in Digital Signage Market in the United States
The Digital Signage Market in the United States is rife with emerging opportunities driven by evolving technological trends and consumer behaviors.
- AI and Machine Learning Integration: Leveraging AI for personalized content delivery, audience analytics, and predictive maintenance will create highly engaging and efficient digital signage solutions.
- The Metaverse and Extended Reality (XR): The convergence of physical and digital spaces opens new avenues for immersive digital signage experiences that blend with augmented and virtual reality environments.
- Sustainability and Energy Efficiency: Growing environmental consciousness is driving demand for energy-efficient hardware and software solutions, creating opportunities for eco-friendly digital signage.
- Interactive and Experiential Retail: The continued growth of experiential retail will fuel demand for interactive digital signage that offers personalized product discovery, gamification, and immersive brand storytelling.
Leading Players in the Digital Signage Market in the United States Market
- LG Display Co Ltd
- Barco NV
- Samsung Electronics Co Ltd
- Hitachi Ltd
- Planar Systems Inc
- NEC Display Solutions Ltd
- Cisco Systems Inc
- Sharp Corporation
- Goodview Electronic Co Ltd
- Panasonic Corporation
- Sony Corporation
Key Developments in Digital Signage Market in the United States Industry
- November 2022: At Electronica, printed e-paper display manufacturer Ynvisible Interactive Inc. introduced its new Digital Signage Solution. The company positions its technology as the least energy-intensive printed e-paper display on the market. Ynvisible continues to decisively direct its activities and resources to hasten the transformation of its organization from one focused on project sales to one based on products. A straightforward big-size e-paper display with digital and alphanumeric capabilities is included in this new, cost-efficient family of devices that is intended for ultra-low power applications.
- April 2022: Sharp NEC Display Solutions is launching the new NEC PX 2201 UL projector model. The ultra-bright 1DLP model with RB laser technology is expected to enhance color performance and is highly compact.
Strategic Outlook for Digital Signage Market in the United States Market
The strategic outlook for the Digital Signage Market in the United States is exceptionally positive, driven by the ongoing digital transformation across industries. The market's future growth will be fueled by the relentless pursuit of enhanced customer experiences, increased operational efficiencies, and the innovative integration of emerging technologies like AI and XR. Strategic partnerships and collaborations will be crucial for market players to expand their service offerings and reach new customer segments. Investments in cloud-based solutions and robust analytics platforms will enable businesses to leverage data for more personalized and effective content deployment. The continued evolution of display technologies, coupled with a growing demand for interactive and sustainable solutions, will ensure the Digital Signage Market in the United States remains a vibrant and expanding sector for years to come.
Digital Signage Market in the United States Segmentation
-
1. Type
-
1.1. Hardware
- 1.1.1. LCD/LED Display
- 1.1.2. OLED Display
- 1.1.3. Media Players
- 1.1.4. Projectors/ Projection Screens
- 1.1.5. Other Hardware
- 1.2. Software
- 1.3. Services
-
1.1. Hardware
-
2. End User
- 2.1. Retail
- 2.2. Transportation
- 2.3. Hospitality
- 2.4. BFSI
- 2.5. Education
- 2.6. Government
- 2.7. Other End Users
Digital Signage Market in the United States Segmentation By Geography
-
1. North America
- 1.1. United States
- 1.2. Canada
- 1.3. Mexico
-
2. South America
- 2.1. Brazil
- 2.2. Argentina
- 2.3. Rest of South America
-
3. Europe
- 3.1. United Kingdom
- 3.2. Germany
- 3.3. France
- 3.4. Italy
- 3.5. Spain
- 3.6. Russia
- 3.7. Benelux
- 3.8. Nordics
- 3.9. Rest of Europe
-
4. Middle East & Africa
- 4.1. Turkey
- 4.2. Israel
- 4.3. GCC
- 4.4. North Africa
- 4.5. South Africa
- 4.6. Rest of Middle East & Africa
-
5. Asia Pacific
- 5.1. China
- 5.2. India
- 5.3. Japan
- 5.4. South Korea
- 5.5. ASEAN
- 5.6. Oceania
- 5.7. Rest of Asia Pacific
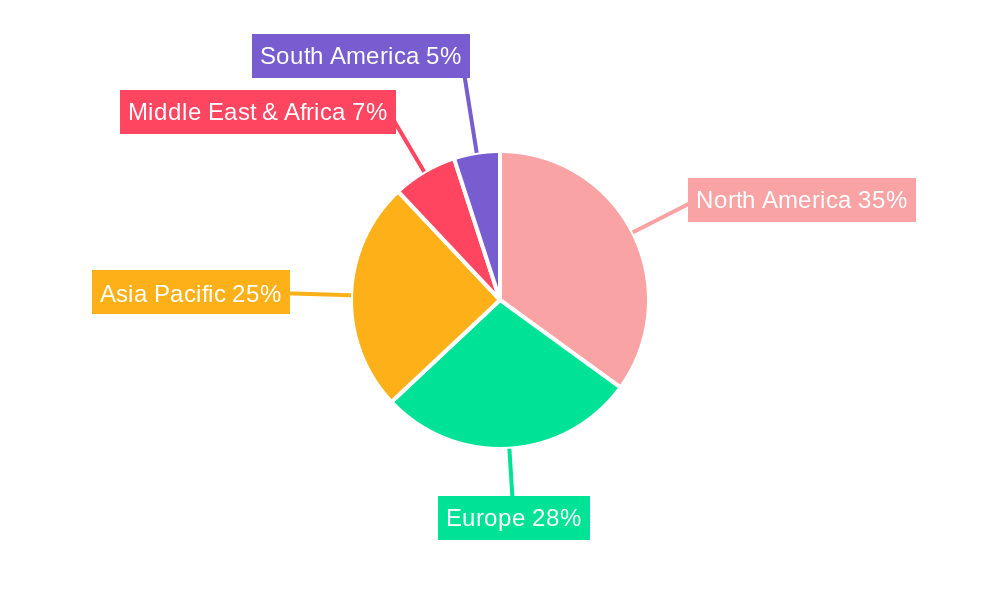
Digital Signage Market in the United States Regional Market Share
Geographic Coverage of Digital Signage Market in the United States
Digital Signage Market in the United States REPORT HIGHLIGHTS
| Aspects | Details |
|---|---|
| Study Period | 2020-2034 |
| Base Year | 2025 |
| Estimated Year | 2026 |
| Forecast Period | 2026-2034 |
| Historical Period | 2020-2025 |
| Growth Rate | CAGR of 7.88% from 2020-2034 |
| Segmentation |
|
Table of Contents
- 1. Introduction
- 1.1. Research Scope
- 1.2. Market Segmentation
- 1.3. Research Objective
- 1.4. Definitions and Assumptions
- 2. Executive Summary
- 2.1. Market Snapshot
- 3. Market Dynamics
- 3.1. Market Drivers
- 3.2. Market Restrains
- 3.3. Market Trends
- 3.4. Market Opportunities
- 4. Market Factor Analysis
- 4.1. Porters Five Forces
- 4.1.1. Bargaining Power of Suppliers
- 4.1.2. Bargaining Power of Buyers
- 4.1.3. Threat of New Entrants
- 4.1.4. Threat of Substitutes
- 4.1.5. Competitive Rivalry
- 4.2. PESTEL analysis
- 4.3. BCG Analysis
- 4.3.1. Stars (High Growth, High Market Share)
- 4.3.2. Cash Cows (Low Growth, High Market Share)
- 4.3.3. Question Mark (High Growth, Low Market Share)
- 4.3.4. Dogs (Low Growth, Low Market Share)
- 4.4. Ansoff Matrix Analysis
- 4.5. Supply Chain Analysis
- 4.6. Regulatory Landscape
- 4.7. Current Market Potential and Opportunity Assessment (TAM–SAM–SOM Framework)
- 4.8. RAX Analyst Note
- 4.1. Porters Five Forces
- 5. Market Analysis, Insights and Forecast 2021-2033
- 5.1. Market Analysis, Insights and Forecast - by Type
- 5.1.1. Hardware
- 5.1.1.1. LCD/LED Display
- 5.1.1.2. OLED Display
- 5.1.1.3. Media Players
- 5.1.1.4. Projectors/ Projection Screens
- 5.1.1.5. Other Hardware
- 5.1.2. Software
- 5.1.3. Services
- 5.1.1. Hardware
- 5.2. Market Analysis, Insights and Forecast - by End User
- 5.2.1. Retail
- 5.2.2. Transportation
- 5.2.3. Hospitality
- 5.2.4. BFSI
- 5.2.5. Education
- 5.2.6. Government
- 5.2.7. Other End Users
- 5.3. Market Analysis, Insights and Forecast - by Region
- 5.3.1. North America
- 5.3.2. South America
- 5.3.3. Europe
- 5.3.4. Middle East & Africa
- 5.3.5. Asia Pacific
- 5.1. Market Analysis, Insights and Forecast - by Type
- 6. Global Digital Signage Market in the United States Analysis, Insights and Forecast, 2021-2033
- 6.1. Market Analysis, Insights and Forecast - by Type
- 6.1.1. Hardware
- 6.1.1.1. LCD/LED Display
- 6.1.1.2. OLED Display
- 6.1.1.3. Media Players
- 6.1.1.4. Projectors/ Projection Screens
- 6.1.1.5. Other Hardware
- 6.1.2. Software
- 6.1.3. Services
- 6.1.1. Hardware
- 6.2. Market Analysis, Insights and Forecast - by End User
- 6.2.1. Retail
- 6.2.2. Transportation
- 6.2.3. Hospitality
- 6.2.4. BFSI
- 6.2.5. Education
- 6.2.6. Government
- 6.2.7. Other End Users
- 6.1. Market Analysis, Insights and Forecast - by Type
- 7. North America Digital Signage Market in the United States Analysis, Insights and Forecast, 2020-2032
- 7.1. Market Analysis, Insights and Forecast - by Type
- 7.1.1. Hardware
- 7.1.1.1. LCD/LED Display
- 7.1.1.2. OLED Display
- 7.1.1.3. Media Players
- 7.1.1.4. Projectors/ Projection Screens
- 7.1.1.5. Other Hardware
- 7.1.2. Software
- 7.1.3. Services
- 7.1.1. Hardware
- 7.2. Market Analysis, Insights and Forecast - by End User
- 7.2.1. Retail
- 7.2.2. Transportation
- 7.2.3. Hospitality
- 7.2.4. BFSI
- 7.2.5. Education
- 7.2.6. Government
- 7.2.7. Other End Users
- 7.1. Market Analysis, Insights and Forecast - by Type
- 8. South America Digital Signage Market in the United States Analysis, Insights and Forecast, 2020-2032
- 8.1. Market Analysis, Insights and Forecast - by Type
- 8.1.1. Hardware
- 8.1.1.1. LCD/LED Display
- 8.1.1.2. OLED Display
- 8.1.1.3. Media Players
- 8.1.1.4. Projectors/ Projection Screens
- 8.1.1.5. Other Hardware
- 8.1.2. Software
- 8.1.3. Services
- 8.1.1. Hardware
- 8.2. Market Analysis, Insights and Forecast - by End User
- 8.2.1. Retail
- 8.2.2. Transportation
- 8.2.3. Hospitality
- 8.2.4. BFSI
- 8.2.5. Education
- 8.2.6. Government
- 8.2.7. Other End Users
- 8.1. Market Analysis, Insights and Forecast - by Type
- 9. Europe Digital Signage Market in the United States Analysis, Insights and Forecast, 2020-2032
- 9.1. Market Analysis, Insights and Forecast - by Type
- 9.1.1. Hardware
- 9.1.1.1. LCD/LED Display
- 9.1.1.2. OLED Display
- 9.1.1.3. Media Players
- 9.1.1.4. Projectors/ Projection Screens
- 9.1.1.5. Other Hardware
- 9.1.2. Software
- 9.1.3. Services
- 9.1.1. Hardware
- 9.2. Market Analysis, Insights and Forecast - by End User
- 9.2.1. Retail
- 9.2.2. Transportation
- 9.2.3. Hospitality
- 9.2.4. BFSI
- 9.2.5. Education
- 9.2.6. Government
- 9.2.7. Other End Users
- 9.1. Market Analysis, Insights and Forecast - by Type
- 10. Middle East & Africa Digital Signage Market in the United States Analysis, Insights and Forecast, 2020-2032
- 10.1. Market Analysis, Insights and Forecast - by Type
- 10.1.1. Hardware
- 10.1.1.1. LCD/LED Display
- 10.1.1.2. OLED Display
- 10.1.1.3. Media Players
- 10.1.1.4. Projectors/ Projection Screens
- 10.1.1.5. Other Hardware
- 10.1.2. Software
- 10.1.3. Services
- 10.1.1. Hardware
- 10.2. Market Analysis, Insights and Forecast - by End User
- 10.2.1. Retail
- 10.2.2. Transportation
- 10.2.3. Hospitality
- 10.2.4. BFSI
- 10.2.5. Education
- 10.2.6. Government
- 10.2.7. Other End Users
- 10.1. Market Analysis, Insights and Forecast - by Type
- 11. Asia Pacific Digital Signage Market in the United States Analysis, Insights and Forecast, 2020-2032
- 11.1. Market Analysis, Insights and Forecast - by Type
- 11.1.1. Hardware
- 11.1.1.1. LCD/LED Display
- 11.1.1.2. OLED Display
- 11.1.1.3. Media Players
- 11.1.1.4. Projectors/ Projection Screens
- 11.1.1.5. Other Hardware
- 11.1.2. Software
- 11.1.3. Services
- 11.1.1. Hardware
- 11.2. Market Analysis, Insights and Forecast - by End User
- 11.2.1. Retail
- 11.2.2. Transportation
- 11.2.3. Hospitality
- 11.2.4. BFSI
- 11.2.5. Education
- 11.2.6. Government
- 11.2.7. Other End Users
- 11.1. Market Analysis, Insights and Forecast - by Type
- 12. Competitive Analysis
- 12.1. Company Profiles
- 12.1.1 LG Display Co Ltd
- 12.1.1.1. Company Overview
- 12.1.1.2. Products
- 12.1.1.3. Company Financials
- 12.1.1.4. SWOT Analysis
- 12.1.2 Barco NV
- 12.1.2.1. Company Overview
- 12.1.2.2. Products
- 12.1.2.3. Company Financials
- 12.1.2.4. SWOT Analysis
- 12.1.3 Samsung Electronics Co Ltd
- 12.1.3.1. Company Overview
- 12.1.3.2. Products
- 12.1.3.3. Company Financials
- 12.1.3.4. SWOT Analysis
- 12.1.4 Hitachi Ltd
- 12.1.4.1. Company Overview
- 12.1.4.2. Products
- 12.1.4.3. Company Financials
- 12.1.4.4. SWOT Analysis
- 12.1.5 Planar Systems Inc
- 12.1.5.1. Company Overview
- 12.1.5.2. Products
- 12.1.5.3. Company Financials
- 12.1.5.4. SWOT Analysis
- 12.1.6 NEC Display Solutions Ltd
- 12.1.6.1. Company Overview
- 12.1.6.2. Products
- 12.1.6.3. Company Financials
- 12.1.6.4. SWOT Analysis
- 12.1.7 Cisco Systems Inc *List Not Exhaustive
- 12.1.7.1. Company Overview
- 12.1.7.2. Products
- 12.1.7.3. Company Financials
- 12.1.7.4. SWOT Analysis
- 12.1.8 Sharp Corporation
- 12.1.8.1. Company Overview
- 12.1.8.2. Products
- 12.1.8.3. Company Financials
- 12.1.8.4. SWOT Analysis
- 12.1.9 Goodview Electronic Co Ltd
- 12.1.9.1. Company Overview
- 12.1.9.2. Products
- 12.1.9.3. Company Financials
- 12.1.9.4. SWOT Analysis
- 12.1.10 Panasonic Corporation
- 12.1.10.1. Company Overview
- 12.1.10.2. Products
- 12.1.10.3. Company Financials
- 12.1.10.4. SWOT Analysis
- 12.1.11 Sony Corporation
- 12.1.11.1. Company Overview
- 12.1.11.2. Products
- 12.1.11.3. Company Financials
- 12.1.11.4. SWOT Analysis
- 12.1.1 LG Display Co Ltd
- 12.2. Market Entropy
- 12.2.1 Company's Key Areas Served
- 12.2.2 Recent Developments
- 12.3. Company Market Share Analysis 2025
- 12.3.1 Top 5 Companies Market Share Analysis
- 12.3.2 Top 3 Companies Market Share Analysis
- 12.4. List of Potential Customers
- 13. Research Methodology
List of Figures
- Figure 1: Global Digital Signage Market in the United States Revenue Breakdown (Million, %) by Region 2025 & 2033
- Figure 2: North America Digital Signage Market in the United States Revenue (Million), by Type 2025 & 2033
- Figure 3: North America Digital Signage Market in the United States Revenue Share (%), by Type 2025 & 2033
- Figure 4: North America Digital Signage Market in the United States Revenue (Million), by End User 2025 & 2033
- Figure 5: North America Digital Signage Market in the United States Revenue Share (%), by End User 2025 & 2033
- Figure 6: North America Digital Signage Market in the United States Revenue (Million), by Country 2025 & 2033
- Figure 7: North America Digital Signage Market in the United States Revenue Share (%), by Country 2025 & 2033
- Figure 8: South America Digital Signage Market in the United States Revenue (Million), by Type 2025 & 2033
- Figure 9: South America Digital Signage Market in the United States Revenue Share (%), by Type 2025 & 2033
- Figure 10: South America Digital Signage Market in the United States Revenue (Million), by End User 2025 & 2033
- Figure 11: South America Digital Signage Market in the United States Revenue Share (%), by End User 2025 & 2033
- Figure 12: South America Digital Signage Market in the United States Revenue (Million), by Country 2025 & 2033
- Figure 13: South America Digital Signage Market in the United States Revenue Share (%), by Country 2025 & 2033
- Figure 14: Europe Digital Signage Market in the United States Revenue (Million), by Type 2025 & 2033
- Figure 15: Europe Digital Signage Market in the United States Revenue Share (%), by Type 2025 & 2033
- Figure 16: Europe Digital Signage Market in the United States Revenue (Million), by End User 2025 & 2033
- Figure 17: Europe Digital Signage Market in the United States Revenue Share (%), by End User 2025 & 2033
- Figure 18: Europe Digital Signage Market in the United States Revenue (Million), by Country 2025 & 2033
- Figure 19: Europe Digital Signage Market in the United States Revenue Share (%), by Country 2025 & 2033
- Figure 20: Middle East & Africa Digital Signage Market in the United States Revenue (Million), by Type 2025 & 2033
- Figure 21: Middle East & Africa Digital Signage Market in the United States Revenue Share (%), by Type 2025 & 2033
- Figure 22: Middle East & Africa Digital Signage Market in the United States Revenue (Million), by End User 2025 & 2033
- Figure 23: Middle East & Africa Digital Signage Market in the United States Revenue Share (%), by End User 2025 & 2033
- Figure 24: Middle East & Africa Digital Signage Market in the United States Revenue (Million), by Country 2025 & 2033
- Figure 25: Middle East & Africa Digital Signage Market in the United States Revenue Share (%), by Country 2025 & 2033
- Figure 26: Asia Pacific Digital Signage Market in the United States Revenue (Million), by Type 2025 & 2033
- Figure 27: Asia Pacific Digital Signage Market in the United States Revenue Share (%), by Type 2025 & 2033
- Figure 28: Asia Pacific Digital Signage Market in the United States Revenue (Million), by End User 2025 & 2033
- Figure 29: Asia Pacific Digital Signage Market in the United States Revenue Share (%), by End User 2025 & 2033
- Figure 30: Asia Pacific Digital Signage Market in the United States Revenue (Million), by Country 2025 & 2033
- Figure 31: Asia Pacific Digital Signage Market in the United States Revenue Share (%), by Country 2025 & 2033
List of Tables
- Table 1: Global Digital Signage Market in the United States Revenue Million Forecast, by Type 2020 & 2033
- Table 2: Global Digital Signage Market in the United States Revenue Million Forecast, by End User 2020 & 2033
- Table 3: Global Digital Signage Market in the United States Revenue Million Forecast, by Region 2020 & 2033
- Table 4: Global Digital Signage Market in the United States Revenue Million Forecast, by Type 2020 & 2033
- Table 5: Global Digital Signage Market in the United States Revenue Million Forecast, by End User 2020 & 2033
- Table 6: Global Digital Signage Market in the United States Revenue Million Forecast, by Country 2020 & 2033
- Table 7: United States Digital Signage Market in the United States Revenue (Million) Forecast, by Application 2020 & 2033
- Table 8: Canada Digital Signage Market in the United States Revenue (Million) Forecast, by Application 2020 & 2033
- Table 9: Mexico Digital Signage Market in the United States Revenue (Million) Forecast, by Application 2020 & 2033
- Table 10: Global Digital Signage Market in the United States Revenue Million Forecast, by Type 2020 & 2033
- Table 11: Global Digital Signage Market in the United States Revenue Million Forecast, by End User 2020 & 2033
- Table 12: Global Digital Signage Market in the United States Revenue Million Forecast, by Country 2020 & 2033
- Table 13: Brazil Digital Signage Market in the United States Revenue (Million) Forecast, by Application 2020 & 2033
- Table 14: Argentina Digital Signage Market in the United States Revenue (Million) Forecast, by Application 2020 & 2033
- Table 15: Rest of South America Digital Signage Market in the United States Revenue (Million) Forecast, by Application 2020 & 2033
- Table 16: Global Digital Signage Market in the United States Revenue Million Forecast, by Type 2020 & 2033
- Table 17: Global Digital Signage Market in the United States Revenue Million Forecast, by End User 2020 & 2033
- Table 18: Global Digital Signage Market in the United States Revenue Million Forecast, by Country 2020 & 2033
- Table 19: United Kingdom Digital Signage Market in the United States Revenue (Million) Forecast, by Application 2020 & 2033
- Table 20: Germany Digital Signage Market in the United States Revenue (Million) Forecast, by Application 2020 & 2033
- Table 21: France Digital Signage Market in the United States Revenue (Million) Forecast, by Application 2020 & 2033
- Table 22: Italy Digital Signage Market in the United States Revenue (Million) Forecast, by Application 2020 & 2033
- Table 23: Spain Digital Signage Market in the United States Revenue (Million) Forecast, by Application 2020 & 2033
- Table 24: Russia Digital Signage Market in the United States Revenue (Million) Forecast, by Application 2020 & 2033
- Table 25: Benelux Digital Signage Market in the United States Revenue (Million) Forecast, by Application 2020 & 2033
- Table 26: Nordics Digital Signage Market in the United States Revenue (Million) Forecast, by Application 2020 & 2033
- Table 27: Rest of Europe Digital Signage Market in the United States Revenue (Million) Forecast, by Application 2020 & 2033
- Table 28: Global Digital Signage Market in the United States Revenue Million Forecast, by Type 2020 & 2033
- Table 29: Global Digital Signage Market in the United States Revenue Million Forecast, by End User 2020 & 2033
- Table 30: Global Digital Signage Market in the United States Revenue Million Forecast, by Country 2020 & 2033
- Table 31: Turkey Digital Signage Market in the United States Revenue (Million) Forecast, by Application 2020 & 2033
- Table 32: Israel Digital Signage Market in the United States Revenue (Million) Forecast, by Application 2020 & 2033
- Table 33: GCC Digital Signage Market in the United States Revenue (Million) Forecast, by Application 2020 & 2033
- Table 34: North Africa Digital Signage Market in the United States Revenue (Million) Forecast, by Application 2020 & 2033
- Table 35: South Africa Digital Signage Market in the United States Revenue (Million) Forecast, by Application 2020 & 2033
- Table 36: Rest of Middle East & Africa Digital Signage Market in the United States Revenue (Million) Forecast, by Application 2020 & 2033
- Table 37: Global Digital Signage Market in the United States Revenue Million Forecast, by Type 2020 & 2033
- Table 38: Global Digital Signage Market in the United States Revenue Million Forecast, by End User 2020 & 2033
- Table 39: Global Digital Signage Market in the United States Revenue Million Forecast, by Country 2020 & 2033
- Table 40: China Digital Signage Market in the United States Revenue (Million) Forecast, by Application 2020 & 2033
- Table 41: India Digital Signage Market in the United States Revenue (Million) Forecast, by Application 2020 & 2033
- Table 42: Japan Digital Signage Market in the United States Revenue (Million) Forecast, by Application 2020 & 2033
- Table 43: South Korea Digital Signage Market in the United States Revenue (Million) Forecast, by Application 2020 & 2033
- Table 44: ASEAN Digital Signage Market in the United States Revenue (Million) Forecast, by Application 2020 & 2033
- Table 45: Oceania Digital Signage Market in the United States Revenue (Million) Forecast, by Application 2020 & 2033
- Table 46: Rest of Asia Pacific Digital Signage Market in the United States Revenue (Million) Forecast, by Application 2020 & 2033
Frequently Asked Questions
1. What is the projected Compound Annual Growth Rate (CAGR) of the Digital Signage Market in the United States?
The projected CAGR is approximately 7.88%.
2. Which companies are prominent players in the Digital Signage Market in the United States?
Key companies in the market include LG Display Co Ltd, Barco NV, Samsung Electronics Co Ltd, Hitachi Ltd, Planar Systems Inc, NEC Display Solutions Ltd, Cisco Systems Inc *List Not Exhaustive, Sharp Corporation, Goodview Electronic Co Ltd, Panasonic Corporation, Sony Corporation.
3. What are the main segments of the Digital Signage Market in the United States?
The market segments include Type, End User.
4. Can you provide details about the market size?
The market size is estimated to be USD 8.49 Million as of 2022.
5. What are some drivers contributing to market growth?
Evolution of Turnkey Solutions; Trends Favoring the Growth of Context-aware Advertising as Opposed to Conventional Modes of Advertising; Steady Increase in DOOH Spending in the United States to Continue to Supplement Market Growth.
6. What are the notable trends driving market growth?
OLED Displays to Grow Significantly.
7. Are there any restraints impacting market growth?
Concerns Over Invasion of Customer Privacy.
8. Can you provide examples of recent developments in the market?
November 2022 - At Electronica, printed e-paper display manufacturer Ynvisible Interactive Inc. introduced its new Digital Signage Solution. The company positions its technology as the least energy-intensive printed e-paper display on the market. Ynvisible continues to decisively direct its activities and resources to hasten the transformation of its organization from one focused on project sales to one based on products. A straightforward big-size e-paper display with digital and alphanumeric capabilities is included in this new, cost-efficient family of devices that is intended for ultra-low power applications.
9. What pricing options are available for accessing the report?
Pricing options include single-user, multi-user, and enterprise licenses priced at USD 3800, USD 4500, and USD 5800 respectively.
10. Is the market size provided in terms of value or volume?
The market size is provided in terms of value, measured in Million.
11. Are there any specific market keywords associated with the report?
Yes, the market keyword associated with the report is "Digital Signage Market in the United States," which aids in identifying and referencing the specific market segment covered.
12. How do I determine which pricing option suits my needs best?
The pricing options vary based on user requirements and access needs. Individual users may opt for single-user licenses, while businesses requiring broader access may choose multi-user or enterprise licenses for cost-effective access to the report.
13. Are there any additional resources or data provided in the Digital Signage Market in the United States report?
While the report offers comprehensive insights, it's advisable to review the specific contents or supplementary materials provided to ascertain if additional resources or data are available.
14. How can I stay updated on further developments or reports in the Digital Signage Market in the United States?
To stay informed about further developments, trends, and reports in the Digital Signage Market in the United States, consider subscribing to industry newsletters, following relevant companies and organizations, or regularly checking reputable industry news sources and publications.
Methodology
Step 1 - Identification of Relevant Samples Size from Population Database


Step 2 - Approaches for Defining Global Market Size (Value, Volume* & Price*)

Note*: In applicable scenarios
Step 3 - Data Sources
Primary Research
- Web Analytics
- Survey Reports
- Research Institute
- Latest Research Reports
- Opinion Leaders
Secondary Research
- Annual Reports
- White Paper
- Latest Press Release
- Industry Association
- Paid Database
- Investor Presentations

Step 4 - Data Triangulation
Involves using different sources of information in order to increase the validity of a study
These sources are likely to be stakeholders in a program - participants, other researchers, program staff, other community members, and so on.
Then we put all data in single framework & apply various statistical tools to find out the dynamic on the market.
During the analysis stage, feedback from the stakeholder groups would be compared to determine areas of agreement as well as areas of divergence