

Key Insights
The Direct Acting Antivirals (DAAs) market is experiencing robust growth, driven by a rising prevalence of viral infections, particularly Hepatitis C and HIV, coupled with advancements in DAA therapies leading to improved efficacy and reduced side effects. The market's expansion is further fueled by increased government funding for research and development, along with supportive healthcare policies promoting early diagnosis and treatment. Major pharmaceutical companies are heavily invested in this sector, leading to a competitive landscape characterized by continuous innovation in drug formulations and delivery mechanisms. While pricing remains a significant factor influencing market accessibility, particularly in developing nations, the long-term outlook remains positive, projecting sustained growth due to the ongoing need for effective antiviral treatments.
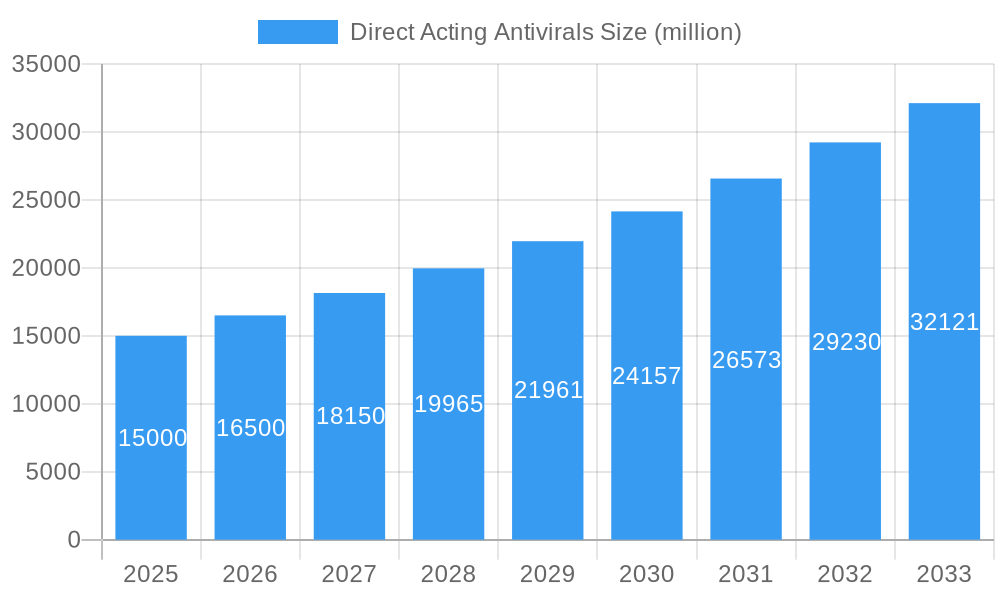
Direct Acting Antivirals Market Size (In Billion)
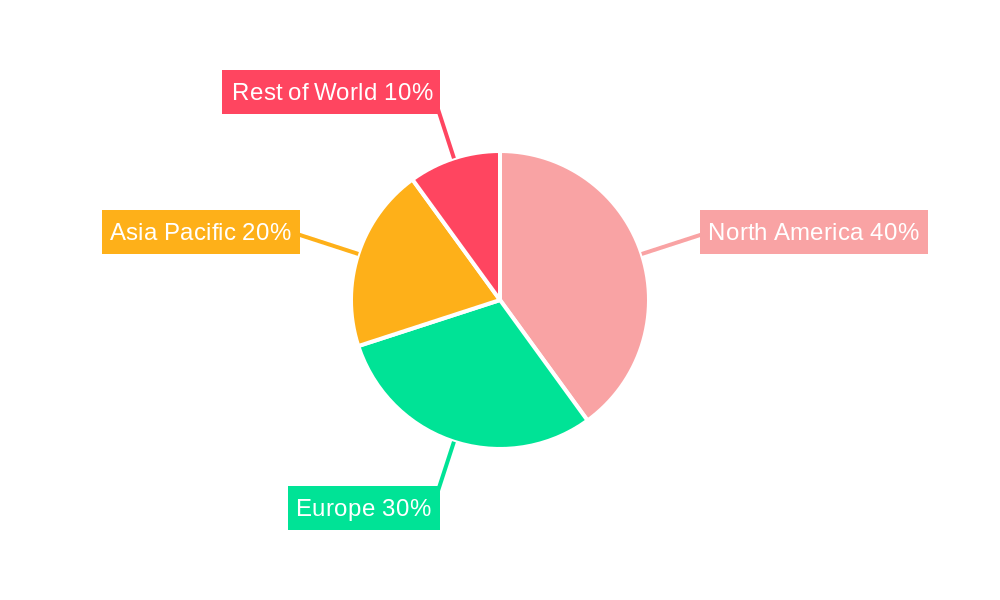
Despite the substantial market size and growth potential, challenges exist. Patent expirations for some key DAA drugs are creating opportunities for generic competition, potentially impacting pricing strategies and market share dynamics. Furthermore, the emergence of drug-resistant viral strains necessitates ongoing research to develop next-generation DAAs capable of overcoming these challenges. The market's segmentation includes various antiviral drug classes targeting specific viruses, with regional variations in market penetration reflecting differences in healthcare infrastructure and disease prevalence. The geographical distribution of market share reveals a strong presence in North America and Europe, driven by robust healthcare systems and high levels of disease awareness, while emerging markets represent significant opportunities for future growth. However, these markets face hurdles related to affordability and access to healthcare. The forecast period indicates a sustained period of growth, albeit at a potentially moderating pace due to the factors mentioned above.
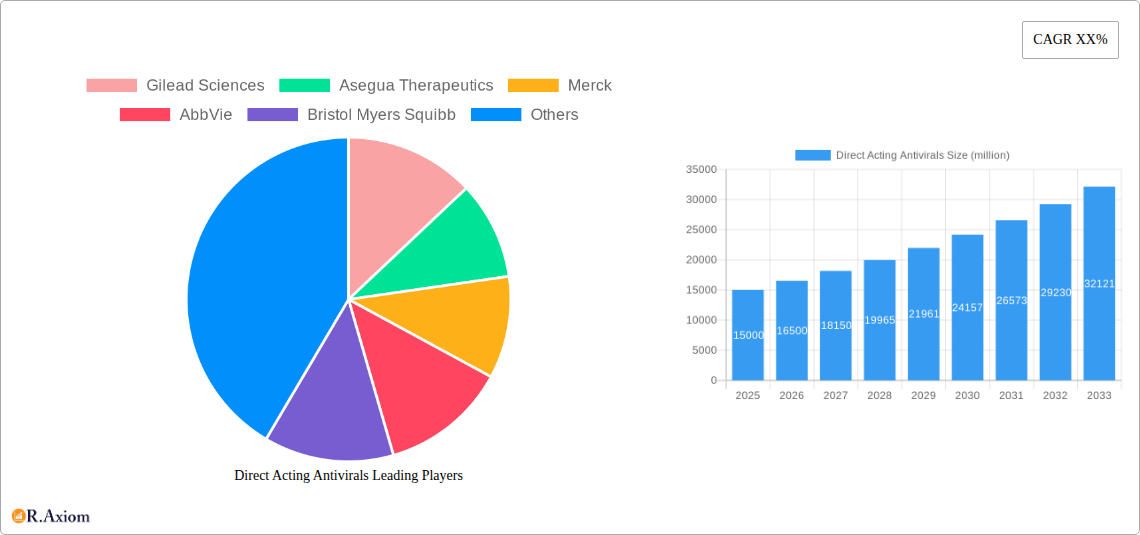
Direct Acting Antivirals Company Market Share
This comprehensive report provides an in-depth analysis of the Direct Acting Antivirals (DAAs) market, offering crucial insights for industry stakeholders, investors, and researchers. The study covers the period from 2019 to 2033, with 2025 serving as the base and estimated year. The report projects a robust market expansion during the forecast period (2025-2033), driven by several factors detailed within. Market values are expressed in millions.
Direct Acting Antivirals Market Concentration & Innovation
This section analyzes the competitive landscape of the DAA market, examining market concentration, innovation drivers, regulatory frameworks, product substitutes, end-user trends, and mergers & acquisitions (M&A) activities.
The market is characterized by a moderate level of concentration, with a few major players holding significant market share. Gilead Sciences, Merck, and AbbVie currently command a combined xx% market share, while other players such as Bristol Myers Squibb and Ascletis Pharma contribute significantly. Smaller players, including Kawin Technology, YiChang HEC ChangJiang Pharmaceutical, Sanhome Pharmaceutical, Chia Tai Tianqing Pharmaceutical, Cosunter Pharmaceutical, and Beijing Sihuan Pharmaceutical, focus on niche segments or specific geographic regions.
Innovation in the DAA market is driven by the need for improved efficacy, reduced side effects, and the development of treatments for resistant viral strains. Regulatory frameworks, such as those set by the FDA and EMA, significantly impact product approvals and market entry. The emergence of biosimilars and generic DAAs poses a competitive threat to incumbent players. End-user trends, including increasing awareness of viral infections and the demand for convenient treatment options, are also shaping market dynamics.
M&A activity has played a considerable role in shaping the market landscape. Over the historical period (2019-2024), total M&A deal value in the DAA market reached approximately $xx million. These activities have been largely driven by the desire to expand product portfolios, access new technologies, and enhance market share.
- Market Share (2025):
- Gilead Sciences: xx%
- Merck: xx%
- AbbVie: xx%
- Others: xx%
- M&A Deal Value (2019-2024): $xx million
Direct Acting Antivirals Industry Trends & Insights
This section delves into the key trends and insights shaping the DAA market, providing a comprehensive overview of market growth drivers, technological disruptions, consumer preferences, and competitive dynamics.
The DAA market is experiencing robust growth, driven by factors such as the increasing prevalence of viral infections globally, rising healthcare expenditure, and advancements in antiviral therapies. The market is expected to witness a Compound Annual Growth Rate (CAGR) of xx% during the forecast period (2025-2033). This growth is further fueled by technological disruptions, including the development of novel DAA molecules with enhanced efficacy and safety profiles. Consumer preferences are shifting towards convenient, once-daily dosage forms with minimal side effects.
The competitive landscape is highly dynamic, with ongoing research and development activities by leading pharmaceutical companies. The market penetration of DAAs varies across different regions and therapeutic areas, with higher penetration rates observed in developed countries compared to emerging markets. Price competition and the entry of generic DAAs are also impacting market dynamics.
Dominant Markets & Segments in Direct Acting Antivirals
This section identifies the leading regions, countries, or segments within the DAA market.
The North American market currently dominates the DAA market, accounting for xx% of global revenue in 2025. This dominance is attributable to several factors:
- High Healthcare Expenditure: The high level of healthcare spending in the US and Canada supports increased adoption of advanced therapies.
- Strong Regulatory Framework: The robust regulatory environment ensures high-quality product development and market access.
- High Prevalence of Viral Infections: A significant population affected by viral infections fuels the demand for effective treatments.
- Robust Research & Development: Extensive research and development efforts by pharmaceutical companies in the region contribute to innovation and product launches.
The European and Asian markets are also experiencing substantial growth, driven by increasing healthcare awareness, improved healthcare infrastructure, and rising disposable incomes. Specific country-level analysis for key markets within these regions is provided in the full report.
Direct Acting Antivirals Product Developments
Recent product innovations focus on improving the efficacy and safety profile of DAAs. The development of pan-genotypic DAAs addressing multiple viral genotypes is a significant advancement, expanding treatment options and reducing the risk of treatment failure. Furthermore, combination therapies and fixed-dose combinations are gaining traction, offering improved patient compliance and convenience. These product advancements are enhancing the market fit and competitive advantages of leading companies.
Report Scope & Segmentation Analysis
This report segments the DAA market based on drug class, route of administration, indication, and geography. The market size and growth projections for each segment are provided in the full report. Competitive dynamics within each segment are also analyzed, including the key players, their market share, and strategic initiatives.
The report provides a granular analysis of segment-specific market size, growth rates, and competitive dynamics across various geographic regions.
Key Drivers of Direct Acting Antivirals Growth
Several factors drive the growth of the DAA market, including:
- Technological Advancements: The development of novel DAAs with improved efficacy and safety profiles.
- Rising Prevalence of Viral Infections: The increasing incidence of viral infections globally is a major driver of market growth.
- Favorable Regulatory Environment: Supportive regulatory policies facilitate product development and market access.
- Increased Healthcare Expenditure: Higher healthcare spending enables greater adoption of advanced antiviral therapies.
Challenges in the Direct Acting Antiviral Sector
The DAA market faces several challenges:
- High Research & Development Costs: The development of novel DAAs is costly, potentially limiting market entry for smaller companies.
- Patent Expiry and Generic Competition: The expiration of patents for existing DAAs will lead to increased generic competition and price erosion.
- Development of Drug Resistance: The emergence of drug-resistant viral strains necessitates continuous innovation and the development of new DAAs. The impact of this is estimated to reduce market growth by approximately xx million by 2033.
Emerging Opportunities in Direct Acting Antivirals
Several emerging opportunities exist within the DAA market:
- Development of DAAs for Emerging Viral Infections: Growing need for treatments for newly emerging viral infections.
- Personalized Medicine: Tailoring DAA treatment to individual patient characteristics to improve efficacy and reduce side effects.
- Expansion into Emerging Markets: Significant untapped potential in developing countries with high prevalence of viral infections.
Leading Players in the Direct Acting Antivirals Market
- Gilead Sciences
- Asegua Therapeutics
- Merck
- AbbVie
- Bristol Myers Squibb
- Ascletis Pharma
- Kawin Technology
- YiChang HEC ChangJiang Pharmaceutical
- Sanhome Pharmaceutical
- Chia Tai Tianqing Pharmaceutical
- Cosunter pharmaceutical
- Beijing Sihuan Pharmaceutical
Key Developments in Direct Acting Antivirals Industry
- 2022 Q4: Gilead Sciences received FDA approval for a new DAA.
- 2023 Q1: Merck announced a major research collaboration to develop next-generation DAAs.
- 2023 Q3: AbbVie launched a new fixed-dose combination DAA.
- (Further developments will be detailed in the full report.)
Strategic Outlook for Direct Acting Antivirals Market
The DAA market is poised for continued growth, driven by ongoing innovation, expanding treatment indications, and penetration into new markets. Significant opportunities exist in personalized medicine, combination therapies, and the development of DAAs for emerging viral infections. Companies focusing on R&D, strategic partnerships, and effective market access strategies are best positioned to capture significant market share and drive future growth.
Direct Acting Antivirals Segmentation
-
1. Application
- 1.1. Hospital and Clinic
- 1.2. Pharmacy
- 1.3. Other
-
2. Types
- 2.1. Pangenotypic
- 2.2. Genotype-Specific
Direct Acting Antivirals Segmentation By Geography
-
1. North America
- 1.1. United States
- 1.2. Canada
- 1.3. Mexico
-
2. South America
- 2.1. Brazil
- 2.2. Argentina
- 2.3. Rest of South America
-
3. Europe
- 3.1. United Kingdom
- 3.2. Germany
- 3.3. France
- 3.4. Italy
- 3.5. Spain
- 3.6. Russia
- 3.7. Benelux
- 3.8. Nordics
- 3.9. Rest of Europe
-
4. Middle East & Africa
- 4.1. Turkey
- 4.2. Israel
- 4.3. GCC
- 4.4. North Africa
- 4.5. South Africa
- 4.6. Rest of Middle East & Africa
-
5. Asia Pacific
- 5.1. China
- 5.2. India
- 5.3. Japan
- 5.4. South Korea
- 5.5. ASEAN
- 5.6. Oceania
- 5.7. Rest of Asia Pacific
Direct Acting Antivirals Regional Market Share
Geographic Coverage of Direct Acting Antivirals
Direct Acting Antivirals REPORT HIGHLIGHTS
| Aspects | Details |
|---|---|
| Study Period | 2020-2034 |
| Base Year | 2025 |
| Estimated Year | 2026 |
| Forecast Period | 2026-2034 |
| Historical Period | 2020-2025 |
| Growth Rate | CAGR of 14.91% from 2020-2034 |
| Segmentation |
|
Table of Contents
- 1. Introduction
- 1.1. Research Scope
- 1.2. Market Segmentation
- 1.3. Research Objective
- 1.4. Definitions and Assumptions
- 2. Executive Summary
- 2.1. Market Snapshot
- 3. Market Dynamics
- 3.1. Market Drivers
- 3.2. Market Restrains
- 3.3. Market Trends
- 3.4. Market Opportunities
- 4. Market Factor Analysis
- 4.1. Porters Five Forces
- 4.1.1. Bargaining Power of Suppliers
- 4.1.2. Bargaining Power of Buyers
- 4.1.3. Threat of New Entrants
- 4.1.4. Threat of Substitutes
- 4.1.5. Competitive Rivalry
- 4.2. PESTEL analysis
- 4.3. BCG Analysis
- 4.3.1. Stars (High Growth, High Market Share)
- 4.3.2. Cash Cows (Low Growth, High Market Share)
- 4.3.3. Question Mark (High Growth, Low Market Share)
- 4.3.4. Dogs (Low Growth, Low Market Share)
- 4.4. Ansoff Matrix Analysis
- 4.5. Supply Chain Analysis
- 4.6. Regulatory Landscape
- 4.7. Current Market Potential and Opportunity Assessment (TAM–SAM–SOM Framework)
- 4.8. RAX Analyst Note
- 4.1. Porters Five Forces
- 5. Market Analysis, Insights and Forecast 2021-2033
- 5.1. Market Analysis, Insights and Forecast - by Application
- 5.1.1. Hospital and Clinic
- 5.1.2. Pharmacy
- 5.1.3. Other
- 5.2. Market Analysis, Insights and Forecast - by Types
- 5.2.1. Pangenotypic
- 5.2.2. Genotype-Specific
- 5.3. Market Analysis, Insights and Forecast - by Region
- 5.3.1. North America
- 5.3.2. South America
- 5.3.3. Europe
- 5.3.4. Middle East & Africa
- 5.3.5. Asia Pacific
- 5.1. Market Analysis, Insights and Forecast - by Application
- 6. Global Direct Acting Antivirals Analysis, Insights and Forecast, 2021-2033
- 6.1. Market Analysis, Insights and Forecast - by Application
- 6.1.1. Hospital and Clinic
- 6.1.2. Pharmacy
- 6.1.3. Other
- 6.2. Market Analysis, Insights and Forecast - by Types
- 6.2.1. Pangenotypic
- 6.2.2. Genotype-Specific
- 6.1. Market Analysis, Insights and Forecast - by Application
- 7. North America Direct Acting Antivirals Analysis, Insights and Forecast, 2020-2032
- 7.1. Market Analysis, Insights and Forecast - by Application
- 7.1.1. Hospital and Clinic
- 7.1.2. Pharmacy
- 7.1.3. Other
- 7.2. Market Analysis, Insights and Forecast - by Types
- 7.2.1. Pangenotypic
- 7.2.2. Genotype-Specific
- 7.1. Market Analysis, Insights and Forecast - by Application
- 8. South America Direct Acting Antivirals Analysis, Insights and Forecast, 2020-2032
- 8.1. Market Analysis, Insights and Forecast - by Application
- 8.1.1. Hospital and Clinic
- 8.1.2. Pharmacy
- 8.1.3. Other
- 8.2. Market Analysis, Insights and Forecast - by Types
- 8.2.1. Pangenotypic
- 8.2.2. Genotype-Specific
- 8.1. Market Analysis, Insights and Forecast - by Application
- 9. Europe Direct Acting Antivirals Analysis, Insights and Forecast, 2020-2032
- 9.1. Market Analysis, Insights and Forecast - by Application
- 9.1.1. Hospital and Clinic
- 9.1.2. Pharmacy
- 9.1.3. Other
- 9.2. Market Analysis, Insights and Forecast - by Types
- 9.2.1. Pangenotypic
- 9.2.2. Genotype-Specific
- 9.1. Market Analysis, Insights and Forecast - by Application
- 10. Middle East & Africa Direct Acting Antivirals Analysis, Insights and Forecast, 2020-2032
- 10.1. Market Analysis, Insights and Forecast - by Application
- 10.1.1. Hospital and Clinic
- 10.1.2. Pharmacy
- 10.1.3. Other
- 10.2. Market Analysis, Insights and Forecast - by Types
- 10.2.1. Pangenotypic
- 10.2.2. Genotype-Specific
- 10.1. Market Analysis, Insights and Forecast - by Application
- 11. Asia Pacific Direct Acting Antivirals Analysis, Insights and Forecast, 2020-2032
- 11.1. Market Analysis, Insights and Forecast - by Application
- 11.1.1. Hospital and Clinic
- 11.1.2. Pharmacy
- 11.1.3. Other
- 11.2. Market Analysis, Insights and Forecast - by Types
- 11.2.1. Pangenotypic
- 11.2.2. Genotype-Specific
- 11.1. Market Analysis, Insights and Forecast - by Application
- 12. Competitive Analysis
- 12.1. Company Profiles
- 12.1.1 Gilead Sciences
- 12.1.1.1. Company Overview
- 12.1.1.2. Products
- 12.1.1.3. Company Financials
- 12.1.1.4. SWOT Analysis
- 12.1.2 Asegua Therapeutics
- 12.1.2.1. Company Overview
- 12.1.2.2. Products
- 12.1.2.3. Company Financials
- 12.1.2.4. SWOT Analysis
- 12.1.3 Merck
- 12.1.3.1. Company Overview
- 12.1.3.2. Products
- 12.1.3.3. Company Financials
- 12.1.3.4. SWOT Analysis
- 12.1.4 AbbVie
- 12.1.4.1. Company Overview
- 12.1.4.2. Products
- 12.1.4.3. Company Financials
- 12.1.4.4. SWOT Analysis
- 12.1.5 Bristol Myers Squibb
- 12.1.5.1. Company Overview
- 12.1.5.2. Products
- 12.1.5.3. Company Financials
- 12.1.5.4. SWOT Analysis
- 12.1.6 Ascletis Pharma
- 12.1.6.1. Company Overview
- 12.1.6.2. Products
- 12.1.6.3. Company Financials
- 12.1.6.4. SWOT Analysis
- 12.1.7 Kawin Technology
- 12.1.7.1. Company Overview
- 12.1.7.2. Products
- 12.1.7.3. Company Financials
- 12.1.7.4. SWOT Analysis
- 12.1.8 YiChang HEC ChangJiang Pharmaceutical
- 12.1.8.1. Company Overview
- 12.1.8.2. Products
- 12.1.8.3. Company Financials
- 12.1.8.4. SWOT Analysis
- 12.1.9 Sanhome Pharmaceutical
- 12.1.9.1. Company Overview
- 12.1.9.2. Products
- 12.1.9.3. Company Financials
- 12.1.9.4. SWOT Analysis
- 12.1.10 Chia Tai Tianqing Pharmaceutical
- 12.1.10.1. Company Overview
- 12.1.10.2. Products
- 12.1.10.3. Company Financials
- 12.1.10.4. SWOT Analysis
- 12.1.11 Cosunter pharmaceutical
- 12.1.11.1. Company Overview
- 12.1.11.2. Products
- 12.1.11.3. Company Financials
- 12.1.11.4. SWOT Analysis
- 12.1.12 Beijing Sihuan Pharmaceutical
- 12.1.12.1. Company Overview
- 12.1.12.2. Products
- 12.1.12.3. Company Financials
- 12.1.12.4. SWOT Analysis
- 12.1.1 Gilead Sciences
- 12.2. Market Entropy
- 12.2.1 Company's Key Areas Served
- 12.2.2 Recent Developments
- 12.3. Company Market Share Analysis 2025
- 12.3.1 Top 5 Companies Market Share Analysis
- 12.3.2 Top 3 Companies Market Share Analysis
- 12.4. List of Potential Customers
- 13. Research Methodology
List of Figures
- Figure 1: Global Direct Acting Antivirals Revenue Breakdown (billion, %) by Region 2025 & 2033
- Figure 2: Global Direct Acting Antivirals Volume Breakdown (K, %) by Region 2025 & 2033
- Figure 3: North America Direct Acting Antivirals Revenue (billion), by Application 2025 & 2033
- Figure 4: North America Direct Acting Antivirals Volume (K), by Application 2025 & 2033
- Figure 5: North America Direct Acting Antivirals Revenue Share (%), by Application 2025 & 2033
- Figure 6: North America Direct Acting Antivirals Volume Share (%), by Application 2025 & 2033
- Figure 7: North America Direct Acting Antivirals Revenue (billion), by Types 2025 & 2033
- Figure 8: North America Direct Acting Antivirals Volume (K), by Types 2025 & 2033
- Figure 9: North America Direct Acting Antivirals Revenue Share (%), by Types 2025 & 2033
- Figure 10: North America Direct Acting Antivirals Volume Share (%), by Types 2025 & 2033
- Figure 11: North America Direct Acting Antivirals Revenue (billion), by Country 2025 & 2033
- Figure 12: North America Direct Acting Antivirals Volume (K), by Country 2025 & 2033
- Figure 13: North America Direct Acting Antivirals Revenue Share (%), by Country 2025 & 2033
- Figure 14: North America Direct Acting Antivirals Volume Share (%), by Country 2025 & 2033
- Figure 15: South America Direct Acting Antivirals Revenue (billion), by Application 2025 & 2033
- Figure 16: South America Direct Acting Antivirals Volume (K), by Application 2025 & 2033
- Figure 17: South America Direct Acting Antivirals Revenue Share (%), by Application 2025 & 2033
- Figure 18: South America Direct Acting Antivirals Volume Share (%), by Application 2025 & 2033
- Figure 19: South America Direct Acting Antivirals Revenue (billion), by Types 2025 & 2033
- Figure 20: South America Direct Acting Antivirals Volume (K), by Types 2025 & 2033
- Figure 21: South America Direct Acting Antivirals Revenue Share (%), by Types 2025 & 2033
- Figure 22: South America Direct Acting Antivirals Volume Share (%), by Types 2025 & 2033
- Figure 23: South America Direct Acting Antivirals Revenue (billion), by Country 2025 & 2033
- Figure 24: South America Direct Acting Antivirals Volume (K), by Country 2025 & 2033
- Figure 25: South America Direct Acting Antivirals Revenue Share (%), by Country 2025 & 2033
- Figure 26: South America Direct Acting Antivirals Volume Share (%), by Country 2025 & 2033
- Figure 27: Europe Direct Acting Antivirals Revenue (billion), by Application 2025 & 2033
- Figure 28: Europe Direct Acting Antivirals Volume (K), by Application 2025 & 2033
- Figure 29: Europe Direct Acting Antivirals Revenue Share (%), by Application 2025 & 2033
- Figure 30: Europe Direct Acting Antivirals Volume Share (%), by Application 2025 & 2033
- Figure 31: Europe Direct Acting Antivirals Revenue (billion), by Types 2025 & 2033
- Figure 32: Europe Direct Acting Antivirals Volume (K), by Types 2025 & 2033
- Figure 33: Europe Direct Acting Antivirals Revenue Share (%), by Types 2025 & 2033
- Figure 34: Europe Direct Acting Antivirals Volume Share (%), by Types 2025 & 2033
- Figure 35: Europe Direct Acting Antivirals Revenue (billion), by Country 2025 & 2033
- Figure 36: Europe Direct Acting Antivirals Volume (K), by Country 2025 & 2033
- Figure 37: Europe Direct Acting Antivirals Revenue Share (%), by Country 2025 & 2033
- Figure 38: Europe Direct Acting Antivirals Volume Share (%), by Country 2025 & 2033
- Figure 39: Middle East & Africa Direct Acting Antivirals Revenue (billion), by Application 2025 & 2033
- Figure 40: Middle East & Africa Direct Acting Antivirals Volume (K), by Application 2025 & 2033
- Figure 41: Middle East & Africa Direct Acting Antivirals Revenue Share (%), by Application 2025 & 2033
- Figure 42: Middle East & Africa Direct Acting Antivirals Volume Share (%), by Application 2025 & 2033
- Figure 43: Middle East & Africa Direct Acting Antivirals Revenue (billion), by Types 2025 & 2033
- Figure 44: Middle East & Africa Direct Acting Antivirals Volume (K), by Types 2025 & 2033
- Figure 45: Middle East & Africa Direct Acting Antivirals Revenue Share (%), by Types 2025 & 2033
- Figure 46: Middle East & Africa Direct Acting Antivirals Volume Share (%), by Types 2025 & 2033
- Figure 47: Middle East & Africa Direct Acting Antivirals Revenue (billion), by Country 2025 & 2033
- Figure 48: Middle East & Africa Direct Acting Antivirals Volume (K), by Country 2025 & 2033
- Figure 49: Middle East & Africa Direct Acting Antivirals Revenue Share (%), by Country 2025 & 2033
- Figure 50: Middle East & Africa Direct Acting Antivirals Volume Share (%), by Country 2025 & 2033
- Figure 51: Asia Pacific Direct Acting Antivirals Revenue (billion), by Application 2025 & 2033
- Figure 52: Asia Pacific Direct Acting Antivirals Volume (K), by Application 2025 & 2033
- Figure 53: Asia Pacific Direct Acting Antivirals Revenue Share (%), by Application 2025 & 2033
- Figure 54: Asia Pacific Direct Acting Antivirals Volume Share (%), by Application 2025 & 2033
- Figure 55: Asia Pacific Direct Acting Antivirals Revenue (billion), by Types 2025 & 2033
- Figure 56: Asia Pacific Direct Acting Antivirals Volume (K), by Types 2025 & 2033
- Figure 57: Asia Pacific Direct Acting Antivirals Revenue Share (%), by Types 2025 & 2033
- Figure 58: Asia Pacific Direct Acting Antivirals Volume Share (%), by Types 2025 & 2033
- Figure 59: Asia Pacific Direct Acting Antivirals Revenue (billion), by Country 2025 & 2033
- Figure 60: Asia Pacific Direct Acting Antivirals Volume (K), by Country 2025 & 2033
- Figure 61: Asia Pacific Direct Acting Antivirals Revenue Share (%), by Country 2025 & 2033
- Figure 62: Asia Pacific Direct Acting Antivirals Volume Share (%), by Country 2025 & 2033
List of Tables
- Table 1: Global Direct Acting Antivirals Revenue billion Forecast, by Application 2020 & 2033
- Table 2: Global Direct Acting Antivirals Volume K Forecast, by Application 2020 & 2033
- Table 3: Global Direct Acting Antivirals Revenue billion Forecast, by Types 2020 & 2033
- Table 4: Global Direct Acting Antivirals Volume K Forecast, by Types 2020 & 2033
- Table 5: Global Direct Acting Antivirals Revenue billion Forecast, by Region 2020 & 2033
- Table 6: Global Direct Acting Antivirals Volume K Forecast, by Region 2020 & 2033
- Table 7: Global Direct Acting Antivirals Revenue billion Forecast, by Application 2020 & 2033
- Table 8: Global Direct Acting Antivirals Volume K Forecast, by Application 2020 & 2033
- Table 9: Global Direct Acting Antivirals Revenue billion Forecast, by Types 2020 & 2033
- Table 10: Global Direct Acting Antivirals Volume K Forecast, by Types 2020 & 2033
- Table 11: Global Direct Acting Antivirals Revenue billion Forecast, by Country 2020 & 2033
- Table 12: Global Direct Acting Antivirals Volume K Forecast, by Country 2020 & 2033
- Table 13: United States Direct Acting Antivirals Revenue (billion) Forecast, by Application 2020 & 2033
- Table 14: United States Direct Acting Antivirals Volume (K) Forecast, by Application 2020 & 2033
- Table 15: Canada Direct Acting Antivirals Revenue (billion) Forecast, by Application 2020 & 2033
- Table 16: Canada Direct Acting Antivirals Volume (K) Forecast, by Application 2020 & 2033
- Table 17: Mexico Direct Acting Antivirals Revenue (billion) Forecast, by Application 2020 & 2033
- Table 18: Mexico Direct Acting Antivirals Volume (K) Forecast, by Application 2020 & 2033
- Table 19: Global Direct Acting Antivirals Revenue billion Forecast, by Application 2020 & 2033
- Table 20: Global Direct Acting Antivirals Volume K Forecast, by Application 2020 & 2033
- Table 21: Global Direct Acting Antivirals Revenue billion Forecast, by Types 2020 & 2033
- Table 22: Global Direct Acting Antivirals Volume K Forecast, by Types 2020 & 2033
- Table 23: Global Direct Acting Antivirals Revenue billion Forecast, by Country 2020 & 2033
- Table 24: Global Direct Acting Antivirals Volume K Forecast, by Country 2020 & 2033
- Table 25: Brazil Direct Acting Antivirals Revenue (billion) Forecast, by Application 2020 & 2033
- Table 26: Brazil Direct Acting Antivirals Volume (K) Forecast, by Application 2020 & 2033
- Table 27: Argentina Direct Acting Antivirals Revenue (billion) Forecast, by Application 2020 & 2033
- Table 28: Argentina Direct Acting Antivirals Volume (K) Forecast, by Application 2020 & 2033
- Table 29: Rest of South America Direct Acting Antivirals Revenue (billion) Forecast, by Application 2020 & 2033
- Table 30: Rest of South America Direct Acting Antivirals Volume (K) Forecast, by Application 2020 & 2033
- Table 31: Global Direct Acting Antivirals Revenue billion Forecast, by Application 2020 & 2033
- Table 32: Global Direct Acting Antivirals Volume K Forecast, by Application 2020 & 2033
- Table 33: Global Direct Acting Antivirals Revenue billion Forecast, by Types 2020 & 2033
- Table 34: Global Direct Acting Antivirals Volume K Forecast, by Types 2020 & 2033
- Table 35: Global Direct Acting Antivirals Revenue billion Forecast, by Country 2020 & 2033
- Table 36: Global Direct Acting Antivirals Volume K Forecast, by Country 2020 & 2033
- Table 37: United Kingdom Direct Acting Antivirals Revenue (billion) Forecast, by Application 2020 & 2033
- Table 38: United Kingdom Direct Acting Antivirals Volume (K) Forecast, by Application 2020 & 2033
- Table 39: Germany Direct Acting Antivirals Revenue (billion) Forecast, by Application 2020 & 2033
- Table 40: Germany Direct Acting Antivirals Volume (K) Forecast, by Application 2020 & 2033
- Table 41: France Direct Acting Antivirals Revenue (billion) Forecast, by Application 2020 & 2033
- Table 42: France Direct Acting Antivirals Volume (K) Forecast, by Application 2020 & 2033
- Table 43: Italy Direct Acting Antivirals Revenue (billion) Forecast, by Application 2020 & 2033
- Table 44: Italy Direct Acting Antivirals Volume (K) Forecast, by Application 2020 & 2033
- Table 45: Spain Direct Acting Antivirals Revenue (billion) Forecast, by Application 2020 & 2033
- Table 46: Spain Direct Acting Antivirals Volume (K) Forecast, by Application 2020 & 2033
- Table 47: Russia Direct Acting Antivirals Revenue (billion) Forecast, by Application 2020 & 2033
- Table 48: Russia Direct Acting Antivirals Volume (K) Forecast, by Application 2020 & 2033
- Table 49: Benelux Direct Acting Antivirals Revenue (billion) Forecast, by Application 2020 & 2033
- Table 50: Benelux Direct Acting Antivirals Volume (K) Forecast, by Application 2020 & 2033
- Table 51: Nordics Direct Acting Antivirals Revenue (billion) Forecast, by Application 2020 & 2033
- Table 52: Nordics Direct Acting Antivirals Volume (K) Forecast, by Application 2020 & 2033
- Table 53: Rest of Europe Direct Acting Antivirals Revenue (billion) Forecast, by Application 2020 & 2033
- Table 54: Rest of Europe Direct Acting Antivirals Volume (K) Forecast, by Application 2020 & 2033
- Table 55: Global Direct Acting Antivirals Revenue billion Forecast, by Application 2020 & 2033
- Table 56: Global Direct Acting Antivirals Volume K Forecast, by Application 2020 & 2033
- Table 57: Global Direct Acting Antivirals Revenue billion Forecast, by Types 2020 & 2033
- Table 58: Global Direct Acting Antivirals Volume K Forecast, by Types 2020 & 2033
- Table 59: Global Direct Acting Antivirals Revenue billion Forecast, by Country 2020 & 2033
- Table 60: Global Direct Acting Antivirals Volume K Forecast, by Country 2020 & 2033
- Table 61: Turkey Direct Acting Antivirals Revenue (billion) Forecast, by Application 2020 & 2033
- Table 62: Turkey Direct Acting Antivirals Volume (K) Forecast, by Application 2020 & 2033
- Table 63: Israel Direct Acting Antivirals Revenue (billion) Forecast, by Application 2020 & 2033
- Table 64: Israel Direct Acting Antivirals Volume (K) Forecast, by Application 2020 & 2033
- Table 65: GCC Direct Acting Antivirals Revenue (billion) Forecast, by Application 2020 & 2033
- Table 66: GCC Direct Acting Antivirals Volume (K) Forecast, by Application 2020 & 2033
- Table 67: North Africa Direct Acting Antivirals Revenue (billion) Forecast, by Application 2020 & 2033
- Table 68: North Africa Direct Acting Antivirals Volume (K) Forecast, by Application 2020 & 2033
- Table 69: South Africa Direct Acting Antivirals Revenue (billion) Forecast, by Application 2020 & 2033
- Table 70: South Africa Direct Acting Antivirals Volume (K) Forecast, by Application 2020 & 2033
- Table 71: Rest of Middle East & Africa Direct Acting Antivirals Revenue (billion) Forecast, by Application 2020 & 2033
- Table 72: Rest of Middle East & Africa Direct Acting Antivirals Volume (K) Forecast, by Application 2020 & 2033
- Table 73: Global Direct Acting Antivirals Revenue billion Forecast, by Application 2020 & 2033
- Table 74: Global Direct Acting Antivirals Volume K Forecast, by Application 2020 & 2033
- Table 75: Global Direct Acting Antivirals Revenue billion Forecast, by Types 2020 & 2033
- Table 76: Global Direct Acting Antivirals Volume K Forecast, by Types 2020 & 2033
- Table 77: Global Direct Acting Antivirals Revenue billion Forecast, by Country 2020 & 2033
- Table 78: Global Direct Acting Antivirals Volume K Forecast, by Country 2020 & 2033
- Table 79: China Direct Acting Antivirals Revenue (billion) Forecast, by Application 2020 & 2033
- Table 80: China Direct Acting Antivirals Volume (K) Forecast, by Application 2020 & 2033
- Table 81: India Direct Acting Antivirals Revenue (billion) Forecast, by Application 2020 & 2033
- Table 82: India Direct Acting Antivirals Volume (K) Forecast, by Application 2020 & 2033
- Table 83: Japan Direct Acting Antivirals Revenue (billion) Forecast, by Application 2020 & 2033
- Table 84: Japan Direct Acting Antivirals Volume (K) Forecast, by Application 2020 & 2033
- Table 85: South Korea Direct Acting Antivirals Revenue (billion) Forecast, by Application 2020 & 2033
- Table 86: South Korea Direct Acting Antivirals Volume (K) Forecast, by Application 2020 & 2033
- Table 87: ASEAN Direct Acting Antivirals Revenue (billion) Forecast, by Application 2020 & 2033
- Table 88: ASEAN Direct Acting Antivirals Volume (K) Forecast, by Application 2020 & 2033
- Table 89: Oceania Direct Acting Antivirals Revenue (billion) Forecast, by Application 2020 & 2033
- Table 90: Oceania Direct Acting Antivirals Volume (K) Forecast, by Application 2020 & 2033
- Table 91: Rest of Asia Pacific Direct Acting Antivirals Revenue (billion) Forecast, by Application 2020 & 2033
- Table 92: Rest of Asia Pacific Direct Acting Antivirals Volume (K) Forecast, by Application 2020 & 2033
Frequently Asked Questions
1. What is the projected Compound Annual Growth Rate (CAGR) of the Direct Acting Antivirals?
The projected CAGR is approximately 14.91%.
2. Which companies are prominent players in the Direct Acting Antivirals?
Key companies in the market include Gilead Sciences, Asegua Therapeutics, Merck, AbbVie, Bristol Myers Squibb, Ascletis Pharma, Kawin Technology, YiChang HEC ChangJiang Pharmaceutical, Sanhome Pharmaceutical, Chia Tai Tianqing Pharmaceutical, Cosunter pharmaceutical, Beijing Sihuan Pharmaceutical.
3. What are the main segments of the Direct Acting Antivirals?
The market segments include Application, Types.
4. Can you provide details about the market size?
The market size is estimated to be USD 7.7 billion as of 2022.
5. What are some drivers contributing to market growth?
N/A
6. What are the notable trends driving market growth?
N/A
7. Are there any restraints impacting market growth?
N/A
8. Can you provide examples of recent developments in the market?
N/A
9. What pricing options are available for accessing the report?
Pricing options include single-user, multi-user, and enterprise licenses priced at USD 3950.00, USD 5925.00, and USD 7900.00 respectively.
10. Is the market size provided in terms of value or volume?
The market size is provided in terms of value, measured in billion and volume, measured in K.
11. Are there any specific market keywords associated with the report?
Yes, the market keyword associated with the report is "Direct Acting Antivirals," which aids in identifying and referencing the specific market segment covered.
12. How do I determine which pricing option suits my needs best?
The pricing options vary based on user requirements and access needs. Individual users may opt for single-user licenses, while businesses requiring broader access may choose multi-user or enterprise licenses for cost-effective access to the report.
13. Are there any additional resources or data provided in the Direct Acting Antivirals report?
While the report offers comprehensive insights, it's advisable to review the specific contents or supplementary materials provided to ascertain if additional resources or data are available.
14. How can I stay updated on further developments or reports in the Direct Acting Antivirals?
To stay informed about further developments, trends, and reports in the Direct Acting Antivirals, consider subscribing to industry newsletters, following relevant companies and organizations, or regularly checking reputable industry news sources and publications.
Methodology
Step 1 - Identification of Relevant Samples Size from Population Database


Step 2 - Approaches for Defining Global Market Size (Value, Volume* & Price*)

Note*: In applicable scenarios
Step 3 - Data Sources
Primary Research
- Web Analytics
- Survey Reports
- Research Institute
- Latest Research Reports
- Opinion Leaders
Secondary Research
- Annual Reports
- White Paper
- Latest Press Release
- Industry Association
- Paid Database
- Investor Presentations

Step 4 - Data Triangulation
Involves using different sources of information in order to increase the validity of a study
These sources are likely to be stakeholders in a program - participants, other researchers, program staff, other community members, and so on.
Then we put all data in single framework & apply various statistical tools to find out the dynamic on the market.
During the analysis stage, feedback from the stakeholder groups would be compared to determine areas of agreement as well as areas of divergence