
Key Insights
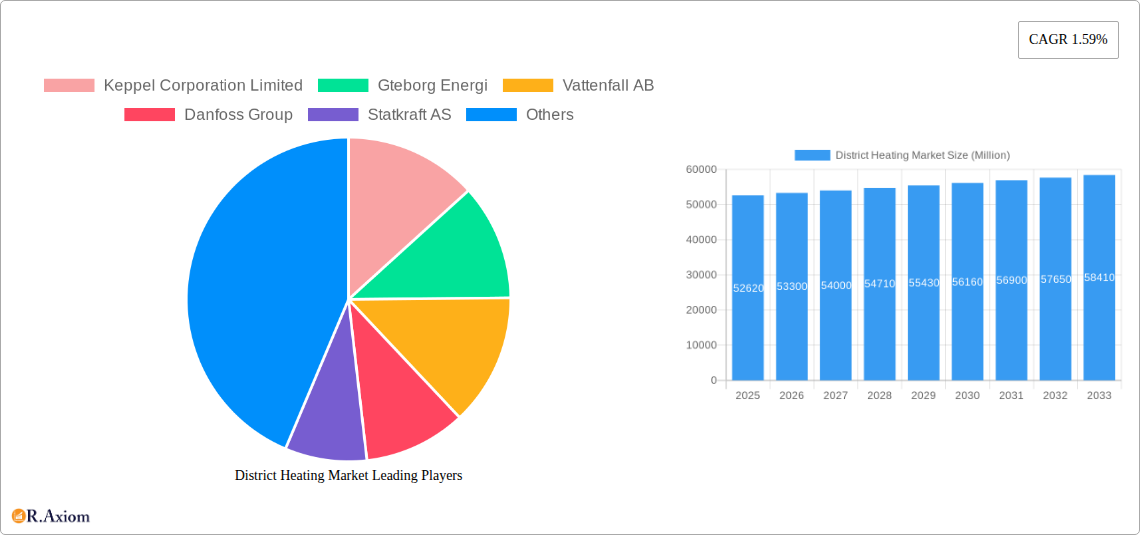
The district heating market, valued at $52.62 billion in 2025, is projected to experience steady growth, driven by increasing urbanization, stringent environmental regulations aimed at reducing carbon emissions, and the rising demand for reliable and efficient heating solutions in residential, commercial, and industrial sectors. The market's Compound Annual Growth Rate (CAGR) of 1.59% from 2025 to 2033 indicates a consistent expansion, although the pace suggests a mature market with established players. Key growth drivers include government incentives promoting renewable energy integration within district heating systems, the increasing adoption of combined heat and power (CHP) plants for enhanced energy efficiency, and technological advancements improving the overall performance and sustainability of district heating networks. While the market faces some restraints, such as high initial investment costs associated with infrastructure development and potential disruptions from fluctuating energy prices, the long-term benefits of reduced emissions and improved energy security outweigh these challenges, fostering continued market expansion. The segmental breakdown, encompassing residential, commercial, industrial applications and various heat sources (coal, natural gas, renewables, oil), shows diversity, with renewable energy sources projected to gain a larger share over the forecast period due to sustainability concerns and policy support.
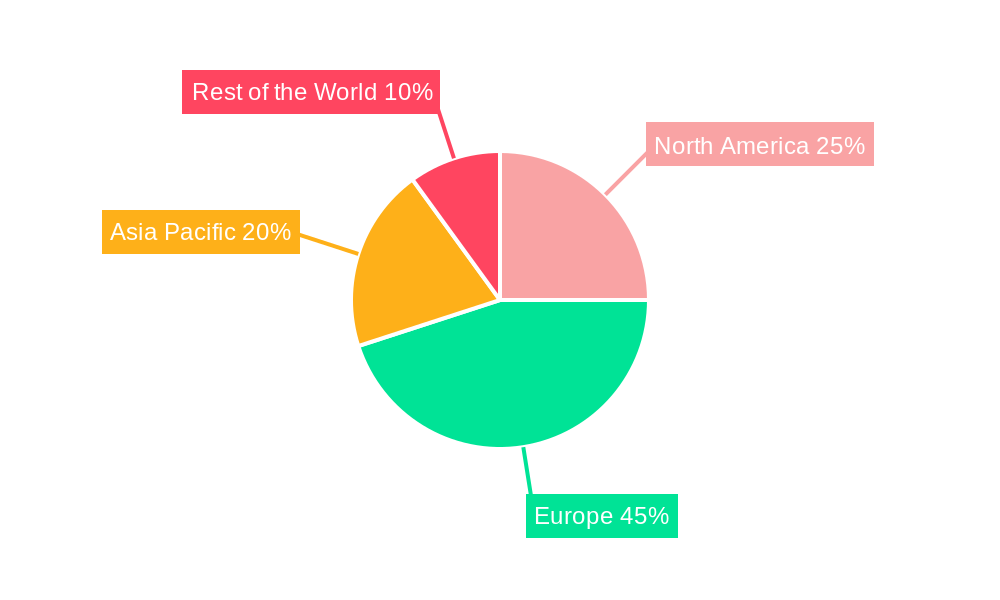
Significant regional variations are expected. Europe, with its established district heating infrastructure and ambitious climate targets, is likely to remain a dominant market. However, North America and Asia-Pacific are also expected to witness substantial growth, driven by increasing energy demand and investments in sustainable infrastructure. Key players like Keppel Corporation, Vattenfall AB, and Danfoss are strategically positioned to capitalize on these trends through technological innovation, strategic partnerships, and expansion into new markets. The market's future trajectory hinges on continued governmental support for renewable energy integration, technological advancements in energy storage and smart grid technologies, and the successful implementation of sustainable urban development initiatives. The next decade will see a focus on optimizing existing systems, expanding network reach, and integrating innovative solutions to further enhance efficiency and reduce environmental impact.
District Heating Market: A Comprehensive Report (2019-2033)
This in-depth report provides a comprehensive analysis of the District Heating Market, covering market size, segmentation, growth drivers, challenges, key players, and future outlook. The study period spans from 2019 to 2033, with 2025 as the base and estimated year. The report offers actionable insights for industry stakeholders, investors, and businesses seeking to understand and capitalize on the opportunities within this dynamic market.
District Heating Market Concentration & Innovation
This section analyzes the competitive landscape of the district heating market, exploring market concentration, innovation drivers, regulatory frameworks, product substitutes, end-user trends, and mergers & acquisitions (M&A) activities. The market is characterized by a mix of large multinational corporations and smaller regional players. Market share is concentrated amongst the top 10 players, accounting for approximately xx% of the total market revenue in 2024. However, increased innovation and technological advancements are driving the entry of new players.
- Market Concentration: The top five players—Keppel Corporation Limited, Göteborg Energi, Vattenfall AB, Danfoss Group, and Statkraft AS—hold a significant market share, with xx% collectively.
- Innovation Drivers: The increasing focus on renewable energy sources and energy efficiency is driving innovation in district heating technologies, including the development of smart grids and advanced heat pumps.
- Regulatory Frameworks: Government policies and regulations promoting renewable energy and carbon reduction significantly influence market growth. Stringent emission standards are accelerating the adoption of cleaner heating solutions.
- Product Substitutes: Competition exists from individual building heating systems, although district heating offers significant advantages in terms of efficiency and sustainability.
- End-User Trends: The growing demand for sustainable and reliable energy sources from residential, commercial, and industrial sectors fuels market expansion.
- M&A Activities: The sector has witnessed considerable M&A activity in recent years, with deal values exceeding xx Million in the past five years. These activities are driven by the desire to expand market share and access new technologies. For example, ENGIE's acquisition of a 6 GW portfolio of solar and battery storage projects in 2022 demonstrates the strategic focus on integrating renewable energy sources.
District Heating Market Industry Trends & Insights
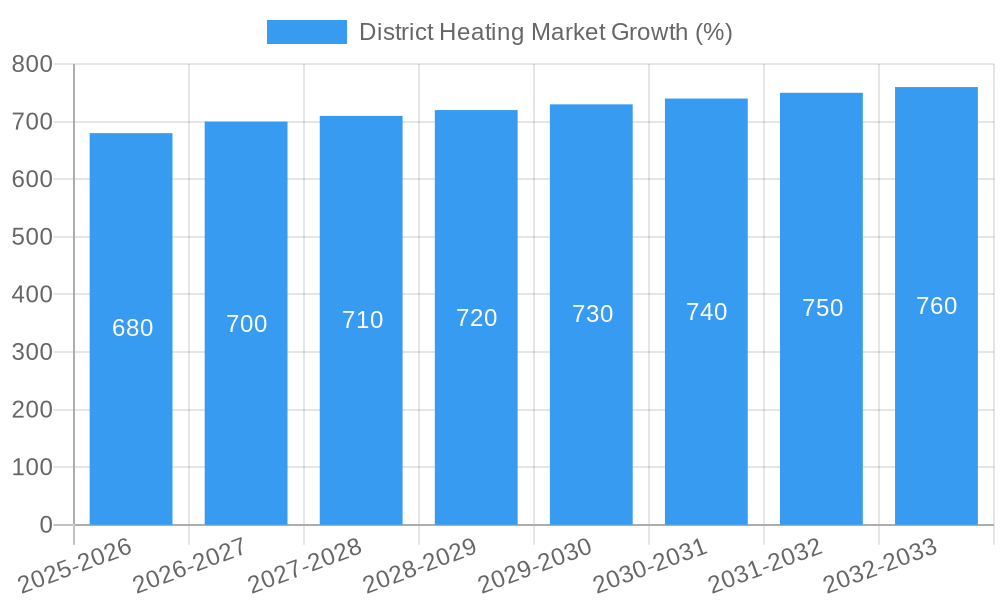
The district heating market is experiencing significant growth, driven by several factors. The global market size is estimated at xx Million in 2025 and is projected to reach xx Million by 2033, exhibiting a CAGR of xx% during the forecast period (2025-2033). This growth is fueled by increasing urbanization, rising energy demand, growing environmental concerns, and government support for renewable energy initiatives. Technological advancements such as smart grids and heat pumps are further enhancing efficiency and sustainability. Consumer preferences are shifting towards cleaner and more sustainable heating solutions, driving adoption rates. Competitive dynamics are shaped by technological innovation, M&A activity, and the increasing participation of renewable energy companies. Market penetration of district heating systems varies significantly across regions, with higher adoption rates in countries with established infrastructure and supportive policies.
Dominant Markets & Segments in District Heating Market
The district heating market displays regional variations in dominance, with Europe holding a leading position. Within Europe, countries like Sweden and Denmark have a high penetration rate due to existing infrastructure and supportive policies. Asia-Pacific is another significant market witnessing rapid growth, driven by expanding urban populations and infrastructure development. The residential segment is the largest application area, followed by commercial and industrial sectors. CHP plants are gaining popularity due to their efficiency and environmental benefits. Natural gas is the dominant heat source, but there's a clear trend toward increased adoption of renewables, aligning with global sustainability goals.
- Key Drivers:
- Europe: Strong government support, established infrastructure, high energy costs.
- Asia-Pacific: Rapid urbanization, industrialization, government initiatives promoting renewable energy.
- Residential Segment: Large consumer base, rising awareness of energy efficiency and sustainability.
- CHP Plants: High efficiency, reduced emissions, cost-effectiveness in long-term operation.
- Renewable Heat Sources: Growing environmental concerns, government incentives and subsidies, cost reductions in renewable technology.
District Heating Market Product Developments
Significant product innovations are transforming the district heating sector. Advancements in heat pump technology are improving energy efficiency and reducing reliance on fossil fuels. Smart grid technologies enable better management of energy distribution and optimization of resource utilization. The integration of renewable energy sources, such as solar and geothermal, is enhancing sustainability and reducing the carbon footprint. These innovations are improving the overall market fit by catering to the increasing demand for efficient and sustainable heating solutions. The Danfoss Group's expansion of its Micro Plate Heat Exchanger range illustrates the ongoing technological improvements in the sector.
Report Scope & Segmentation Analysis
This report segments the district heating market by application (Residential, Commercial, Industrial), plant type (Boiler, Combined Heat and Power (CHP)), and heat source (Coal, Natural Gas, Renewables, Oil and Petroleum Products). Each segment's growth projections, market sizes, and competitive dynamics are thoroughly analyzed. The residential segment exhibits steady growth driven by increasing urbanization and energy efficiency concerns. The commercial and industrial segments present significant growth opportunities due to increasing energy demand. Boiler systems dominate the plant type segment, but CHP plants are rapidly gaining popularity due to their enhanced efficiency. Natural gas currently holds the largest share in heat sources, yet renewables are experiencing rapid growth, driven by policy support and cost reductions.
Key Drivers of District Heating Market Growth
Several factors are driving the growth of the district heating market. These include rising energy costs, stringent environmental regulations promoting renewable energy sources, government incentives and subsidies, technological advancements in heat pump and smart grid technologies, and increasing awareness of energy efficiency and sustainability. The shift towards decarbonization in the heating sector is further accelerating market growth.
Challenges in the District Heating Market Sector
The district heating market faces several challenges, including high initial infrastructure investment costs, potential grid instability issues, dependence on fossil fuels in some regions, regulatory hurdles, and competition from individual building heating systems. Supply chain disruptions, particularly impacting crucial components like heat exchangers, can also cause significant delays and cost increases. The impact of these challenges can vary widely based on geographic location and specific market conditions.
Emerging Opportunities in District Heating Market
Emerging opportunities are abundant in the district heating market. The integration of renewable energy sources presents significant growth potential. Expansion into underserved markets, particularly in developing countries undergoing rapid urbanization, offers substantial untapped opportunities. The development and adoption of smart grid technologies promise enhanced efficiency and optimization of resources. Further innovation in heat pump technology, specifically for low-temperature heat sources, is poised to drive market expansion.
Leading Players in the District Heating Market
- Keppel Corporation Limited
- Göteborg Energi
- Vattenfall AB
- Danfoss Group
- Statkraft AS
- Logstor AS
- Engie
- Ramboll Group AS
- SP Group
- NRG Energy Inc
- Shinryo Corporation
- Vital Energi Ltd
- FVB Energy
- Alfa Laval AB
Key Developments in District Heating Market Industry
- October 2022: ENGIE announced the acquisition of a 6 GW portfolio of solar and battery storage projects, signifying a significant move towards integrating renewable energy sources into district heating systems. This strengthens ENGIE's position and highlights the industry trend towards incorporating renewables.
- April 2023: Danfoss Group launched new options for OEMs with its expanded Z-design range of Micro Plate Heat Exchangers, showcasing continued technological advancements in heat transfer technology, enhancing efficiency and reliability within the industry.
Strategic Outlook for District Heating Market
The district heating market is poised for sustained growth, driven by increasing energy demand, environmental concerns, and government support for renewable energy. The integration of renewable energy sources, coupled with technological advancements in heat pump and smart grid technologies, will continue to shape market dynamics. Expanding into new markets and focusing on innovative solutions will be crucial for companies seeking to capitalize on the substantial growth opportunities within this dynamic sector.
District Heating Market Segmentation
-
1. Plant Type
- 1.1. Boiler
- 1.2. Combined Heat and Power (CHP)
-
2. Heat Source
- 2.1. Coal
- 2.2. Natural Gas
- 2.3. Renewables
- 2.4. Oil and Petroleum Products
-
3. Application
- 3.1. Residential
- 3.2. Commercial and Industrial
District Heating Market Segmentation By Geography
- 1. North America
- 2. Europe
- 3. Asia
- 4. Australia and New Zealand
- 5. Latin America
- 6. Middle East and Africa
District Heating Market REPORT HIGHLIGHTS
| Aspects | Details |
|---|---|
| Study Period | 2019-2033 |
| Base Year | 2024 |
| Estimated Year | 2025 |
| Forecast Period | 2025-2033 |
| Historical Period | 2019-2024 |
| Growth Rate | CAGR of 1.59% from 2019-2033 |
| Segmentation |
|
Table of Contents
- 1. Introduction
- 1.1. Research Scope
- 1.2. Market Segmentation
- 1.3. Research Methodology
- 1.4. Definitions and Assumptions
- 2. Executive Summary
- 2.1. Introduction
- 3. Market Dynamics
- 3.1. Introduction
- 3.2. Market Drivers
- 3.2.1. Augmented Demand for Energy-efficient and Cost-effective Heating Systems; Rising Urbanization and Industrialization
- 3.3. Market Restrains
- 3.3.1. High Infrastructure Cost
- 3.4. Market Trends
- 3.4.1. Residential to Witness the Growth
- 4. Market Factor Analysis
- 4.1. Porters Five Forces
- 4.2. Supply/Value Chain
- 4.3. PESTEL analysis
- 4.4. Market Entropy
- 4.5. Patent/Trademark Analysis
- 5. Global District Heating Market Analysis, Insights and Forecast, 2019-2031
- 5.1. Market Analysis, Insights and Forecast - by Plant Type
- 5.1.1. Boiler
- 5.1.2. Combined Heat and Power (CHP)
- 5.2. Market Analysis, Insights and Forecast - by Heat Source
- 5.2.1. Coal
- 5.2.2. Natural Gas
- 5.2.3. Renewables
- 5.2.4. Oil and Petroleum Products
- 5.3. Market Analysis, Insights and Forecast - by Application
- 5.3.1. Residential
- 5.3.2. Commercial and Industrial
- 5.4. Market Analysis, Insights and Forecast - by Region
- 5.4.1. North America
- 5.4.2. Europe
- 5.4.3. Asia
- 5.4.4. Australia and New Zealand
- 5.4.5. Latin America
- 5.4.6. Middle East and Africa
- 5.1. Market Analysis, Insights and Forecast - by Plant Type
- 6. North America District Heating Market Analysis, Insights and Forecast, 2019-2031
- 6.1. Market Analysis, Insights and Forecast - by Plant Type
- 6.1.1. Boiler
- 6.1.2. Combined Heat and Power (CHP)
- 6.2. Market Analysis, Insights and Forecast - by Heat Source
- 6.2.1. Coal
- 6.2.2. Natural Gas
- 6.2.3. Renewables
- 6.2.4. Oil and Petroleum Products
- 6.3. Market Analysis, Insights and Forecast - by Application
- 6.3.1. Residential
- 6.3.2. Commercial and Industrial
- 6.1. Market Analysis, Insights and Forecast - by Plant Type
- 7. Europe District Heating Market Analysis, Insights and Forecast, 2019-2031
- 7.1. Market Analysis, Insights and Forecast - by Plant Type
- 7.1.1. Boiler
- 7.1.2. Combined Heat and Power (CHP)
- 7.2. Market Analysis, Insights and Forecast - by Heat Source
- 7.2.1. Coal
- 7.2.2. Natural Gas
- 7.2.3. Renewables
- 7.2.4. Oil and Petroleum Products
- 7.3. Market Analysis, Insights and Forecast - by Application
- 7.3.1. Residential
- 7.3.2. Commercial and Industrial
- 7.1. Market Analysis, Insights and Forecast - by Plant Type
- 8. Asia District Heating Market Analysis, Insights and Forecast, 2019-2031
- 8.1. Market Analysis, Insights and Forecast - by Plant Type
- 8.1.1. Boiler
- 8.1.2. Combined Heat and Power (CHP)
- 8.2. Market Analysis, Insights and Forecast - by Heat Source
- 8.2.1. Coal
- 8.2.2. Natural Gas
- 8.2.3. Renewables
- 8.2.4. Oil and Petroleum Products
- 8.3. Market Analysis, Insights and Forecast - by Application
- 8.3.1. Residential
- 8.3.2. Commercial and Industrial
- 8.1. Market Analysis, Insights and Forecast - by Plant Type
- 9. Australia and New Zealand District Heating Market Analysis, Insights and Forecast, 2019-2031
- 9.1. Market Analysis, Insights and Forecast - by Plant Type
- 9.1.1. Boiler
- 9.1.2. Combined Heat and Power (CHP)
- 9.2. Market Analysis, Insights and Forecast - by Heat Source
- 9.2.1. Coal
- 9.2.2. Natural Gas
- 9.2.3. Renewables
- 9.2.4. Oil and Petroleum Products
- 9.3. Market Analysis, Insights and Forecast - by Application
- 9.3.1. Residential
- 9.3.2. Commercial and Industrial
- 9.1. Market Analysis, Insights and Forecast - by Plant Type
- 10. Latin America District Heating Market Analysis, Insights and Forecast, 2019-2031
- 10.1. Market Analysis, Insights and Forecast - by Plant Type
- 10.1.1. Boiler
- 10.1.2. Combined Heat and Power (CHP)
- 10.2. Market Analysis, Insights and Forecast - by Heat Source
- 10.2.1. Coal
- 10.2.2. Natural Gas
- 10.2.3. Renewables
- 10.2.4. Oil and Petroleum Products
- 10.3. Market Analysis, Insights and Forecast - by Application
- 10.3.1. Residential
- 10.3.2. Commercial and Industrial
- 10.1. Market Analysis, Insights and Forecast - by Plant Type
- 11. Middle East and Africa District Heating Market Analysis, Insights and Forecast, 2019-2031
- 11.1. Market Analysis, Insights and Forecast - by Plant Type
- 11.1.1. Boiler
- 11.1.2. Combined Heat and Power (CHP)
- 11.2. Market Analysis, Insights and Forecast - by Heat Source
- 11.2.1. Coal
- 11.2.2. Natural Gas
- 11.2.3. Renewables
- 11.2.4. Oil and Petroleum Products
- 11.3. Market Analysis, Insights and Forecast - by Application
- 11.3.1. Residential
- 11.3.2. Commercial and Industrial
- 11.1. Market Analysis, Insights and Forecast - by Plant Type
- 12. North America District Heating Market Analysis, Insights and Forecast, 2019-2031
- 12.1. Market Analysis, Insights and Forecast - By Country/Sub-region
- 12.1.1.
- 13. Europe District Heating Market Analysis, Insights and Forecast, 2019-2031
- 13.1. Market Analysis, Insights and Forecast - By Country/Sub-region
- 13.1.1.
- 14. Asia Pacific District Heating Market Analysis, Insights and Forecast, 2019-2031
- 14.1. Market Analysis, Insights and Forecast - By Country/Sub-region
- 14.1.1.
- 15. Rest of the World District Heating Market Analysis, Insights and Forecast, 2019-2031
- 15.1. Market Analysis, Insights and Forecast - By Country/Sub-region
- 15.1.1.
- 16. Competitive Analysis
- 16.1. Global Market Share Analysis 2024
- 16.2. Company Profiles
- 16.2.1 Keppel Corporation Limited
- 16.2.1.1. Overview
- 16.2.1.2. Products
- 16.2.1.3. SWOT Analysis
- 16.2.1.4. Recent Developments
- 16.2.1.5. Financials (Based on Availability)
- 16.2.2 Gteborg Energi
- 16.2.2.1. Overview
- 16.2.2.2. Products
- 16.2.2.3. SWOT Analysis
- 16.2.2.4. Recent Developments
- 16.2.2.5. Financials (Based on Availability)
- 16.2.3 Vattenfall AB
- 16.2.3.1. Overview
- 16.2.3.2. Products
- 16.2.3.3. SWOT Analysis
- 16.2.3.4. Recent Developments
- 16.2.3.5. Financials (Based on Availability)
- 16.2.4 Danfoss Group
- 16.2.4.1. Overview
- 16.2.4.2. Products
- 16.2.4.3. SWOT Analysis
- 16.2.4.4. Recent Developments
- 16.2.4.5. Financials (Based on Availability)
- 16.2.5 Statkraft AS
- 16.2.5.1. Overview
- 16.2.5.2. Products
- 16.2.5.3. SWOT Analysis
- 16.2.5.4. Recent Developments
- 16.2.5.5. Financials (Based on Availability)
- 16.2.6 Logstor AS
- 16.2.6.1. Overview
- 16.2.6.2. Products
- 16.2.6.3. SWOT Analysis
- 16.2.6.4. Recent Developments
- 16.2.6.5. Financials (Based on Availability)
- 16.2.7 Engie
- 16.2.7.1. Overview
- 16.2.7.2. Products
- 16.2.7.3. SWOT Analysis
- 16.2.7.4. Recent Developments
- 16.2.7.5. Financials (Based on Availability)
- 16.2.8 Ramboll Group AS
- 16.2.8.1. Overview
- 16.2.8.2. Products
- 16.2.8.3. SWOT Analysis
- 16.2.8.4. Recent Developments
- 16.2.8.5. Financials (Based on Availability)
- 16.2.9 SP Group
- 16.2.9.1. Overview
- 16.2.9.2. Products
- 16.2.9.3. SWOT Analysis
- 16.2.9.4. Recent Developments
- 16.2.9.5. Financials (Based on Availability)
- 16.2.10 NRG Energy Inc
- 16.2.10.1. Overview
- 16.2.10.2. Products
- 16.2.10.3. SWOT Analysis
- 16.2.10.4. Recent Developments
- 16.2.10.5. Financials (Based on Availability)
- 16.2.11 Shinryo Corporation
- 16.2.11.1. Overview
- 16.2.11.2. Products
- 16.2.11.3. SWOT Analysis
- 16.2.11.4. Recent Developments
- 16.2.11.5. Financials (Based on Availability)
- 16.2.12 Vital Energi Ltd
- 16.2.12.1. Overview
- 16.2.12.2. Products
- 16.2.12.3. SWOT Analysis
- 16.2.12.4. Recent Developments
- 16.2.12.5. Financials (Based on Availability)
- 16.2.13 FVB Energy*List Not Exhaustive
- 16.2.13.1. Overview
- 16.2.13.2. Products
- 16.2.13.3. SWOT Analysis
- 16.2.13.4. Recent Developments
- 16.2.13.5. Financials (Based on Availability)
- 16.2.14 Alfa Laval AB
- 16.2.14.1. Overview
- 16.2.14.2. Products
- 16.2.14.3. SWOT Analysis
- 16.2.14.4. Recent Developments
- 16.2.14.5. Financials (Based on Availability)
- 16.2.1 Keppel Corporation Limited
List of Figures
- Figure 1: Global District Heating Market Revenue Breakdown (Million, %) by Region 2024 & 2032
- Figure 2: North America District Heating Market Revenue (Million), by Country 2024 & 2032
- Figure 3: North America District Heating Market Revenue Share (%), by Country 2024 & 2032
- Figure 4: Europe District Heating Market Revenue (Million), by Country 2024 & 2032
- Figure 5: Europe District Heating Market Revenue Share (%), by Country 2024 & 2032
- Figure 6: Asia Pacific District Heating Market Revenue (Million), by Country 2024 & 2032
- Figure 7: Asia Pacific District Heating Market Revenue Share (%), by Country 2024 & 2032
- Figure 8: Rest of the World District Heating Market Revenue (Million), by Country 2024 & 2032
- Figure 9: Rest of the World District Heating Market Revenue Share (%), by Country 2024 & 2032
- Figure 10: North America District Heating Market Revenue (Million), by Plant Type 2024 & 2032
- Figure 11: North America District Heating Market Revenue Share (%), by Plant Type 2024 & 2032
- Figure 12: North America District Heating Market Revenue (Million), by Heat Source 2024 & 2032
- Figure 13: North America District Heating Market Revenue Share (%), by Heat Source 2024 & 2032
- Figure 14: North America District Heating Market Revenue (Million), by Application 2024 & 2032
- Figure 15: North America District Heating Market Revenue Share (%), by Application 2024 & 2032
- Figure 16: North America District Heating Market Revenue (Million), by Country 2024 & 2032
- Figure 17: North America District Heating Market Revenue Share (%), by Country 2024 & 2032
- Figure 18: Europe District Heating Market Revenue (Million), by Plant Type 2024 & 2032
- Figure 19: Europe District Heating Market Revenue Share (%), by Plant Type 2024 & 2032
- Figure 20: Europe District Heating Market Revenue (Million), by Heat Source 2024 & 2032
- Figure 21: Europe District Heating Market Revenue Share (%), by Heat Source 2024 & 2032
- Figure 22: Europe District Heating Market Revenue (Million), by Application 2024 & 2032
- Figure 23: Europe District Heating Market Revenue Share (%), by Application 2024 & 2032
- Figure 24: Europe District Heating Market Revenue (Million), by Country 2024 & 2032
- Figure 25: Europe District Heating Market Revenue Share (%), by Country 2024 & 2032
- Figure 26: Asia District Heating Market Revenue (Million), by Plant Type 2024 & 2032
- Figure 27: Asia District Heating Market Revenue Share (%), by Plant Type 2024 & 2032
- Figure 28: Asia District Heating Market Revenue (Million), by Heat Source 2024 & 2032
- Figure 29: Asia District Heating Market Revenue Share (%), by Heat Source 2024 & 2032
- Figure 30: Asia District Heating Market Revenue (Million), by Application 2024 & 2032
- Figure 31: Asia District Heating Market Revenue Share (%), by Application 2024 & 2032
- Figure 32: Asia District Heating Market Revenue (Million), by Country 2024 & 2032
- Figure 33: Asia District Heating Market Revenue Share (%), by Country 2024 & 2032
- Figure 34: Australia and New Zealand District Heating Market Revenue (Million), by Plant Type 2024 & 2032
- Figure 35: Australia and New Zealand District Heating Market Revenue Share (%), by Plant Type 2024 & 2032
- Figure 36: Australia and New Zealand District Heating Market Revenue (Million), by Heat Source 2024 & 2032
- Figure 37: Australia and New Zealand District Heating Market Revenue Share (%), by Heat Source 2024 & 2032
- Figure 38: Australia and New Zealand District Heating Market Revenue (Million), by Application 2024 & 2032
- Figure 39: Australia and New Zealand District Heating Market Revenue Share (%), by Application 2024 & 2032
- Figure 40: Australia and New Zealand District Heating Market Revenue (Million), by Country 2024 & 2032
- Figure 41: Australia and New Zealand District Heating Market Revenue Share (%), by Country 2024 & 2032
- Figure 42: Latin America District Heating Market Revenue (Million), by Plant Type 2024 & 2032
- Figure 43: Latin America District Heating Market Revenue Share (%), by Plant Type 2024 & 2032
- Figure 44: Latin America District Heating Market Revenue (Million), by Heat Source 2024 & 2032
- Figure 45: Latin America District Heating Market Revenue Share (%), by Heat Source 2024 & 2032
- Figure 46: Latin America District Heating Market Revenue (Million), by Application 2024 & 2032
- Figure 47: Latin America District Heating Market Revenue Share (%), by Application 2024 & 2032
- Figure 48: Latin America District Heating Market Revenue (Million), by Country 2024 & 2032
- Figure 49: Latin America District Heating Market Revenue Share (%), by Country 2024 & 2032
- Figure 50: Middle East and Africa District Heating Market Revenue (Million), by Plant Type 2024 & 2032
- Figure 51: Middle East and Africa District Heating Market Revenue Share (%), by Plant Type 2024 & 2032
- Figure 52: Middle East and Africa District Heating Market Revenue (Million), by Heat Source 2024 & 2032
- Figure 53: Middle East and Africa District Heating Market Revenue Share (%), by Heat Source 2024 & 2032
- Figure 54: Middle East and Africa District Heating Market Revenue (Million), by Application 2024 & 2032
- Figure 55: Middle East and Africa District Heating Market Revenue Share (%), by Application 2024 & 2032
- Figure 56: Middle East and Africa District Heating Market Revenue (Million), by Country 2024 & 2032
- Figure 57: Middle East and Africa District Heating Market Revenue Share (%), by Country 2024 & 2032
List of Tables
- Table 1: Global District Heating Market Revenue Million Forecast, by Region 2019 & 2032
- Table 2: Global District Heating Market Revenue Million Forecast, by Plant Type 2019 & 2032
- Table 3: Global District Heating Market Revenue Million Forecast, by Heat Source 2019 & 2032
- Table 4: Global District Heating Market Revenue Million Forecast, by Application 2019 & 2032
- Table 5: Global District Heating Market Revenue Million Forecast, by Region 2019 & 2032
- Table 6: Global District Heating Market Revenue Million Forecast, by Country 2019 & 2032
- Table 7: District Heating Market Revenue (Million) Forecast, by Application 2019 & 2032
- Table 8: Global District Heating Market Revenue Million Forecast, by Country 2019 & 2032
- Table 9: District Heating Market Revenue (Million) Forecast, by Application 2019 & 2032
- Table 10: Global District Heating Market Revenue Million Forecast, by Country 2019 & 2032
- Table 11: District Heating Market Revenue (Million) Forecast, by Application 2019 & 2032
- Table 12: Global District Heating Market Revenue Million Forecast, by Country 2019 & 2032
- Table 13: District Heating Market Revenue (Million) Forecast, by Application 2019 & 2032
- Table 14: Global District Heating Market Revenue Million Forecast, by Plant Type 2019 & 2032
- Table 15: Global District Heating Market Revenue Million Forecast, by Heat Source 2019 & 2032
- Table 16: Global District Heating Market Revenue Million Forecast, by Application 2019 & 2032
- Table 17: Global District Heating Market Revenue Million Forecast, by Country 2019 & 2032
- Table 18: Global District Heating Market Revenue Million Forecast, by Plant Type 2019 & 2032
- Table 19: Global District Heating Market Revenue Million Forecast, by Heat Source 2019 & 2032
- Table 20: Global District Heating Market Revenue Million Forecast, by Application 2019 & 2032
- Table 21: Global District Heating Market Revenue Million Forecast, by Country 2019 & 2032
- Table 22: Global District Heating Market Revenue Million Forecast, by Plant Type 2019 & 2032
- Table 23: Global District Heating Market Revenue Million Forecast, by Heat Source 2019 & 2032
- Table 24: Global District Heating Market Revenue Million Forecast, by Application 2019 & 2032
- Table 25: Global District Heating Market Revenue Million Forecast, by Country 2019 & 2032
- Table 26: Global District Heating Market Revenue Million Forecast, by Plant Type 2019 & 2032
- Table 27: Global District Heating Market Revenue Million Forecast, by Heat Source 2019 & 2032
- Table 28: Global District Heating Market Revenue Million Forecast, by Application 2019 & 2032
- Table 29: Global District Heating Market Revenue Million Forecast, by Country 2019 & 2032
- Table 30: Global District Heating Market Revenue Million Forecast, by Plant Type 2019 & 2032
- Table 31: Global District Heating Market Revenue Million Forecast, by Heat Source 2019 & 2032
- Table 32: Global District Heating Market Revenue Million Forecast, by Application 2019 & 2032
- Table 33: Global District Heating Market Revenue Million Forecast, by Country 2019 & 2032
- Table 34: Global District Heating Market Revenue Million Forecast, by Plant Type 2019 & 2032
- Table 35: Global District Heating Market Revenue Million Forecast, by Heat Source 2019 & 2032
- Table 36: Global District Heating Market Revenue Million Forecast, by Application 2019 & 2032
- Table 37: Global District Heating Market Revenue Million Forecast, by Country 2019 & 2032
Frequently Asked Questions
1. What is the projected Compound Annual Growth Rate (CAGR) of the District Heating Market?
The projected CAGR is approximately 1.59%.
2. Which companies are prominent players in the District Heating Market?
Key companies in the market include Keppel Corporation Limited, Gteborg Energi, Vattenfall AB, Danfoss Group, Statkraft AS, Logstor AS, Engie, Ramboll Group AS, SP Group, NRG Energy Inc, Shinryo Corporation, Vital Energi Ltd, FVB Energy*List Not Exhaustive, Alfa Laval AB.
3. What are the main segments of the District Heating Market?
The market segments include Plant Type, Heat Source, Application.
4. Can you provide details about the market size?
The market size is estimated to be USD 52.62 Million as of 2022.
5. What are some drivers contributing to market growth?
Augmented Demand for Energy-efficient and Cost-effective Heating Systems; Rising Urbanization and Industrialization.
6. What are the notable trends driving market growth?
Residential to Witness the Growth.
7. Are there any restraints impacting market growth?
High Infrastructure Cost.
8. Can you provide examples of recent developments in the market?
April 2023: Danfoss Group announced the new options for OEMs as it expands the Z-design range of Micro Plate Heat Exchangers; where The latest addition to the range C262L-EZD is a dual-circuit evaporator that's ideal for scroll chillers. These robust and reliable units extend the range's capability with cooling capacities now covering up to 300 kW in single circuits and up to 800 kW in dual circuits.
9. What pricing options are available for accessing the report?
Pricing options include single-user, multi-user, and enterprise licenses priced at USD 4750, USD 5250, and USD 8750 respectively.
10. Is the market size provided in terms of value or volume?
The market size is provided in terms of value, measured in Million.
11. Are there any specific market keywords associated with the report?
Yes, the market keyword associated with the report is "District Heating Market," which aids in identifying and referencing the specific market segment covered.
12. How do I determine which pricing option suits my needs best?
The pricing options vary based on user requirements and access needs. Individual users may opt for single-user licenses, while businesses requiring broader access may choose multi-user or enterprise licenses for cost-effective access to the report.
13. Are there any additional resources or data provided in the District Heating Market report?
While the report offers comprehensive insights, it's advisable to review the specific contents or supplementary materials provided to ascertain if additional resources or data are available.
14. How can I stay updated on further developments or reports in the District Heating Market?
To stay informed about further developments, trends, and reports in the District Heating Market, consider subscribing to industry newsletters, following relevant companies and organizations, or regularly checking reputable industry news sources and publications.
Methodology
Step 1 - Identification of Relevant Samples Size from Population Database


Step 2 - Approaches for Defining Global Market Size (Value, Volume* & Price*)

Note*: In applicable scenarios
Step 3 - Data Sources
Primary Research
- Web Analytics
- Survey Reports
- Research Institute
- Latest Research Reports
- Opinion Leaders
Secondary Research
- Annual Reports
- White Paper
- Latest Press Release
- Industry Association
- Paid Database
- Investor Presentations

Step 4 - Data Triangulation
Involves using different sources of information in order to increase the validity of a study
These sources are likely to be stakeholders in a program - participants, other researchers, program staff, other community members, and so on.
Then we put all data in single framework & apply various statistical tools to find out the dynamic on the market.
During the analysis stage, feedback from the stakeholder groups would be compared to determine areas of agreement as well as areas of divergence


