
Key Insights
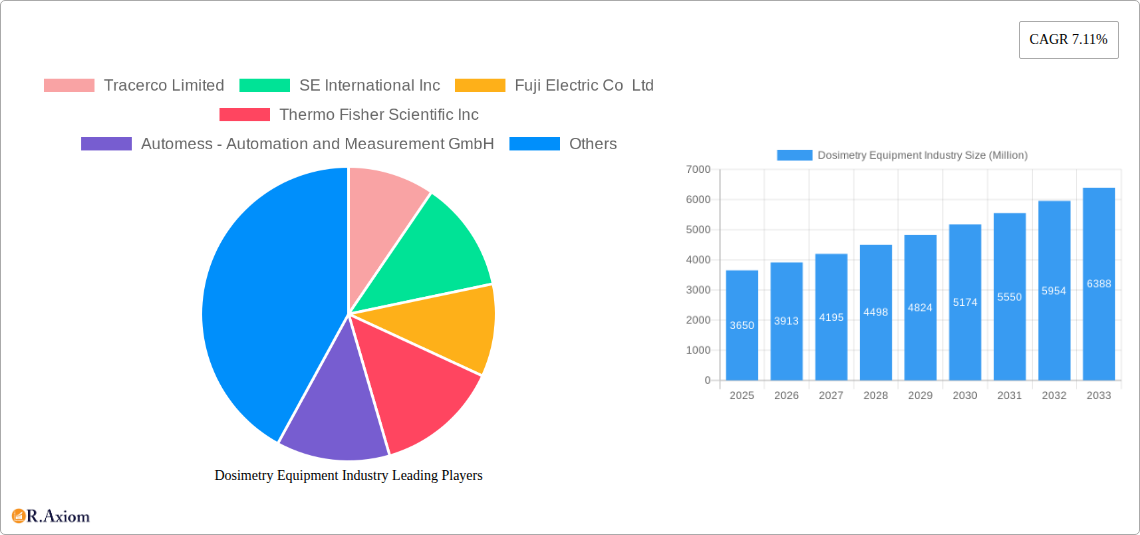
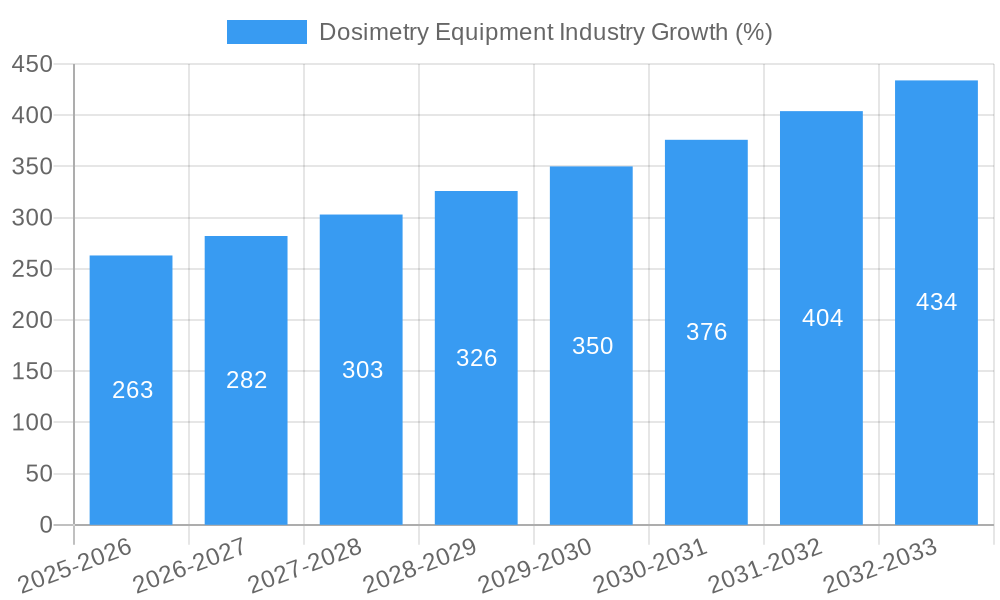
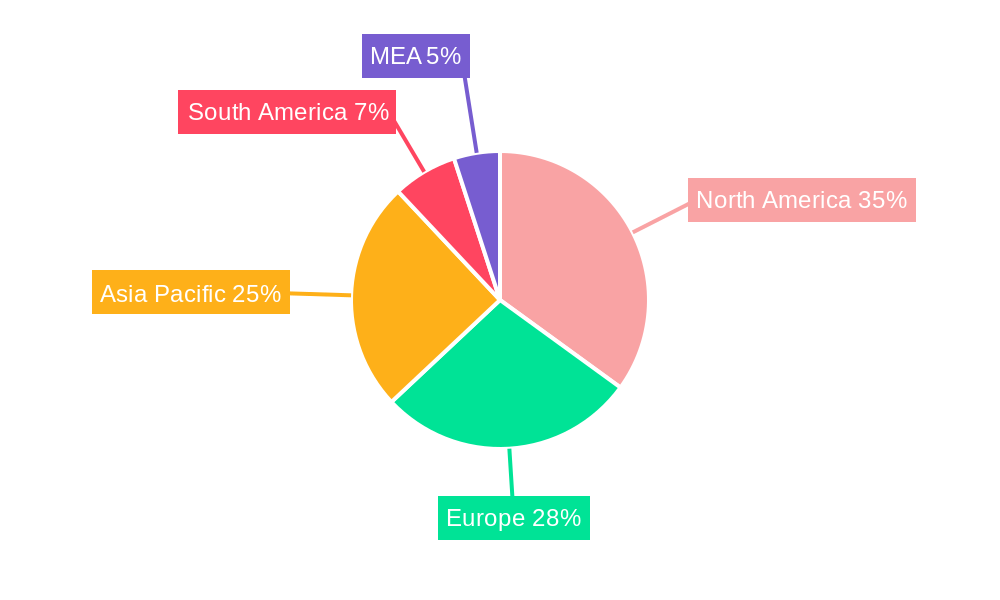
The global dosimetry equipment market, valued at $3.65 billion in 2025, is projected to experience robust growth, driven by a Compound Annual Growth Rate (CAGR) of 7.11% from 2025 to 2033. This expansion is fueled by several key factors. Firstly, the increasing prevalence of radiation-related industries, including healthcare (radiotherapy, nuclear medicine), oil and gas exploration, and manufacturing (industrial radiography), necessitates reliable and accurate radiation monitoring. Stringent safety regulations and a growing awareness of the health risks associated with radiation exposure are further driving demand for advanced dosimetry equipment. Technological advancements, such as the development of more sensitive and precise dosimeters like Optically Stimulated Luminescence (OSL) dosimeters and Electronic Personal Dosimeters (EPDs), are enhancing market growth. Furthermore, the rising adoption of sophisticated data management and analysis tools linked with dosimetry systems improves efficiency and regulatory compliance, boosting market appeal. The market is segmented by end-user industry (healthcare, oil & gas, etc.), type of dosimeter (EPD, TLD, OSL, etc.), and application (active, passive), offering diverse opportunities for specialized equipment and services. North America and Europe currently hold significant market shares due to established healthcare infrastructure and stringent radiation safety standards. However, Asia-Pacific is expected to witness substantial growth in the coming years, fueled by increasing industrialization and economic development.
The competitive landscape is characterized by a mix of established players and emerging companies, each offering a range of dosimetry solutions. Key players are focused on product innovation, strategic partnerships, and geographic expansion to maintain a competitive edge. The future of the dosimetry equipment market is promising, driven by the aforementioned factors and an ongoing need for accurate radiation monitoring across diverse sectors. The consistent demand from expanding healthcare facilities, increasing nuclear power generation, and the growing adoption of radiation-based technologies in various industries ensures sustained growth. The market’s trajectory is largely dependent on technological innovations and regulatory compliance developments impacting safety standards within radiation-related fields.
Dosimetry Equipment Industry Market Report: 2019-2033
This comprehensive report provides an in-depth analysis of the Dosimetry Equipment industry, offering invaluable insights for stakeholders, investors, and industry professionals. Covering the period from 2019 to 2033, with a focus on 2025, this report meticulously examines market trends, competitive dynamics, technological advancements, and future growth prospects. The report forecasts a significant expansion in the market driven by increased demand across diverse end-use industries. The total market size is projected to reach xx Million by 2033.
Dosimetry Equipment Industry Market Concentration & Innovation
The Dosimetry Equipment market exhibits a moderately consolidated structure, with key players such as Tracerco Limited, SE International Inc, Fuji Electric Co Ltd, Thermo Fisher Scientific Inc, Automess - Automation and Measurement GmbH, Fortive Corporation, ATOMTEX, Mirion Technologies Inc, Radiation Detection Company Inc, and Arrow-Tech Inc holding significant market shares. The exact market share distribution varies by segment and region, but the top 5 players collectively account for approximately xx% of the global market in 2025.
Innovation in the industry is driven by the need for more accurate, compact, and user-friendly dosimeters. Advancements in sensor technology, data processing, and wireless communication are key drivers. Regulatory frameworks, such as those set by the International Atomic Energy Agency (IAEA), play a vital role in shaping product development and market standards. The existence of substitute technologies (e.g., alternative radiation detection methods) creates competitive pressure, forcing companies to continuously innovate. Furthermore, end-user trends, such as increased safety awareness and stringent regulations in high-risk industries, fuel demand for advanced dosimetry solutions.
M&A activity in the industry is moderate but significant, with several deals involving smaller specialized companies being acquired by larger players to expand their product portfolios and market reach. The total value of M&A transactions in the past five years is estimated to be around xx Million. These activities demonstrate a strategic focus on consolidating market share and gaining access to emerging technologies.
Dosimetry Equipment Industry Industry Trends & Insights
The Dosimetry Equipment market is experiencing robust growth, driven by several key factors. The global CAGR for the period 2025-2033 is estimated at xx%, primarily fueled by increasing industrialization, particularly in developing economies. The rising adoption of dosimetry equipment in diverse sectors like healthcare, nuclear power, and manufacturing significantly contributes to market expansion. The market penetration rate of advanced dosimetry systems, such as OSL dosimeters, is also increasing due to their improved accuracy and ease of use.
Technological advancements such as the development of miniaturized sensors, wireless data transmission capabilities, and enhanced data analysis tools are revolutionizing the industry. Consumer preferences are shifting towards more sophisticated, user-friendly devices with real-time monitoring capabilities. This demand is shaping the competitive landscape, with manufacturers constantly striving to offer superior performance, accuracy, and convenience. The intense competition fosters innovation and keeps pricing competitive, ultimately benefiting end-users. The growing focus on worker safety and regulatory compliance further boosts the demand for reliable and accurate dosimetry equipment across all end-user industries.
Dominant Markets & Segments in Dosimetry Equipment Industry
Dominant Regions & Countries: The North American and European markets currently hold the largest shares of the global dosimetry equipment market due to stringent safety regulations and high adoption rates across various sectors. However, the Asia-Pacific region is expected to exhibit the fastest growth rate during the forecast period, primarily driven by expanding industrial activities and rising nuclear power plant construction.
Dominant End-User Industries: The healthcare sector is a significant end-user, demanding high-precision dosimeters for radiation therapy and medical imaging. The nuclear power industry relies heavily on sophisticated dosimetry solutions for worker safety and environmental monitoring. The oil and gas sector also constitutes a significant market segment, given the need to monitor radiation exposure for workers in exploration and production activities.
Dominant Types: Electronic Personal Dosimeters (EPDs) and Optically Stimulated Luminescence Dosimeters (OSLs) represent the dominant types due to their high accuracy, ease of use, and real-time monitoring capabilities.
Dominant Application: Passive dosimetry systems currently dominate the market due to their cost-effectiveness and suitability for various applications. However, active dosimetry systems are witnessing increasing adoption due to their real-time monitoring capabilities.
- Key Drivers (by segment):
- Healthcare: Stringent regulatory standards, increasing prevalence of radiation therapy, growing demand for precise radiation monitoring.
- Nuclear Plants: Strict safety protocols, continuous monitoring requirements, high radiation exposure risks for workers.
- Oil & Gas: Safety regulations, need for worker protection during exploration and production, potential for radiation exposure in certain operations.
- EPDs: Ease of use, real-time monitoring, improved accuracy.
- OSLs: High sensitivity, reusable nature, precise dose measurement.
The dominance of each segment is analyzed based on market size, growth rate, and key drivers, providing a comprehensive overview of the industry landscape.
Dosimetry Equipment Industry Product Developments
Recent years have witnessed significant advancements in dosimetry equipment, including the development of miniaturized, lightweight dosimeters with enhanced accuracy and real-time data transmission capabilities. Technological trends like the integration of advanced sensors, sophisticated algorithms for data analysis, and wireless communication protocols have improved the efficiency and convenience of dosimetry systems. These developments have improved market fit by meeting the growing demand for accurate, user-friendly, and cost-effective solutions in diverse applications. The integration of AI and machine learning for data analysis is also emerging as a significant trend.
Report Scope & Segmentation Analysis
This report segments the Dosimetry Equipment market across various parameters:
By End-user Industry: Healthcare, Oil and Gas, Mining, Nuclear Plants, Industrial, Manufacturing, Other End-user Industries. Each segment's market size, growth projections, and competitive dynamics are analyzed individually.
By Type: Electronic Personal Dosimeter (EPD), Thermo Luminescent Dosimeter (TLD), Optically Stimulated Luminescence Dosimeters (OSL), Film Badge Dosimeter, Other Types. The report examines the market share and growth potential of each dosimeter type.
By Application: Active, Passive. The report analyzes the market size and growth prospects for both active and passive dosimetry applications. Market size projections are provided for each segment for the forecast period (2025-2033), with detailed analysis of competitive landscapes and growth drivers.
Key Drivers of Dosimetry Equipment Growth
Several factors are driving the growth of the Dosimetry Equipment industry. Technological advancements leading to more accurate, reliable, and user-friendly dosimeters are a key driver. Stringent safety regulations in various industries mandate the use of dosimetry equipment, stimulating market expansion. Economic growth and industrialization in developing economies contribute to the increased demand for these devices. The growing awareness of radiation hazards and the need for worker safety also contribute significantly to the market's growth.
Challenges in the Dosimetry Equipment Industry Sector
Despite the growth potential, the Dosimetry Equipment industry faces several challenges. Stringent regulatory approvals and certifications can slow down product launches and increase development costs. The supply chain for specialized components can be disrupted, impacting manufacturing and delivery timelines. Intense competition from established players and the emergence of new entrants create pricing pressure and necessitate continuous innovation to maintain a competitive edge. These factors, if not addressed efficiently, could impact the overall growth of the industry. The market share captured by each type of dosimeter is impacted by the availability of resources required for manufacturing and cost fluctuations.
Emerging Opportunities in Dosimetry Equipment Industry
The Dosimetry Equipment industry presents several promising opportunities. The growing demand for advanced dosimetry solutions in emerging markets, especially in the Asia-Pacific region, offers significant potential for expansion. Technological advancements like the integration of artificial intelligence (AI) and machine learning (ML) in dosimetry systems can significantly improve accuracy and efficiency, leading to new market opportunities. The development of new and improved dosimeter types with enhanced features and functionality creates possibilities for growth. The increasing focus on personalized medicine and targeted radiation therapy is also creating new avenues for innovation and growth in the healthcare sector.
Leading Players in the Dosimetry Equipment Industry Market
- Tracerco Limited
- SE International Inc
- Fuji Electric Co Ltd
- Thermo Fisher Scientific Inc
- Automess - Automation and Measurement GmbH
- Fortive Corporation
- ATOMTEX
- Mirion Technologies Inc
- Radiation Detection Company Inc
- Arrow-Tech Inc
Key Developments in Dosimetry Equipment Industry
September 2022: Hungary's ELKH Center for Energy Research (CER) Space Research Division developed a new dosimeter for use in lunar colonies and NASA's Artemis program, highlighting advancements in radiation measurement for space exploration and driving demand for robust and reliable dosimeters in extreme environments.
April 2022: The European Space Agency's (ESA) long-term use of radiation detectors on the International Space Station (ISS) and the Artemis I mission demonstrates the increasing reliance on sophisticated dosimetry for space exploration, further validating the market's growth and emphasizing the need for advanced radiation measurement technologies. This also signifies the growing need for reliable, long-lasting, and accurate dosimetry solutions for extended space missions.
Strategic Outlook for Dosimetry Equipment Industry Market
The Dosimetry Equipment market is poised for substantial growth in the coming years, driven by technological advancements, increasing regulatory requirements, and expanding applications across various industries. The focus on developing sophisticated dosimetry systems that combine accuracy, reliability, and ease of use will shape the future market landscape. The exploration of new applications, particularly in space exploration and emerging economies, presents significant opportunities for market expansion and innovation. Companies that can effectively adapt to the changing regulatory landscape and successfully integrate new technologies into their product offerings will be well-positioned to capitalize on the future growth potential of this dynamic market.
Dosimetry Equipment Industry Segmentation
-
1. Type
- 1.1. Electronic Personal Dosimeter (EPD)
- 1.2. Thermo Luminescent Dosimeter (TLD)
- 1.3. Optically Stimulated Luminescence Dosimeters (OSL)
- 1.4. Film Badge Dosimeter
- 1.5. Other Types
-
2. Application
- 2.1. Active
- 2.2. Passive
-
3. End-user Industry
- 3.1. Healthcare
- 3.2. Oil and Gas
- 3.3. Mining
- 3.4. Nuclear Plants
- 3.5. Industrial
- 3.6. Manufacturing
- 3.7. Other End-user Industries
Dosimetry Equipment Industry Segmentation By Geography
- 1. North America
- 2. Europe
- 3. Asia
- 4. Australia and New Zealand
- 5. Latin America
- 6. Middle East and Africa
Dosimetry Equipment Industry REPORT HIGHLIGHTS
| Aspects | Details |
|---|---|
| Study Period | 2019-2033 |
| Base Year | 2024 |
| Estimated Year | 2025 |
| Forecast Period | 2025-2033 |
| Historical Period | 2019-2024 |
| Growth Rate | CAGR of 7.11% from 2019-2033 |
| Segmentation |
|
Table of Contents
- 1. Introduction
- 1.1. Research Scope
- 1.2. Market Segmentation
- 1.3. Research Methodology
- 1.4. Definitions and Assumptions
- 2. Executive Summary
- 2.1. Introduction
- 3. Market Dynamics
- 3.1. Introduction
- 3.2. Market Drivers
- 3.2.1. Growing Demand for Radiation and Monitoring Devices Across the Medical Sector; Rising Application of Radioactive Substances Across the Industrial Sector
- 3.3. Market Restrains
- 3.3.1 Product Accuracy
- 3.3.2 Stringent Government Regulations
- 3.3.3 and High Costs
- 3.4. Market Trends
- 3.4.1. Rising Application of Radioactive Substances Across the Industrial Sector Drives the Market
- 4. Market Factor Analysis
- 4.1. Porters Five Forces
- 4.2. Supply/Value Chain
- 4.3. PESTEL analysis
- 4.4. Market Entropy
- 4.5. Patent/Trademark Analysis
- 5. Global Dosimetry Equipment Industry Analysis, Insights and Forecast, 2019-2031
- 5.1. Market Analysis, Insights and Forecast - by Type
- 5.1.1. Electronic Personal Dosimeter (EPD)
- 5.1.2. Thermo Luminescent Dosimeter (TLD)
- 5.1.3. Optically Stimulated Luminescence Dosimeters (OSL)
- 5.1.4. Film Badge Dosimeter
- 5.1.5. Other Types
- 5.2. Market Analysis, Insights and Forecast - by Application
- 5.2.1. Active
- 5.2.2. Passive
- 5.3. Market Analysis, Insights and Forecast - by End-user Industry
- 5.3.1. Healthcare
- 5.3.2. Oil and Gas
- 5.3.3. Mining
- 5.3.4. Nuclear Plants
- 5.3.5. Industrial
- 5.3.6. Manufacturing
- 5.3.7. Other End-user Industries
- 5.4. Market Analysis, Insights and Forecast - by Region
- 5.4.1. North America
- 5.4.2. Europe
- 5.4.3. Asia
- 5.4.4. Australia and New Zealand
- 5.4.5. Latin America
- 5.4.6. Middle East and Africa
- 5.1. Market Analysis, Insights and Forecast - by Type
- 6. North America Dosimetry Equipment Industry Analysis, Insights and Forecast, 2019-2031
- 6.1. Market Analysis, Insights and Forecast - by Type
- 6.1.1. Electronic Personal Dosimeter (EPD)
- 6.1.2. Thermo Luminescent Dosimeter (TLD)
- 6.1.3. Optically Stimulated Luminescence Dosimeters (OSL)
- 6.1.4. Film Badge Dosimeter
- 6.1.5. Other Types
- 6.2. Market Analysis, Insights and Forecast - by Application
- 6.2.1. Active
- 6.2.2. Passive
- 6.3. Market Analysis, Insights and Forecast - by End-user Industry
- 6.3.1. Healthcare
- 6.3.2. Oil and Gas
- 6.3.3. Mining
- 6.3.4. Nuclear Plants
- 6.3.5. Industrial
- 6.3.6. Manufacturing
- 6.3.7. Other End-user Industries
- 6.1. Market Analysis, Insights and Forecast - by Type
- 7. Europe Dosimetry Equipment Industry Analysis, Insights and Forecast, 2019-2031
- 7.1. Market Analysis, Insights and Forecast - by Type
- 7.1.1. Electronic Personal Dosimeter (EPD)
- 7.1.2. Thermo Luminescent Dosimeter (TLD)
- 7.1.3. Optically Stimulated Luminescence Dosimeters (OSL)
- 7.1.4. Film Badge Dosimeter
- 7.1.5. Other Types
- 7.2. Market Analysis, Insights and Forecast - by Application
- 7.2.1. Active
- 7.2.2. Passive
- 7.3. Market Analysis, Insights and Forecast - by End-user Industry
- 7.3.1. Healthcare
- 7.3.2. Oil and Gas
- 7.3.3. Mining
- 7.3.4. Nuclear Plants
- 7.3.5. Industrial
- 7.3.6. Manufacturing
- 7.3.7. Other End-user Industries
- 7.1. Market Analysis, Insights and Forecast - by Type
- 8. Asia Dosimetry Equipment Industry Analysis, Insights and Forecast, 2019-2031
- 8.1. Market Analysis, Insights and Forecast - by Type
- 8.1.1. Electronic Personal Dosimeter (EPD)
- 8.1.2. Thermo Luminescent Dosimeter (TLD)
- 8.1.3. Optically Stimulated Luminescence Dosimeters (OSL)
- 8.1.4. Film Badge Dosimeter
- 8.1.5. Other Types
- 8.2. Market Analysis, Insights and Forecast - by Application
- 8.2.1. Active
- 8.2.2. Passive
- 8.3. Market Analysis, Insights and Forecast - by End-user Industry
- 8.3.1. Healthcare
- 8.3.2. Oil and Gas
- 8.3.3. Mining
- 8.3.4. Nuclear Plants
- 8.3.5. Industrial
- 8.3.6. Manufacturing
- 8.3.7. Other End-user Industries
- 8.1. Market Analysis, Insights and Forecast - by Type
- 9. Australia and New Zealand Dosimetry Equipment Industry Analysis, Insights and Forecast, 2019-2031
- 9.1. Market Analysis, Insights and Forecast - by Type
- 9.1.1. Electronic Personal Dosimeter (EPD)
- 9.1.2. Thermo Luminescent Dosimeter (TLD)
- 9.1.3. Optically Stimulated Luminescence Dosimeters (OSL)
- 9.1.4. Film Badge Dosimeter
- 9.1.5. Other Types
- 9.2. Market Analysis, Insights and Forecast - by Application
- 9.2.1. Active
- 9.2.2. Passive
- 9.3. Market Analysis, Insights and Forecast - by End-user Industry
- 9.3.1. Healthcare
- 9.3.2. Oil and Gas
- 9.3.3. Mining
- 9.3.4. Nuclear Plants
- 9.3.5. Industrial
- 9.3.6. Manufacturing
- 9.3.7. Other End-user Industries
- 9.1. Market Analysis, Insights and Forecast - by Type
- 10. Latin America Dosimetry Equipment Industry Analysis, Insights and Forecast, 2019-2031
- 10.1. Market Analysis, Insights and Forecast - by Type
- 10.1.1. Electronic Personal Dosimeter (EPD)
- 10.1.2. Thermo Luminescent Dosimeter (TLD)
- 10.1.3. Optically Stimulated Luminescence Dosimeters (OSL)
- 10.1.4. Film Badge Dosimeter
- 10.1.5. Other Types
- 10.2. Market Analysis, Insights and Forecast - by Application
- 10.2.1. Active
- 10.2.2. Passive
- 10.3. Market Analysis, Insights and Forecast - by End-user Industry
- 10.3.1. Healthcare
- 10.3.2. Oil and Gas
- 10.3.3. Mining
- 10.3.4. Nuclear Plants
- 10.3.5. Industrial
- 10.3.6. Manufacturing
- 10.3.7. Other End-user Industries
- 10.1. Market Analysis, Insights and Forecast - by Type
- 11. Middle East and Africa Dosimetry Equipment Industry Analysis, Insights and Forecast, 2019-2031
- 11.1. Market Analysis, Insights and Forecast - by Type
- 11.1.1. Electronic Personal Dosimeter (EPD)
- 11.1.2. Thermo Luminescent Dosimeter (TLD)
- 11.1.3. Optically Stimulated Luminescence Dosimeters (OSL)
- 11.1.4. Film Badge Dosimeter
- 11.1.5. Other Types
- 11.2. Market Analysis, Insights and Forecast - by Application
- 11.2.1. Active
- 11.2.2. Passive
- 11.3. Market Analysis, Insights and Forecast - by End-user Industry
- 11.3.1. Healthcare
- 11.3.2. Oil and Gas
- 11.3.3. Mining
- 11.3.4. Nuclear Plants
- 11.3.5. Industrial
- 11.3.6. Manufacturing
- 11.3.7. Other End-user Industries
- 11.1. Market Analysis, Insights and Forecast - by Type
- 12. North America Dosimetry Equipment Industry Analysis, Insights and Forecast, 2019-2031
- 12.1. Market Analysis, Insights and Forecast - By Country/Sub-region
- 12.1.1 United States
- 12.1.2 Canada
- 12.1.3 Mexico
- 13. Europe Dosimetry Equipment Industry Analysis, Insights and Forecast, 2019-2031
- 13.1. Market Analysis, Insights and Forecast - By Country/Sub-region
- 13.1.1 Germany
- 13.1.2 United Kingdom
- 13.1.3 France
- 13.1.4 Spain
- 13.1.5 Italy
- 13.1.6 Spain
- 13.1.7 Belgium
- 13.1.8 Netherland
- 13.1.9 Nordics
- 13.1.10 Rest of Europe
- 14. Asia Pacific Dosimetry Equipment Industry Analysis, Insights and Forecast, 2019-2031
- 14.1. Market Analysis, Insights and Forecast - By Country/Sub-region
- 14.1.1 China
- 14.1.2 Japan
- 14.1.3 India
- 14.1.4 South Korea
- 14.1.5 Southeast Asia
- 14.1.6 Australia
- 14.1.7 Indonesia
- 14.1.8 Phillipes
- 14.1.9 Singapore
- 14.1.10 Thailandc
- 14.1.11 Rest of Asia Pacific
- 15. South America Dosimetry Equipment Industry Analysis, Insights and Forecast, 2019-2031
- 15.1. Market Analysis, Insights and Forecast - By Country/Sub-region
- 15.1.1 Brazil
- 15.1.2 Argentina
- 15.1.3 Peru
- 15.1.4 Chile
- 15.1.5 Colombia
- 15.1.6 Ecuador
- 15.1.7 Venezuela
- 15.1.8 Rest of South America
- 16. North America Dosimetry Equipment Industry Analysis, Insights and Forecast, 2019-2031
- 16.1. Market Analysis, Insights and Forecast - By Country/Sub-region
- 16.1.1 United States
- 16.1.2 Canada
- 16.1.3 Mexico
- 17. MEA Dosimetry Equipment Industry Analysis, Insights and Forecast, 2019-2031
- 17.1. Market Analysis, Insights and Forecast - By Country/Sub-region
- 17.1.1 United Arab Emirates
- 17.1.2 Saudi Arabia
- 17.1.3 South Africa
- 17.1.4 Rest of Middle East and Africa
- 18. Competitive Analysis
- 18.1. Global Market Share Analysis 2024
- 18.2. Company Profiles
- 18.2.1 Tracerco Limited
- 18.2.1.1. Overview
- 18.2.1.2. Products
- 18.2.1.3. SWOT Analysis
- 18.2.1.4. Recent Developments
- 18.2.1.5. Financials (Based on Availability)
- 18.2.2 SE International Inc
- 18.2.2.1. Overview
- 18.2.2.2. Products
- 18.2.2.3. SWOT Analysis
- 18.2.2.4. Recent Developments
- 18.2.2.5. Financials (Based on Availability)
- 18.2.3 Fuji Electric Co Ltd
- 18.2.3.1. Overview
- 18.2.3.2. Products
- 18.2.3.3. SWOT Analysis
- 18.2.3.4. Recent Developments
- 18.2.3.5. Financials (Based on Availability)
- 18.2.4 Thermo Fisher Scientific Inc
- 18.2.4.1. Overview
- 18.2.4.2. Products
- 18.2.4.3. SWOT Analysis
- 18.2.4.4. Recent Developments
- 18.2.4.5. Financials (Based on Availability)
- 18.2.5 Automess - Automation and Measurement GmbH
- 18.2.5.1. Overview
- 18.2.5.2. Products
- 18.2.5.3. SWOT Analysis
- 18.2.5.4. Recent Developments
- 18.2.5.5. Financials (Based on Availability)
- 18.2.6 Fortive Corporation
- 18.2.6.1. Overview
- 18.2.6.2. Products
- 18.2.6.3. SWOT Analysis
- 18.2.6.4. Recent Developments
- 18.2.6.5. Financials (Based on Availability)
- 18.2.7 ATOMTEX
- 18.2.7.1. Overview
- 18.2.7.2. Products
- 18.2.7.3. SWOT Analysis
- 18.2.7.4. Recent Developments
- 18.2.7.5. Financials (Based on Availability)
- 18.2.8 Mirion Technologies Inc
- 18.2.8.1. Overview
- 18.2.8.2. Products
- 18.2.8.3. SWOT Analysis
- 18.2.8.4. Recent Developments
- 18.2.8.5. Financials (Based on Availability)
- 18.2.9 Radiation Detection Company Inc
- 18.2.9.1. Overview
- 18.2.9.2. Products
- 18.2.9.3. SWOT Analysis
- 18.2.9.4. Recent Developments
- 18.2.9.5. Financials (Based on Availability)
- 18.2.10 Arrow-Tech Inc
- 18.2.10.1. Overview
- 18.2.10.2. Products
- 18.2.10.3. SWOT Analysis
- 18.2.10.4. Recent Developments
- 18.2.10.5. Financials (Based on Availability)
- 18.2.1 Tracerco Limited
List of Figures
- Figure 1: Global Dosimetry Equipment Industry Revenue Breakdown (Million, %) by Region 2024 & 2032
- Figure 2: Global Dosimetry Equipment Industry Volume Breakdown (K Unit, %) by Region 2024 & 2032
- Figure 3: North America Dosimetry Equipment Industry Revenue (Million), by Country 2024 & 2032
- Figure 4: North America Dosimetry Equipment Industry Volume (K Unit), by Country 2024 & 2032
- Figure 5: North America Dosimetry Equipment Industry Revenue Share (%), by Country 2024 & 2032
- Figure 6: North America Dosimetry Equipment Industry Volume Share (%), by Country 2024 & 2032
- Figure 7: Europe Dosimetry Equipment Industry Revenue (Million), by Country 2024 & 2032
- Figure 8: Europe Dosimetry Equipment Industry Volume (K Unit), by Country 2024 & 2032
- Figure 9: Europe Dosimetry Equipment Industry Revenue Share (%), by Country 2024 & 2032
- Figure 10: Europe Dosimetry Equipment Industry Volume Share (%), by Country 2024 & 2032
- Figure 11: Asia Pacific Dosimetry Equipment Industry Revenue (Million), by Country 2024 & 2032
- Figure 12: Asia Pacific Dosimetry Equipment Industry Volume (K Unit), by Country 2024 & 2032
- Figure 13: Asia Pacific Dosimetry Equipment Industry Revenue Share (%), by Country 2024 & 2032
- Figure 14: Asia Pacific Dosimetry Equipment Industry Volume Share (%), by Country 2024 & 2032
- Figure 15: South America Dosimetry Equipment Industry Revenue (Million), by Country 2024 & 2032
- Figure 16: South America Dosimetry Equipment Industry Volume (K Unit), by Country 2024 & 2032
- Figure 17: South America Dosimetry Equipment Industry Revenue Share (%), by Country 2024 & 2032
- Figure 18: South America Dosimetry Equipment Industry Volume Share (%), by Country 2024 & 2032
- Figure 19: North America Dosimetry Equipment Industry Revenue (Million), by Country 2024 & 2032
- Figure 20: North America Dosimetry Equipment Industry Volume (K Unit), by Country 2024 & 2032
- Figure 21: North America Dosimetry Equipment Industry Revenue Share (%), by Country 2024 & 2032
- Figure 22: North America Dosimetry Equipment Industry Volume Share (%), by Country 2024 & 2032
- Figure 23: MEA Dosimetry Equipment Industry Revenue (Million), by Country 2024 & 2032
- Figure 24: MEA Dosimetry Equipment Industry Volume (K Unit), by Country 2024 & 2032
- Figure 25: MEA Dosimetry Equipment Industry Revenue Share (%), by Country 2024 & 2032
- Figure 26: MEA Dosimetry Equipment Industry Volume Share (%), by Country 2024 & 2032
- Figure 27: North America Dosimetry Equipment Industry Revenue (Million), by Type 2024 & 2032
- Figure 28: North America Dosimetry Equipment Industry Volume (K Unit), by Type 2024 & 2032
- Figure 29: North America Dosimetry Equipment Industry Revenue Share (%), by Type 2024 & 2032
- Figure 30: North America Dosimetry Equipment Industry Volume Share (%), by Type 2024 & 2032
- Figure 31: North America Dosimetry Equipment Industry Revenue (Million), by Application 2024 & 2032
- Figure 32: North America Dosimetry Equipment Industry Volume (K Unit), by Application 2024 & 2032
- Figure 33: North America Dosimetry Equipment Industry Revenue Share (%), by Application 2024 & 2032
- Figure 34: North America Dosimetry Equipment Industry Volume Share (%), by Application 2024 & 2032
- Figure 35: North America Dosimetry Equipment Industry Revenue (Million), by End-user Industry 2024 & 2032
- Figure 36: North America Dosimetry Equipment Industry Volume (K Unit), by End-user Industry 2024 & 2032
- Figure 37: North America Dosimetry Equipment Industry Revenue Share (%), by End-user Industry 2024 & 2032
- Figure 38: North America Dosimetry Equipment Industry Volume Share (%), by End-user Industry 2024 & 2032
- Figure 39: North America Dosimetry Equipment Industry Revenue (Million), by Country 2024 & 2032
- Figure 40: North America Dosimetry Equipment Industry Volume (K Unit), by Country 2024 & 2032
- Figure 41: North America Dosimetry Equipment Industry Revenue Share (%), by Country 2024 & 2032
- Figure 42: North America Dosimetry Equipment Industry Volume Share (%), by Country 2024 & 2032
- Figure 43: Europe Dosimetry Equipment Industry Revenue (Million), by Type 2024 & 2032
- Figure 44: Europe Dosimetry Equipment Industry Volume (K Unit), by Type 2024 & 2032
- Figure 45: Europe Dosimetry Equipment Industry Revenue Share (%), by Type 2024 & 2032
- Figure 46: Europe Dosimetry Equipment Industry Volume Share (%), by Type 2024 & 2032
- Figure 47: Europe Dosimetry Equipment Industry Revenue (Million), by Application 2024 & 2032
- Figure 48: Europe Dosimetry Equipment Industry Volume (K Unit), by Application 2024 & 2032
- Figure 49: Europe Dosimetry Equipment Industry Revenue Share (%), by Application 2024 & 2032
- Figure 50: Europe Dosimetry Equipment Industry Volume Share (%), by Application 2024 & 2032
- Figure 51: Europe Dosimetry Equipment Industry Revenue (Million), by End-user Industry 2024 & 2032
- Figure 52: Europe Dosimetry Equipment Industry Volume (K Unit), by End-user Industry 2024 & 2032
- Figure 53: Europe Dosimetry Equipment Industry Revenue Share (%), by End-user Industry 2024 & 2032
- Figure 54: Europe Dosimetry Equipment Industry Volume Share (%), by End-user Industry 2024 & 2032
- Figure 55: Europe Dosimetry Equipment Industry Revenue (Million), by Country 2024 & 2032
- Figure 56: Europe Dosimetry Equipment Industry Volume (K Unit), by Country 2024 & 2032
- Figure 57: Europe Dosimetry Equipment Industry Revenue Share (%), by Country 2024 & 2032
- Figure 58: Europe Dosimetry Equipment Industry Volume Share (%), by Country 2024 & 2032
- Figure 59: Asia Dosimetry Equipment Industry Revenue (Million), by Type 2024 & 2032
- Figure 60: Asia Dosimetry Equipment Industry Volume (K Unit), by Type 2024 & 2032
- Figure 61: Asia Dosimetry Equipment Industry Revenue Share (%), by Type 2024 & 2032
- Figure 62: Asia Dosimetry Equipment Industry Volume Share (%), by Type 2024 & 2032
- Figure 63: Asia Dosimetry Equipment Industry Revenue (Million), by Application 2024 & 2032
- Figure 64: Asia Dosimetry Equipment Industry Volume (K Unit), by Application 2024 & 2032
- Figure 65: Asia Dosimetry Equipment Industry Revenue Share (%), by Application 2024 & 2032
- Figure 66: Asia Dosimetry Equipment Industry Volume Share (%), by Application 2024 & 2032
- Figure 67: Asia Dosimetry Equipment Industry Revenue (Million), by End-user Industry 2024 & 2032
- Figure 68: Asia Dosimetry Equipment Industry Volume (K Unit), by End-user Industry 2024 & 2032
- Figure 69: Asia Dosimetry Equipment Industry Revenue Share (%), by End-user Industry 2024 & 2032
- Figure 70: Asia Dosimetry Equipment Industry Volume Share (%), by End-user Industry 2024 & 2032
- Figure 71: Asia Dosimetry Equipment Industry Revenue (Million), by Country 2024 & 2032
- Figure 72: Asia Dosimetry Equipment Industry Volume (K Unit), by Country 2024 & 2032
- Figure 73: Asia Dosimetry Equipment Industry Revenue Share (%), by Country 2024 & 2032
- Figure 74: Asia Dosimetry Equipment Industry Volume Share (%), by Country 2024 & 2032
- Figure 75: Australia and New Zealand Dosimetry Equipment Industry Revenue (Million), by Type 2024 & 2032
- Figure 76: Australia and New Zealand Dosimetry Equipment Industry Volume (K Unit), by Type 2024 & 2032
- Figure 77: Australia and New Zealand Dosimetry Equipment Industry Revenue Share (%), by Type 2024 & 2032
- Figure 78: Australia and New Zealand Dosimetry Equipment Industry Volume Share (%), by Type 2024 & 2032
- Figure 79: Australia and New Zealand Dosimetry Equipment Industry Revenue (Million), by Application 2024 & 2032
- Figure 80: Australia and New Zealand Dosimetry Equipment Industry Volume (K Unit), by Application 2024 & 2032
- Figure 81: Australia and New Zealand Dosimetry Equipment Industry Revenue Share (%), by Application 2024 & 2032
- Figure 82: Australia and New Zealand Dosimetry Equipment Industry Volume Share (%), by Application 2024 & 2032
- Figure 83: Australia and New Zealand Dosimetry Equipment Industry Revenue (Million), by End-user Industry 2024 & 2032
- Figure 84: Australia and New Zealand Dosimetry Equipment Industry Volume (K Unit), by End-user Industry 2024 & 2032
- Figure 85: Australia and New Zealand Dosimetry Equipment Industry Revenue Share (%), by End-user Industry 2024 & 2032
- Figure 86: Australia and New Zealand Dosimetry Equipment Industry Volume Share (%), by End-user Industry 2024 & 2032
- Figure 87: Australia and New Zealand Dosimetry Equipment Industry Revenue (Million), by Country 2024 & 2032
- Figure 88: Australia and New Zealand Dosimetry Equipment Industry Volume (K Unit), by Country 2024 & 2032
- Figure 89: Australia and New Zealand Dosimetry Equipment Industry Revenue Share (%), by Country 2024 & 2032
- Figure 90: Australia and New Zealand Dosimetry Equipment Industry Volume Share (%), by Country 2024 & 2032
- Figure 91: Latin America Dosimetry Equipment Industry Revenue (Million), by Type 2024 & 2032
- Figure 92: Latin America Dosimetry Equipment Industry Volume (K Unit), by Type 2024 & 2032
- Figure 93: Latin America Dosimetry Equipment Industry Revenue Share (%), by Type 2024 & 2032
- Figure 94: Latin America Dosimetry Equipment Industry Volume Share (%), by Type 2024 & 2032
- Figure 95: Latin America Dosimetry Equipment Industry Revenue (Million), by Application 2024 & 2032
- Figure 96: Latin America Dosimetry Equipment Industry Volume (K Unit), by Application 2024 & 2032
- Figure 97: Latin America Dosimetry Equipment Industry Revenue Share (%), by Application 2024 & 2032
- Figure 98: Latin America Dosimetry Equipment Industry Volume Share (%), by Application 2024 & 2032
- Figure 99: Latin America Dosimetry Equipment Industry Revenue (Million), by End-user Industry 2024 & 2032
- Figure 100: Latin America Dosimetry Equipment Industry Volume (K Unit), by End-user Industry 2024 & 2032
- Figure 101: Latin America Dosimetry Equipment Industry Revenue Share (%), by End-user Industry 2024 & 2032
- Figure 102: Latin America Dosimetry Equipment Industry Volume Share (%), by End-user Industry 2024 & 2032
- Figure 103: Latin America Dosimetry Equipment Industry Revenue (Million), by Country 2024 & 2032
- Figure 104: Latin America Dosimetry Equipment Industry Volume (K Unit), by Country 2024 & 2032
- Figure 105: Latin America Dosimetry Equipment Industry Revenue Share (%), by Country 2024 & 2032
- Figure 106: Latin America Dosimetry Equipment Industry Volume Share (%), by Country 2024 & 2032
- Figure 107: Middle East and Africa Dosimetry Equipment Industry Revenue (Million), by Type 2024 & 2032
- Figure 108: Middle East and Africa Dosimetry Equipment Industry Volume (K Unit), by Type 2024 & 2032
- Figure 109: Middle East and Africa Dosimetry Equipment Industry Revenue Share (%), by Type 2024 & 2032
- Figure 110: Middle East and Africa Dosimetry Equipment Industry Volume Share (%), by Type 2024 & 2032
- Figure 111: Middle East and Africa Dosimetry Equipment Industry Revenue (Million), by Application 2024 & 2032
- Figure 112: Middle East and Africa Dosimetry Equipment Industry Volume (K Unit), by Application 2024 & 2032
- Figure 113: Middle East and Africa Dosimetry Equipment Industry Revenue Share (%), by Application 2024 & 2032
- Figure 114: Middle East and Africa Dosimetry Equipment Industry Volume Share (%), by Application 2024 & 2032
- Figure 115: Middle East and Africa Dosimetry Equipment Industry Revenue (Million), by End-user Industry 2024 & 2032
- Figure 116: Middle East and Africa Dosimetry Equipment Industry Volume (K Unit), by End-user Industry 2024 & 2032
- Figure 117: Middle East and Africa Dosimetry Equipment Industry Revenue Share (%), by End-user Industry 2024 & 2032
- Figure 118: Middle East and Africa Dosimetry Equipment Industry Volume Share (%), by End-user Industry 2024 & 2032
- Figure 119: Middle East and Africa Dosimetry Equipment Industry Revenue (Million), by Country 2024 & 2032
- Figure 120: Middle East and Africa Dosimetry Equipment Industry Volume (K Unit), by Country 2024 & 2032
- Figure 121: Middle East and Africa Dosimetry Equipment Industry Revenue Share (%), by Country 2024 & 2032
- Figure 122: Middle East and Africa Dosimetry Equipment Industry Volume Share (%), by Country 2024 & 2032
List of Tables
- Table 1: Global Dosimetry Equipment Industry Revenue Million Forecast, by Region 2019 & 2032
- Table 2: Global Dosimetry Equipment Industry Volume K Unit Forecast, by Region 2019 & 2032
- Table 3: Global Dosimetry Equipment Industry Revenue Million Forecast, by Type 2019 & 2032
- Table 4: Global Dosimetry Equipment Industry Volume K Unit Forecast, by Type 2019 & 2032
- Table 5: Global Dosimetry Equipment Industry Revenue Million Forecast, by Application 2019 & 2032
- Table 6: Global Dosimetry Equipment Industry Volume K Unit Forecast, by Application 2019 & 2032
- Table 7: Global Dosimetry Equipment Industry Revenue Million Forecast, by End-user Industry 2019 & 2032
- Table 8: Global Dosimetry Equipment Industry Volume K Unit Forecast, by End-user Industry 2019 & 2032
- Table 9: Global Dosimetry Equipment Industry Revenue Million Forecast, by Region 2019 & 2032
- Table 10: Global Dosimetry Equipment Industry Volume K Unit Forecast, by Region 2019 & 2032
- Table 11: Global Dosimetry Equipment Industry Revenue Million Forecast, by Country 2019 & 2032
- Table 12: Global Dosimetry Equipment Industry Volume K Unit Forecast, by Country 2019 & 2032
- Table 13: United States Dosimetry Equipment Industry Revenue (Million) Forecast, by Application 2019 & 2032
- Table 14: United States Dosimetry Equipment Industry Volume (K Unit) Forecast, by Application 2019 & 2032
- Table 15: Canada Dosimetry Equipment Industry Revenue (Million) Forecast, by Application 2019 & 2032
- Table 16: Canada Dosimetry Equipment Industry Volume (K Unit) Forecast, by Application 2019 & 2032
- Table 17: Mexico Dosimetry Equipment Industry Revenue (Million) Forecast, by Application 2019 & 2032
- Table 18: Mexico Dosimetry Equipment Industry Volume (K Unit) Forecast, by Application 2019 & 2032
- Table 19: Global Dosimetry Equipment Industry Revenue Million Forecast, by Country 2019 & 2032
- Table 20: Global Dosimetry Equipment Industry Volume K Unit Forecast, by Country 2019 & 2032
- Table 21: Germany Dosimetry Equipment Industry Revenue (Million) Forecast, by Application 2019 & 2032
- Table 22: Germany Dosimetry Equipment Industry Volume (K Unit) Forecast, by Application 2019 & 2032
- Table 23: United Kingdom Dosimetry Equipment Industry Revenue (Million) Forecast, by Application 2019 & 2032
- Table 24: United Kingdom Dosimetry Equipment Industry Volume (K Unit) Forecast, by Application 2019 & 2032
- Table 25: France Dosimetry Equipment Industry Revenue (Million) Forecast, by Application 2019 & 2032
- Table 26: France Dosimetry Equipment Industry Volume (K Unit) Forecast, by Application 2019 & 2032
- Table 27: Spain Dosimetry Equipment Industry Revenue (Million) Forecast, by Application 2019 & 2032
- Table 28: Spain Dosimetry Equipment Industry Volume (K Unit) Forecast, by Application 2019 & 2032
- Table 29: Italy Dosimetry Equipment Industry Revenue (Million) Forecast, by Application 2019 & 2032
- Table 30: Italy Dosimetry Equipment Industry Volume (K Unit) Forecast, by Application 2019 & 2032
- Table 31: Spain Dosimetry Equipment Industry Revenue (Million) Forecast, by Application 2019 & 2032
- Table 32: Spain Dosimetry Equipment Industry Volume (K Unit) Forecast, by Application 2019 & 2032
- Table 33: Belgium Dosimetry Equipment Industry Revenue (Million) Forecast, by Application 2019 & 2032
- Table 34: Belgium Dosimetry Equipment Industry Volume (K Unit) Forecast, by Application 2019 & 2032
- Table 35: Netherland Dosimetry Equipment Industry Revenue (Million) Forecast, by Application 2019 & 2032
- Table 36: Netherland Dosimetry Equipment Industry Volume (K Unit) Forecast, by Application 2019 & 2032
- Table 37: Nordics Dosimetry Equipment Industry Revenue (Million) Forecast, by Application 2019 & 2032
- Table 38: Nordics Dosimetry Equipment Industry Volume (K Unit) Forecast, by Application 2019 & 2032
- Table 39: Rest of Europe Dosimetry Equipment Industry Revenue (Million) Forecast, by Application 2019 & 2032
- Table 40: Rest of Europe Dosimetry Equipment Industry Volume (K Unit) Forecast, by Application 2019 & 2032
- Table 41: Global Dosimetry Equipment Industry Revenue Million Forecast, by Country 2019 & 2032
- Table 42: Global Dosimetry Equipment Industry Volume K Unit Forecast, by Country 2019 & 2032
- Table 43: China Dosimetry Equipment Industry Revenue (Million) Forecast, by Application 2019 & 2032
- Table 44: China Dosimetry Equipment Industry Volume (K Unit) Forecast, by Application 2019 & 2032
- Table 45: Japan Dosimetry Equipment Industry Revenue (Million) Forecast, by Application 2019 & 2032
- Table 46: Japan Dosimetry Equipment Industry Volume (K Unit) Forecast, by Application 2019 & 2032
- Table 47: India Dosimetry Equipment Industry Revenue (Million) Forecast, by Application 2019 & 2032
- Table 48: India Dosimetry Equipment Industry Volume (K Unit) Forecast, by Application 2019 & 2032
- Table 49: South Korea Dosimetry Equipment Industry Revenue (Million) Forecast, by Application 2019 & 2032
- Table 50: South Korea Dosimetry Equipment Industry Volume (K Unit) Forecast, by Application 2019 & 2032
- Table 51: Southeast Asia Dosimetry Equipment Industry Revenue (Million) Forecast, by Application 2019 & 2032
- Table 52: Southeast Asia Dosimetry Equipment Industry Volume (K Unit) Forecast, by Application 2019 & 2032
- Table 53: Australia Dosimetry Equipment Industry Revenue (Million) Forecast, by Application 2019 & 2032
- Table 54: Australia Dosimetry Equipment Industry Volume (K Unit) Forecast, by Application 2019 & 2032
- Table 55: Indonesia Dosimetry Equipment Industry Revenue (Million) Forecast, by Application 2019 & 2032
- Table 56: Indonesia Dosimetry Equipment Industry Volume (K Unit) Forecast, by Application 2019 & 2032
- Table 57: Phillipes Dosimetry Equipment Industry Revenue (Million) Forecast, by Application 2019 & 2032
- Table 58: Phillipes Dosimetry Equipment Industry Volume (K Unit) Forecast, by Application 2019 & 2032
- Table 59: Singapore Dosimetry Equipment Industry Revenue (Million) Forecast, by Application 2019 & 2032
- Table 60: Singapore Dosimetry Equipment Industry Volume (K Unit) Forecast, by Application 2019 & 2032
- Table 61: Thailandc Dosimetry Equipment Industry Revenue (Million) Forecast, by Application 2019 & 2032
- Table 62: Thailandc Dosimetry Equipment Industry Volume (K Unit) Forecast, by Application 2019 & 2032
- Table 63: Rest of Asia Pacific Dosimetry Equipment Industry Revenue (Million) Forecast, by Application 2019 & 2032
- Table 64: Rest of Asia Pacific Dosimetry Equipment Industry Volume (K Unit) Forecast, by Application 2019 & 2032
- Table 65: Global Dosimetry Equipment Industry Revenue Million Forecast, by Country 2019 & 2032
- Table 66: Global Dosimetry Equipment Industry Volume K Unit Forecast, by Country 2019 & 2032
- Table 67: Brazil Dosimetry Equipment Industry Revenue (Million) Forecast, by Application 2019 & 2032
- Table 68: Brazil Dosimetry Equipment Industry Volume (K Unit) Forecast, by Application 2019 & 2032
- Table 69: Argentina Dosimetry Equipment Industry Revenue (Million) Forecast, by Application 2019 & 2032
- Table 70: Argentina Dosimetry Equipment Industry Volume (K Unit) Forecast, by Application 2019 & 2032
- Table 71: Peru Dosimetry Equipment Industry Revenue (Million) Forecast, by Application 2019 & 2032
- Table 72: Peru Dosimetry Equipment Industry Volume (K Unit) Forecast, by Application 2019 & 2032
- Table 73: Chile Dosimetry Equipment Industry Revenue (Million) Forecast, by Application 2019 & 2032
- Table 74: Chile Dosimetry Equipment Industry Volume (K Unit) Forecast, by Application 2019 & 2032
- Table 75: Colombia Dosimetry Equipment Industry Revenue (Million) Forecast, by Application 2019 & 2032
- Table 76: Colombia Dosimetry Equipment Industry Volume (K Unit) Forecast, by Application 2019 & 2032
- Table 77: Ecuador Dosimetry Equipment Industry Revenue (Million) Forecast, by Application 2019 & 2032
- Table 78: Ecuador Dosimetry Equipment Industry Volume (K Unit) Forecast, by Application 2019 & 2032
- Table 79: Venezuela Dosimetry Equipment Industry Revenue (Million) Forecast, by Application 2019 & 2032
- Table 80: Venezuela Dosimetry Equipment Industry Volume (K Unit) Forecast, by Application 2019 & 2032
- Table 81: Rest of South America Dosimetry Equipment Industry Revenue (Million) Forecast, by Application 2019 & 2032
- Table 82: Rest of South America Dosimetry Equipment Industry Volume (K Unit) Forecast, by Application 2019 & 2032
- Table 83: Global Dosimetry Equipment Industry Revenue Million Forecast, by Country 2019 & 2032
- Table 84: Global Dosimetry Equipment Industry Volume K Unit Forecast, by Country 2019 & 2032
- Table 85: United States Dosimetry Equipment Industry Revenue (Million) Forecast, by Application 2019 & 2032
- Table 86: United States Dosimetry Equipment Industry Volume (K Unit) Forecast, by Application 2019 & 2032
- Table 87: Canada Dosimetry Equipment Industry Revenue (Million) Forecast, by Application 2019 & 2032
- Table 88: Canada Dosimetry Equipment Industry Volume (K Unit) Forecast, by Application 2019 & 2032
- Table 89: Mexico Dosimetry Equipment Industry Revenue (Million) Forecast, by Application 2019 & 2032
- Table 90: Mexico Dosimetry Equipment Industry Volume (K Unit) Forecast, by Application 2019 & 2032
- Table 91: Global Dosimetry Equipment Industry Revenue Million Forecast, by Country 2019 & 2032
- Table 92: Global Dosimetry Equipment Industry Volume K Unit Forecast, by Country 2019 & 2032
- Table 93: United Arab Emirates Dosimetry Equipment Industry Revenue (Million) Forecast, by Application 2019 & 2032
- Table 94: United Arab Emirates Dosimetry Equipment Industry Volume (K Unit) Forecast, by Application 2019 & 2032
- Table 95: Saudi Arabia Dosimetry Equipment Industry Revenue (Million) Forecast, by Application 2019 & 2032
- Table 96: Saudi Arabia Dosimetry Equipment Industry Volume (K Unit) Forecast, by Application 2019 & 2032
- Table 97: South Africa Dosimetry Equipment Industry Revenue (Million) Forecast, by Application 2019 & 2032
- Table 98: South Africa Dosimetry Equipment Industry Volume (K Unit) Forecast, by Application 2019 & 2032
- Table 99: Rest of Middle East and Africa Dosimetry Equipment Industry Revenue (Million) Forecast, by Application 2019 & 2032
- Table 100: Rest of Middle East and Africa Dosimetry Equipment Industry Volume (K Unit) Forecast, by Application 2019 & 2032
- Table 101: Global Dosimetry Equipment Industry Revenue Million Forecast, by Type 2019 & 2032
- Table 102: Global Dosimetry Equipment Industry Volume K Unit Forecast, by Type 2019 & 2032
- Table 103: Global Dosimetry Equipment Industry Revenue Million Forecast, by Application 2019 & 2032
- Table 104: Global Dosimetry Equipment Industry Volume K Unit Forecast, by Application 2019 & 2032
- Table 105: Global Dosimetry Equipment Industry Revenue Million Forecast, by End-user Industry 2019 & 2032
- Table 106: Global Dosimetry Equipment Industry Volume K Unit Forecast, by End-user Industry 2019 & 2032
- Table 107: Global Dosimetry Equipment Industry Revenue Million Forecast, by Country 2019 & 2032
- Table 108: Global Dosimetry Equipment Industry Volume K Unit Forecast, by Country 2019 & 2032
- Table 109: Global Dosimetry Equipment Industry Revenue Million Forecast, by Type 2019 & 2032
- Table 110: Global Dosimetry Equipment Industry Volume K Unit Forecast, by Type 2019 & 2032
- Table 111: Global Dosimetry Equipment Industry Revenue Million Forecast, by Application 2019 & 2032
- Table 112: Global Dosimetry Equipment Industry Volume K Unit Forecast, by Application 2019 & 2032
- Table 113: Global Dosimetry Equipment Industry Revenue Million Forecast, by End-user Industry 2019 & 2032
- Table 114: Global Dosimetry Equipment Industry Volume K Unit Forecast, by End-user Industry 2019 & 2032
- Table 115: Global Dosimetry Equipment Industry Revenue Million Forecast, by Country 2019 & 2032
- Table 116: Global Dosimetry Equipment Industry Volume K Unit Forecast, by Country 2019 & 2032
- Table 117: Global Dosimetry Equipment Industry Revenue Million Forecast, by Type 2019 & 2032
- Table 118: Global Dosimetry Equipment Industry Volume K Unit Forecast, by Type 2019 & 2032
- Table 119: Global Dosimetry Equipment Industry Revenue Million Forecast, by Application 2019 & 2032
- Table 120: Global Dosimetry Equipment Industry Volume K Unit Forecast, by Application 2019 & 2032
- Table 121: Global Dosimetry Equipment Industry Revenue Million Forecast, by End-user Industry 2019 & 2032
- Table 122: Global Dosimetry Equipment Industry Volume K Unit Forecast, by End-user Industry 2019 & 2032
- Table 123: Global Dosimetry Equipment Industry Revenue Million Forecast, by Country 2019 & 2032
- Table 124: Global Dosimetry Equipment Industry Volume K Unit Forecast, by Country 2019 & 2032
- Table 125: Global Dosimetry Equipment Industry Revenue Million Forecast, by Type 2019 & 2032
- Table 126: Global Dosimetry Equipment Industry Volume K Unit Forecast, by Type 2019 & 2032
- Table 127: Global Dosimetry Equipment Industry Revenue Million Forecast, by Application 2019 & 2032
- Table 128: Global Dosimetry Equipment Industry Volume K Unit Forecast, by Application 2019 & 2032
- Table 129: Global Dosimetry Equipment Industry Revenue Million Forecast, by End-user Industry 2019 & 2032
- Table 130: Global Dosimetry Equipment Industry Volume K Unit Forecast, by End-user Industry 2019 & 2032
- Table 131: Global Dosimetry Equipment Industry Revenue Million Forecast, by Country 2019 & 2032
- Table 132: Global Dosimetry Equipment Industry Volume K Unit Forecast, by Country 2019 & 2032
- Table 133: Global Dosimetry Equipment Industry Revenue Million Forecast, by Type 2019 & 2032
- Table 134: Global Dosimetry Equipment Industry Volume K Unit Forecast, by Type 2019 & 2032
- Table 135: Global Dosimetry Equipment Industry Revenue Million Forecast, by Application 2019 & 2032
- Table 136: Global Dosimetry Equipment Industry Volume K Unit Forecast, by Application 2019 & 2032
- Table 137: Global Dosimetry Equipment Industry Revenue Million Forecast, by End-user Industry 2019 & 2032
- Table 138: Global Dosimetry Equipment Industry Volume K Unit Forecast, by End-user Industry 2019 & 2032
- Table 139: Global Dosimetry Equipment Industry Revenue Million Forecast, by Country 2019 & 2032
- Table 140: Global Dosimetry Equipment Industry Volume K Unit Forecast, by Country 2019 & 2032
- Table 141: Global Dosimetry Equipment Industry Revenue Million Forecast, by Type 2019 & 2032
- Table 142: Global Dosimetry Equipment Industry Volume K Unit Forecast, by Type 2019 & 2032
- Table 143: Global Dosimetry Equipment Industry Revenue Million Forecast, by Application 2019 & 2032
- Table 144: Global Dosimetry Equipment Industry Volume K Unit Forecast, by Application 2019 & 2032
- Table 145: Global Dosimetry Equipment Industry Revenue Million Forecast, by End-user Industry 2019 & 2032
- Table 146: Global Dosimetry Equipment Industry Volume K Unit Forecast, by End-user Industry 2019 & 2032
- Table 147: Global Dosimetry Equipment Industry Revenue Million Forecast, by Country 2019 & 2032
- Table 148: Global Dosimetry Equipment Industry Volume K Unit Forecast, by Country 2019 & 2032
Frequently Asked Questions
1. What is the projected Compound Annual Growth Rate (CAGR) of the Dosimetry Equipment Industry?
The projected CAGR is approximately 7.11%.
2. Which companies are prominent players in the Dosimetry Equipment Industry?
Key companies in the market include Tracerco Limited, SE International Inc, Fuji Electric Co Ltd, Thermo Fisher Scientific Inc, Automess - Automation and Measurement GmbH, Fortive Corporation, ATOMTEX, Mirion Technologies Inc, Radiation Detection Company Inc , Arrow-Tech Inc.
3. What are the main segments of the Dosimetry Equipment Industry?
The market segments include Type, Application, End-user Industry.
4. Can you provide details about the market size?
The market size is estimated to be USD 3.65 Million as of 2022.
5. What are some drivers contributing to market growth?
Growing Demand for Radiation and Monitoring Devices Across the Medical Sector; Rising Application of Radioactive Substances Across the Industrial Sector.
6. What are the notable trends driving market growth?
Rising Application of Radioactive Substances Across the Industrial Sector Drives the Market.
7. Are there any restraints impacting market growth?
Product Accuracy. Stringent Government Regulations. and High Costs.
8. Can you provide examples of recent developments in the market?
September 2022: Hungary's ELKH Center for Energy Research (CER) Space Research Division developed a dosimeter to assist in the construction of the initial US lunar colony. This dosimeter can also be utilized to investigate the initial flight of NASA's Artemis program. The project aims to provide crucial information on the cosmic radiation field for the development of human spacecraft, lunar orbiting satellite stations, and lunar outposts in the future.
9. What pricing options are available for accessing the report?
Pricing options include single-user, multi-user, and enterprise licenses priced at USD 4750, USD 5250, and USD 8750 respectively.
10. Is the market size provided in terms of value or volume?
The market size is provided in terms of value, measured in Million and volume, measured in K Unit.
11. Are there any specific market keywords associated with the report?
Yes, the market keyword associated with the report is "Dosimetry Equipment Industry," which aids in identifying and referencing the specific market segment covered.
12. How do I determine which pricing option suits my needs best?
The pricing options vary based on user requirements and access needs. Individual users may opt for single-user licenses, while businesses requiring broader access may choose multi-user or enterprise licenses for cost-effective access to the report.
13. Are there any additional resources or data provided in the Dosimetry Equipment Industry report?
While the report offers comprehensive insights, it's advisable to review the specific contents or supplementary materials provided to ascertain if additional resources or data are available.
14. How can I stay updated on further developments or reports in the Dosimetry Equipment Industry?
To stay informed about further developments, trends, and reports in the Dosimetry Equipment Industry, consider subscribing to industry newsletters, following relevant companies and organizations, or regularly checking reputable industry news sources and publications.
Methodology
Step 1 - Identification of Relevant Samples Size from Population Database


Step 2 - Approaches for Defining Global Market Size (Value, Volume* & Price*)

Note*: In applicable scenarios
Step 3 - Data Sources
Primary Research
- Web Analytics
- Survey Reports
- Research Institute
- Latest Research Reports
- Opinion Leaders
Secondary Research
- Annual Reports
- White Paper
- Latest Press Release
- Industry Association
- Paid Database
- Investor Presentations

Step 4 - Data Triangulation
Involves using different sources of information in order to increase the validity of a study
These sources are likely to be stakeholders in a program - participants, other researchers, program staff, other community members, and so on.
Then we put all data in single framework & apply various statistical tools to find out the dynamic on the market.
During the analysis stage, feedback from the stakeholder groups would be compared to determine areas of agreement as well as areas of divergence


