

Key Insights
The global Dronabinol market is poised for significant growth, projected to reach an estimated $267 million in 2025 and expand at a robust Compound Annual Growth Rate (CAGR) of 6.6% through 2033. This upward trajectory is primarily fueled by the increasing acceptance and therapeutic applications of Dronabinol in managing chronic pain, nausea, and vomiting associated with chemotherapy, as well as its potential in treating conditions like HIV/AIDS-related anorexia and certain neurological disorders. The growing body of research validating its efficacy and safety, coupled with a favorable regulatory landscape in various regions, is acting as a major catalyst for market expansion. Furthermore, advancements in synthetic production methods are improving accessibility and reducing manufacturing costs, thereby driving demand.

Dronabinol Market Size (In Million)
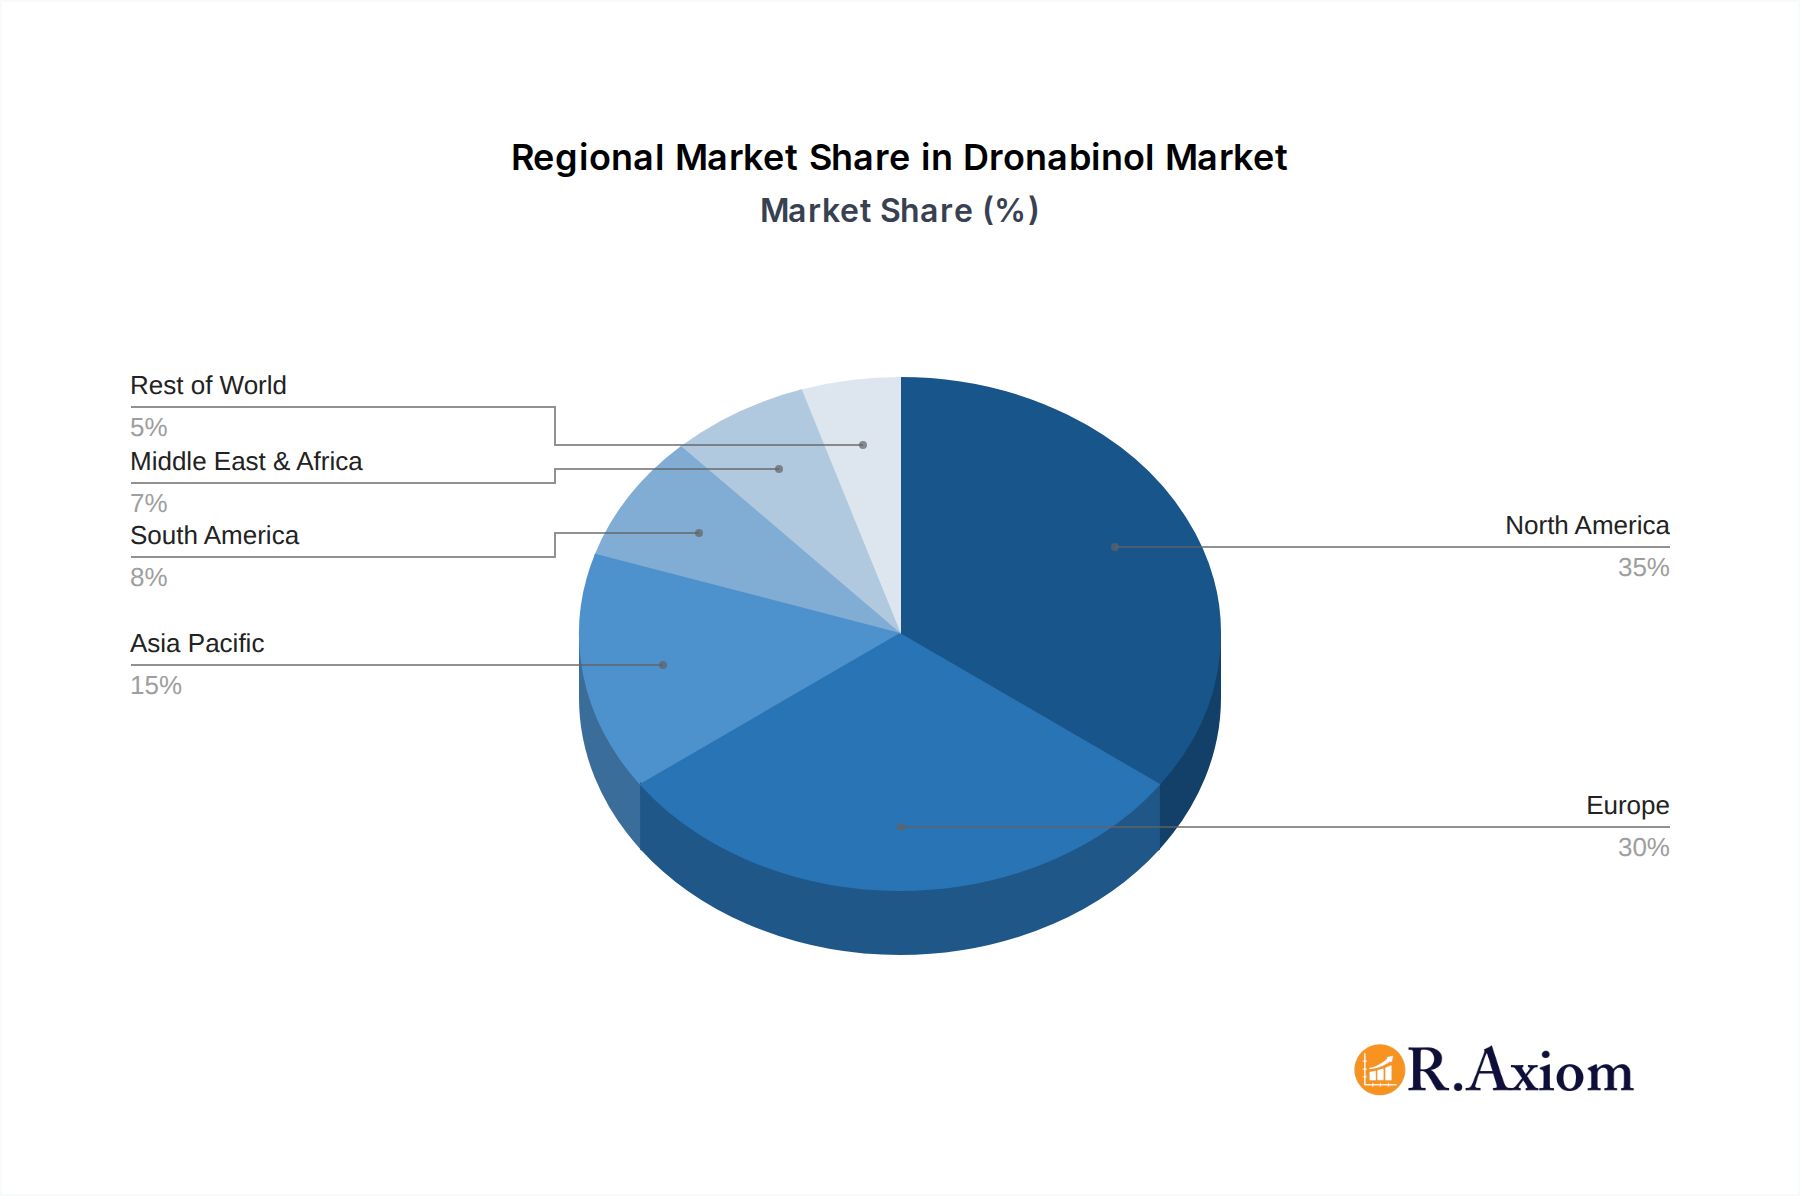
The market is segmented by application into Capsules and Oral Liquids, with both formats experiencing steady demand due to patient preference and therapeutic requirements. The types of Dronabinol, namely Synthetic and Natural Dronabinol, also present distinct market dynamics, with synthetic variants generally dominating due to scalability and cost-effectiveness. Geographically, North America is expected to lead the market, driven by established healthcare infrastructure and progressive policies regarding cannabinoid-based therapeutics. Europe also represents a substantial market, with growing awareness and research initiatives. Emerging economies in the Asia Pacific and other regions are anticipated to contribute to the market's future growth as regulatory frameworks evolve and access to medical cannabis expands. Key players are actively engaged in research and development, strategic partnerships, and capacity expansion to capitalize on these burgeoning opportunities.

Dronabinol Company Market Share
Dronabinol Market Concentration & Innovation
The global dronabinol market exhibits a moderate concentration, with key players like Canopy Growth, Noramco, KinetoChem, Entourage Phytolab, THC Pharm, Echo Pharmaceuticals, BOL Pharma, Aphios Corporation, and Benuvia Manufacturing dominating significant market shares, estimated to collectively hold over 800 million of the market value. Innovation is a primary driver, fueled by ongoing research into dronabinol's therapeutic applications beyond its established roles. Advancements in synthetic dronabinol production technologies are enhancing purity and scalability, while research into natural dronabinol extraction is exploring more sustainable and cost-effective methods. Regulatory frameworks remain crucial, with evolving guidelines for pharmaceutical-grade cannabinoid production and approval processes influencing market entry and product development. The threat of product substitutes, while present from other cannabinoid compounds and synthetic analgesics, is mitigated by dronabinol's proven efficacy and specific therapeutic indications. End-user trends are leaning towards improved delivery mechanisms, with a growing demand for capsule and oral liquid formulations offering enhanced patient compliance and bioavailability. Mergers and acquisitions (M&A) activity is anticipated to increase as companies seek to consolidate their market positions and acquire specialized expertise. Notably, M&A deals in the cannabis pharmaceutical sector have seen values in the hundreds of millions, with potential for further consolidation to reach an estimated 500 million in deal values over the forecast period.
Dronabinol Industry Trends & Insights
The dronabinol industry is poised for significant expansion, driven by a confluence of factors that underscore its growing importance in pharmaceutical applications. The compound annual growth rate (CAGR) for the global dronabinol market is projected to be robust, estimated at 12.5% from 2025 to 2033, reaching an estimated market size of 7,500 million by the end of the forecast period. This upward trajectory is largely attributable to increasing clinical evidence supporting dronabinol's efficacy in managing conditions such as chemotherapy-induced nausea and vomiting (CINV), AIDS-related anorexia, and certain pain management scenarios. The growing acceptance and legalization of medical cannabis in various regions worldwide are creating fertile ground for dronabinol-based pharmaceuticals, directly impacting market penetration, which is expected to reach 25% by 2033.
Technological disruptions are playing a pivotal role, particularly in the refinement of extraction and synthesis processes. Innovations in synthetic dronabinol production are leading to higher yields, greater purity, and reduced manufacturing costs, making it more accessible for pharmaceutical development. Concurrently, advancements in natural dronabinol isolation techniques are enabling more efficient and sustainable sourcing, catering to a segment of the market that prefers naturally derived compounds. These technological leaps are crucial for meeting the projected demand, which is anticipated to grow from 2,000 million in 2025 to over 7,500 million by 2033.
Consumer preferences are evolving, with a distinct shift towards specialized medical applications and patient-centric formulations. The demand for convenient and easily administrable forms like capsules and oral liquids is escalating. Pharmaceutical companies are responding by investing in research and development for novel drug delivery systems that enhance dronabinol's therapeutic profile, including improved bioavailability and controlled release mechanisms. This focus on patient outcomes is a key differentiator and a significant driver of market growth.
Competitive dynamics within the dronabinol market are intensifying. Established pharmaceutical companies are increasingly investing in cannabinoid-based therapeutics, while emerging players are focusing on niche applications and innovative formulations. Strategic partnerships and collaborations between research institutions, biotechnology firms, and established pharmaceutical manufacturers are becoming more prevalent, fostering a collaborative ecosystem for innovation and market expansion. The global market valuation is estimated to grow from 2,500 million in 2024 to 7,500 million by 2033, reflecting this dynamic competitive landscape.
Dominant Markets & Segments in Dronabinol
The global dronabinol market demonstrates a clear dominance in specific regions and product segments, reflecting varied regulatory landscapes, healthcare infrastructure, and consumer demand. North America, particularly the United States, stands as the leading market, with an estimated market share of 45% in 2025, driven by its progressive regulatory framework for medical cannabis and a well-established pharmaceutical industry. The economic policies supporting research and development, coupled with advanced healthcare infrastructure, contribute significantly to this dominance. The country's market value is projected to reach 3,375 million by 2025.
Within the product types, Synthetic Dronabinol currently holds a commanding position, estimated at 70% of the market in 2025, valued at 1,750 million. This dominance is attributed to its consistent purity, scalability, and easier regulatory approval pathways for pharmaceutical applications compared to natural extracts. Manufacturers like Noramco and KinetoChem have invested heavily in optimizing synthetic production. However, Natural Dronabinol is projected to witness a higher CAGR, driven by consumer preference for natural products and ongoing advancements in extraction technologies, potentially capturing 30% of the market by 2033.
In terms of applications, Capsule formulations represent the largest segment, accounting for an estimated 55% of the market in 2025, valued at 1,375 million. This preference stems from their ease of use, accurate dosage control, and patient compliance, making them ideal for chronic conditions. Oral Liquid formulations follow, holding an estimated 35% share in 2025, valued at 875 million. Oral liquids offer flexibility in dosing and are beneficial for patients with swallowing difficulties. The market for oral liquids is expected to grow at a CAGR of 13%, driven by improved taste masking and faster absorption rates, projected to reach 2,000 million by 2033.
The forecast period of 2025–2033 will likely see a gradual shift, with Natural Dronabinol and Oral Liquid formulations gaining traction due to evolving consumer demands and technological advancements. Europe, with its expanding medical cannabis programs and stringent quality control standards, is emerging as a significant growth region, projected to capture 25% of the global market by 2033, with an estimated market value of 1,875 million. Asia Pacific, though nascent, is anticipated to exhibit the highest CAGR, driven by increasing legalization and research initiatives, reaching an estimated 1,125 million by 2033.
Dronabinol Product Developments
Dronabinol product development is increasingly focused on enhancing therapeutic efficacy and patient experience. Innovations include the development of novel oral liquid formulations with improved palatability and faster onset of action, alongside advanced capsule designs offering controlled release profiles. Companies are exploring synergistic combinations with other cannabinoids to optimize pain management and anti-emetic effects. Competitive advantages are being forged through superior bioavailability, reduced side effects, and more convenient dosing schedules, aiming to capture a larger share of the medical cannabis pharmaceutical market, projected to reach 7,500 million by 2033.
Report Scope & Segmentation Analysis
This report encompasses a comprehensive analysis of the global dronabinol market, segmented by Application and Type. The Application segmentation includes Capsule and Oral Liquid formulations. The Capsule segment, projected to reach 4,125 million by 2033, benefits from established patient preference and pharmaceutical familiarity. The Oral Liquid segment, estimated at 2,700 million by 2033, is poised for significant growth due to its flexibility and potential for enhanced bioavailability.
The Type segmentation comprises Synthetic Dronabinol and Natural Dronabinol. Synthetic Dronabinol, estimated at 5,250 million by 2033, continues to lead due to its purity and manufacturing scalability. Natural Dronabinol, projected to reach 2,250 million by 2033, is gaining traction driven by consumer demand for natural products and advancements in extraction. The competitive landscape within each segment is characterized by a mix of established pharmaceutical giants and specialized cannabinoid companies.
Key Drivers of Dronabinol Growth
The growth of the dronabinol market is propelled by several key factors. Increasing medical acceptance and legalization of cannabis-based therapies globally is a primary driver, expanding the therapeutic landscape for dronabinol. For instance, the approval of dronabinol for CINV in numerous countries has significantly boosted demand. Technological advancements in synthesis and extraction are crucial, enabling higher purity, better yield, and cost-effectiveness, thereby increasing market accessibility. The growing body of clinical research demonstrating dronabinol's efficacy in managing various medical conditions, from chronic pain to neurological disorders, further fuels market expansion. Furthermore, evolving consumer preferences for natural products are creating opportunities for natural dronabinol, while advancements in pharmaceutical formulations like capsules and oral liquids enhance patient compliance and therapeutic outcomes, contributing to the projected 12.5% CAGR.
Challenges in the Dronabinol Sector
Despite its growth potential, the dronabinol sector faces significant challenges. Stringent and fragmented regulatory frameworks across different jurisdictions create complexities for market entry and product approval, leading to significant delays and increased compliance costs. The high cost of pharmaceutical-grade production and stringent quality control measures can limit affordability and accessibility for some patient populations. Supply chain volatility, particularly for natural dronabinol sourcing, and potential shortages of active pharmaceutical ingredients (APIs) can disrupt production and distribution. Moreover, public perception and stigma associated with cannabis-derived products, although diminishing, can still act as a restraint. Lastly, intense competition from alternative therapeutic agents, including synthetic cannabinoids and other pain management pharmaceuticals, necessitates continuous innovation and differentiation to maintain market share.
Emerging Opportunities in Dronabinol
Emerging opportunities in the dronabinol market lie in several key areas. Expansion into new therapeutic indications through ongoing clinical research holds significant promise, particularly in areas like epilepsy, inflammatory bowel disease, and mental health disorders, potentially adding 1,000 million in market value. The development of novel drug delivery systems, such as transdermal patches or inhaled formulations, can cater to unmet patient needs and improve therapeutic outcomes. Geographical expansion into emerging markets with favorable regulatory changes for medical cannabis presents a substantial growth avenue. Furthermore, the increasing demand for high-purity synthetic dronabinol for pharmaceutical applications, driven by stringent quality standards, offers opportunities for specialized manufacturers. The growing interest in cannabinoid-based combination therapies also presents an avenue for innovative product development, potentially creating new market segments valued at 500 million.
Leading Players in the Dronabinol Market
- Canopy Growth
- Noramco
- KinetoChem
- Entourage Phytolab
- THC Pharm
- Echo Pharmaceuticals
- BOL Pharma
- Aphios Corporation
- Benuvia Manufacturing
Key Developments in Dronabinol Industry
- 2023 Q4: Canopy Growth announced advancements in its pharmaceutical-grade cannabinoid production, focusing on increased scalability of synthetic dronabinol.
- 2024 Q1: Noramco invested in expanding its API manufacturing capacity to meet the growing global demand for dronabinol.
- 2024 Q2: KinetoChem introduced a novel purification process for synthetic dronabinol, achieving unprecedented levels of purity.
- 2024 Q3: Entourage Phytolab secured regulatory approval for a new oral liquid dronabinol formulation with enhanced bioavailability.
- 2024 Q4: THC Pharm launched a clinical trial for dronabinol in the management of specific neurological conditions.
- 2025 Q1: Echo Pharmaceuticals announced a strategic partnership to explore the development of natural dronabinol-based therapeutics.
- 2025 Q2: BOL Pharma received expanded indications for its dronabinol capsules in several European markets.
- 2025 Q3: Aphios Corporation reported positive preclinical results for dronabinol in pain management applications.
- 2025 Q4: Benuvia Manufacturing announced the acquisition of a specialized facility to ramp up dronabinol API production.
Strategic Outlook for Dronabinol Market
The strategic outlook for the dronabinol market is overwhelmingly positive, driven by robust growth catalysts. The continued legalization and medical acceptance of cannabis-derived therapies worldwide will open new markets and therapeutic avenues. Technological advancements in both synthetic and natural dronabinol production will enhance efficiency, reduce costs, and improve product quality, making it more accessible. Furthermore, the increasing investment in clinical research validating dronabinol's efficacy across a broader spectrum of conditions, coupled with the development of innovative drug delivery systems, will solidify its position in the pharmaceutical landscape. The market is expected to see sustained growth from 2,500 million in 2024 to an estimated 7,500 million by 2033, fueled by these strategic imperatives and a growing demand for cannabinoid-based therapeutics.
Dronabinol Segmentation
-
1. Application
- 1.1. Capsule
- 1.2. Oral Liquid
-
2. Types
- 2.1. Synthetic Dronabinol
- 2.2. Natural Dronabinol
Dronabinol Segmentation By Geography
-
1. North America
- 1.1. United States
- 1.2. Canada
- 1.3. Mexico
-
2. South America
- 2.1. Brazil
- 2.2. Argentina
- 2.3. Rest of South America
-
3. Europe
- 3.1. United Kingdom
- 3.2. Germany
- 3.3. France
- 3.4. Italy
- 3.5. Spain
- 3.6. Russia
- 3.7. Benelux
- 3.8. Nordics
- 3.9. Rest of Europe
-
4. Middle East & Africa
- 4.1. Turkey
- 4.2. Israel
- 4.3. GCC
- 4.4. North Africa
- 4.5. South Africa
- 4.6. Rest of Middle East & Africa
-
5. Asia Pacific
- 5.1. China
- 5.2. India
- 5.3. Japan
- 5.4. South Korea
- 5.5. ASEAN
- 5.6. Oceania
- 5.7. Rest of Asia Pacific
Dronabinol Regional Market Share
Geographic Coverage of Dronabinol
Dronabinol REPORT HIGHLIGHTS
| Aspects | Details |
|---|---|
| Study Period | 2020-2034 |
| Base Year | 2025 |
| Estimated Year | 2026 |
| Forecast Period | 2026-2034 |
| Historical Period | 2020-2025 |
| Growth Rate | CAGR of 6.4% from 2020-2034 |
| Segmentation |
|
Table of Contents
- 1. Introduction
- 1.1. Research Scope
- 1.2. Market Segmentation
- 1.3. Research Objective
- 1.4. Definitions and Assumptions
- 2. Executive Summary
- 2.1. Market Snapshot
- 3. Market Dynamics
- 3.1. Market Drivers
- 3.2. Market Restrains
- 3.3. Market Trends
- 3.4. Market Opportunities
- 4. Market Factor Analysis
- 4.1. Porters Five Forces
- 4.1.1. Bargaining Power of Suppliers
- 4.1.2. Bargaining Power of Buyers
- 4.1.3. Threat of New Entrants
- 4.1.4. Threat of Substitutes
- 4.1.5. Competitive Rivalry
- 4.2. PESTEL analysis
- 4.3. BCG Analysis
- 4.3.1. Stars (High Growth, High Market Share)
- 4.3.2. Cash Cows (Low Growth, High Market Share)
- 4.3.3. Question Mark (High Growth, Low Market Share)
- 4.3.4. Dogs (Low Growth, Low Market Share)
- 4.4. Ansoff Matrix Analysis
- 4.5. Supply Chain Analysis
- 4.6. Regulatory Landscape
- 4.7. Current Market Potential and Opportunity Assessment (TAM–SAM–SOM Framework)
- 4.8. RAX Analyst Note
- 4.1. Porters Five Forces
- 5. Market Analysis, Insights and Forecast 2021-2033
- 5.1. Market Analysis, Insights and Forecast - by Application
- 5.1.1. Capsule
- 5.1.2. Oral Liquid
- 5.2. Market Analysis, Insights and Forecast - by Types
- 5.2.1. Synthetic Dronabinol
- 5.2.2. Natural Dronabinol
- 5.3. Market Analysis, Insights and Forecast - by Region
- 5.3.1. North America
- 5.3.2. South America
- 5.3.3. Europe
- 5.3.4. Middle East & Africa
- 5.3.5. Asia Pacific
- 5.1. Market Analysis, Insights and Forecast - by Application
- 6. Global Dronabinol Analysis, Insights and Forecast, 2021-2033
- 6.1. Market Analysis, Insights and Forecast - by Application
- 6.1.1. Capsule
- 6.1.2. Oral Liquid
- 6.2. Market Analysis, Insights and Forecast - by Types
- 6.2.1. Synthetic Dronabinol
- 6.2.2. Natural Dronabinol
- 6.1. Market Analysis, Insights and Forecast - by Application
- 7. North America Dronabinol Analysis, Insights and Forecast, 2020-2032
- 7.1. Market Analysis, Insights and Forecast - by Application
- 7.1.1. Capsule
- 7.1.2. Oral Liquid
- 7.2. Market Analysis, Insights and Forecast - by Types
- 7.2.1. Synthetic Dronabinol
- 7.2.2. Natural Dronabinol
- 7.1. Market Analysis, Insights and Forecast - by Application
- 8. South America Dronabinol Analysis, Insights and Forecast, 2020-2032
- 8.1. Market Analysis, Insights and Forecast - by Application
- 8.1.1. Capsule
- 8.1.2. Oral Liquid
- 8.2. Market Analysis, Insights and Forecast - by Types
- 8.2.1. Synthetic Dronabinol
- 8.2.2. Natural Dronabinol
- 8.1. Market Analysis, Insights and Forecast - by Application
- 9. Europe Dronabinol Analysis, Insights and Forecast, 2020-2032
- 9.1. Market Analysis, Insights and Forecast - by Application
- 9.1.1. Capsule
- 9.1.2. Oral Liquid
- 9.2. Market Analysis, Insights and Forecast - by Types
- 9.2.1. Synthetic Dronabinol
- 9.2.2. Natural Dronabinol
- 9.1. Market Analysis, Insights and Forecast - by Application
- 10. Middle East & Africa Dronabinol Analysis, Insights and Forecast, 2020-2032
- 10.1. Market Analysis, Insights and Forecast - by Application
- 10.1.1. Capsule
- 10.1.2. Oral Liquid
- 10.2. Market Analysis, Insights and Forecast - by Types
- 10.2.1. Synthetic Dronabinol
- 10.2.2. Natural Dronabinol
- 10.1. Market Analysis, Insights and Forecast - by Application
- 11. Asia Pacific Dronabinol Analysis, Insights and Forecast, 2020-2032
- 11.1. Market Analysis, Insights and Forecast - by Application
- 11.1.1. Capsule
- 11.1.2. Oral Liquid
- 11.2. Market Analysis, Insights and Forecast - by Types
- 11.2.1. Synthetic Dronabinol
- 11.2.2. Natural Dronabinol
- 11.1. Market Analysis, Insights and Forecast - by Application
- 12. Competitive Analysis
- 12.1. Company Profiles
- 12.1.1 Canopy Growth
- 12.1.1.1. Company Overview
- 12.1.1.2. Products
- 12.1.1.3. Company Financials
- 12.1.1.4. SWOT Analysis
- 12.1.2 Noramco
- 12.1.2.1. Company Overview
- 12.1.2.2. Products
- 12.1.2.3. Company Financials
- 12.1.2.4. SWOT Analysis
- 12.1.3 KinetoChem
- 12.1.3.1. Company Overview
- 12.1.3.2. Products
- 12.1.3.3. Company Financials
- 12.1.3.4. SWOT Analysis
- 12.1.4 Entourage Phytolab
- 12.1.4.1. Company Overview
- 12.1.4.2. Products
- 12.1.4.3. Company Financials
- 12.1.4.4. SWOT Analysis
- 12.1.5 THC Pharm
- 12.1.5.1. Company Overview
- 12.1.5.2. Products
- 12.1.5.3. Company Financials
- 12.1.5.4. SWOT Analysis
- 12.1.6 Echo Pharmaceuticals
- 12.1.6.1. Company Overview
- 12.1.6.2. Products
- 12.1.6.3. Company Financials
- 12.1.6.4. SWOT Analysis
- 12.1.7 BOL Pharma
- 12.1.7.1. Company Overview
- 12.1.7.2. Products
- 12.1.7.3. Company Financials
- 12.1.7.4. SWOT Analysis
- 12.1.8 Aphios Corporation
- 12.1.8.1. Company Overview
- 12.1.8.2. Products
- 12.1.8.3. Company Financials
- 12.1.8.4. SWOT Analysis
- 12.1.9 Benuvia Manufacturing
- 12.1.9.1. Company Overview
- 12.1.9.2. Products
- 12.1.9.3. Company Financials
- 12.1.9.4. SWOT Analysis
- 12.1.1 Canopy Growth
- 12.2. Market Entropy
- 12.2.1 Company's Key Areas Served
- 12.2.2 Recent Developments
- 12.3. Company Market Share Analysis 2025
- 12.3.1 Top 5 Companies Market Share Analysis
- 12.3.2 Top 3 Companies Market Share Analysis
- 12.4. List of Potential Customers
- 13. Research Methodology
List of Figures
- Figure 1: Global Dronabinol Revenue Breakdown (billion, %) by Region 2025 & 2033
- Figure 2: Global Dronabinol Volume Breakdown (K, %) by Region 2025 & 2033
- Figure 3: North America Dronabinol Revenue (billion), by Application 2025 & 2033
- Figure 4: North America Dronabinol Volume (K), by Application 2025 & 2033
- Figure 5: North America Dronabinol Revenue Share (%), by Application 2025 & 2033
- Figure 6: North America Dronabinol Volume Share (%), by Application 2025 & 2033
- Figure 7: North America Dronabinol Revenue (billion), by Types 2025 & 2033
- Figure 8: North America Dronabinol Volume (K), by Types 2025 & 2033
- Figure 9: North America Dronabinol Revenue Share (%), by Types 2025 & 2033
- Figure 10: North America Dronabinol Volume Share (%), by Types 2025 & 2033
- Figure 11: North America Dronabinol Revenue (billion), by Country 2025 & 2033
- Figure 12: North America Dronabinol Volume (K), by Country 2025 & 2033
- Figure 13: North America Dronabinol Revenue Share (%), by Country 2025 & 2033
- Figure 14: North America Dronabinol Volume Share (%), by Country 2025 & 2033
- Figure 15: South America Dronabinol Revenue (billion), by Application 2025 & 2033
- Figure 16: South America Dronabinol Volume (K), by Application 2025 & 2033
- Figure 17: South America Dronabinol Revenue Share (%), by Application 2025 & 2033
- Figure 18: South America Dronabinol Volume Share (%), by Application 2025 & 2033
- Figure 19: South America Dronabinol Revenue (billion), by Types 2025 & 2033
- Figure 20: South America Dronabinol Volume (K), by Types 2025 & 2033
- Figure 21: South America Dronabinol Revenue Share (%), by Types 2025 & 2033
- Figure 22: South America Dronabinol Volume Share (%), by Types 2025 & 2033
- Figure 23: South America Dronabinol Revenue (billion), by Country 2025 & 2033
- Figure 24: South America Dronabinol Volume (K), by Country 2025 & 2033
- Figure 25: South America Dronabinol Revenue Share (%), by Country 2025 & 2033
- Figure 26: South America Dronabinol Volume Share (%), by Country 2025 & 2033
- Figure 27: Europe Dronabinol Revenue (billion), by Application 2025 & 2033
- Figure 28: Europe Dronabinol Volume (K), by Application 2025 & 2033
- Figure 29: Europe Dronabinol Revenue Share (%), by Application 2025 & 2033
- Figure 30: Europe Dronabinol Volume Share (%), by Application 2025 & 2033
- Figure 31: Europe Dronabinol Revenue (billion), by Types 2025 & 2033
- Figure 32: Europe Dronabinol Volume (K), by Types 2025 & 2033
- Figure 33: Europe Dronabinol Revenue Share (%), by Types 2025 & 2033
- Figure 34: Europe Dronabinol Volume Share (%), by Types 2025 & 2033
- Figure 35: Europe Dronabinol Revenue (billion), by Country 2025 & 2033
- Figure 36: Europe Dronabinol Volume (K), by Country 2025 & 2033
- Figure 37: Europe Dronabinol Revenue Share (%), by Country 2025 & 2033
- Figure 38: Europe Dronabinol Volume Share (%), by Country 2025 & 2033
- Figure 39: Middle East & Africa Dronabinol Revenue (billion), by Application 2025 & 2033
- Figure 40: Middle East & Africa Dronabinol Volume (K), by Application 2025 & 2033
- Figure 41: Middle East & Africa Dronabinol Revenue Share (%), by Application 2025 & 2033
- Figure 42: Middle East & Africa Dronabinol Volume Share (%), by Application 2025 & 2033
- Figure 43: Middle East & Africa Dronabinol Revenue (billion), by Types 2025 & 2033
- Figure 44: Middle East & Africa Dronabinol Volume (K), by Types 2025 & 2033
- Figure 45: Middle East & Africa Dronabinol Revenue Share (%), by Types 2025 & 2033
- Figure 46: Middle East & Africa Dronabinol Volume Share (%), by Types 2025 & 2033
- Figure 47: Middle East & Africa Dronabinol Revenue (billion), by Country 2025 & 2033
- Figure 48: Middle East & Africa Dronabinol Volume (K), by Country 2025 & 2033
- Figure 49: Middle East & Africa Dronabinol Revenue Share (%), by Country 2025 & 2033
- Figure 50: Middle East & Africa Dronabinol Volume Share (%), by Country 2025 & 2033
- Figure 51: Asia Pacific Dronabinol Revenue (billion), by Application 2025 & 2033
- Figure 52: Asia Pacific Dronabinol Volume (K), by Application 2025 & 2033
- Figure 53: Asia Pacific Dronabinol Revenue Share (%), by Application 2025 & 2033
- Figure 54: Asia Pacific Dronabinol Volume Share (%), by Application 2025 & 2033
- Figure 55: Asia Pacific Dronabinol Revenue (billion), by Types 2025 & 2033
- Figure 56: Asia Pacific Dronabinol Volume (K), by Types 2025 & 2033
- Figure 57: Asia Pacific Dronabinol Revenue Share (%), by Types 2025 & 2033
- Figure 58: Asia Pacific Dronabinol Volume Share (%), by Types 2025 & 2033
- Figure 59: Asia Pacific Dronabinol Revenue (billion), by Country 2025 & 2033
- Figure 60: Asia Pacific Dronabinol Volume (K), by Country 2025 & 2033
- Figure 61: Asia Pacific Dronabinol Revenue Share (%), by Country 2025 & 2033
- Figure 62: Asia Pacific Dronabinol Volume Share (%), by Country 2025 & 2033
List of Tables
- Table 1: Global Dronabinol Revenue billion Forecast, by Application 2020 & 2033
- Table 2: Global Dronabinol Volume K Forecast, by Application 2020 & 2033
- Table 3: Global Dronabinol Revenue billion Forecast, by Types 2020 & 2033
- Table 4: Global Dronabinol Volume K Forecast, by Types 2020 & 2033
- Table 5: Global Dronabinol Revenue billion Forecast, by Region 2020 & 2033
- Table 6: Global Dronabinol Volume K Forecast, by Region 2020 & 2033
- Table 7: Global Dronabinol Revenue billion Forecast, by Application 2020 & 2033
- Table 8: Global Dronabinol Volume K Forecast, by Application 2020 & 2033
- Table 9: Global Dronabinol Revenue billion Forecast, by Types 2020 & 2033
- Table 10: Global Dronabinol Volume K Forecast, by Types 2020 & 2033
- Table 11: Global Dronabinol Revenue billion Forecast, by Country 2020 & 2033
- Table 12: Global Dronabinol Volume K Forecast, by Country 2020 & 2033
- Table 13: United States Dronabinol Revenue (billion) Forecast, by Application 2020 & 2033
- Table 14: United States Dronabinol Volume (K) Forecast, by Application 2020 & 2033
- Table 15: Canada Dronabinol Revenue (billion) Forecast, by Application 2020 & 2033
- Table 16: Canada Dronabinol Volume (K) Forecast, by Application 2020 & 2033
- Table 17: Mexico Dronabinol Revenue (billion) Forecast, by Application 2020 & 2033
- Table 18: Mexico Dronabinol Volume (K) Forecast, by Application 2020 & 2033
- Table 19: Global Dronabinol Revenue billion Forecast, by Application 2020 & 2033
- Table 20: Global Dronabinol Volume K Forecast, by Application 2020 & 2033
- Table 21: Global Dronabinol Revenue billion Forecast, by Types 2020 & 2033
- Table 22: Global Dronabinol Volume K Forecast, by Types 2020 & 2033
- Table 23: Global Dronabinol Revenue billion Forecast, by Country 2020 & 2033
- Table 24: Global Dronabinol Volume K Forecast, by Country 2020 & 2033
- Table 25: Brazil Dronabinol Revenue (billion) Forecast, by Application 2020 & 2033
- Table 26: Brazil Dronabinol Volume (K) Forecast, by Application 2020 & 2033
- Table 27: Argentina Dronabinol Revenue (billion) Forecast, by Application 2020 & 2033
- Table 28: Argentina Dronabinol Volume (K) Forecast, by Application 2020 & 2033
- Table 29: Rest of South America Dronabinol Revenue (billion) Forecast, by Application 2020 & 2033
- Table 30: Rest of South America Dronabinol Volume (K) Forecast, by Application 2020 & 2033
- Table 31: Global Dronabinol Revenue billion Forecast, by Application 2020 & 2033
- Table 32: Global Dronabinol Volume K Forecast, by Application 2020 & 2033
- Table 33: Global Dronabinol Revenue billion Forecast, by Types 2020 & 2033
- Table 34: Global Dronabinol Volume K Forecast, by Types 2020 & 2033
- Table 35: Global Dronabinol Revenue billion Forecast, by Country 2020 & 2033
- Table 36: Global Dronabinol Volume K Forecast, by Country 2020 & 2033
- Table 37: United Kingdom Dronabinol Revenue (billion) Forecast, by Application 2020 & 2033
- Table 38: United Kingdom Dronabinol Volume (K) Forecast, by Application 2020 & 2033
- Table 39: Germany Dronabinol Revenue (billion) Forecast, by Application 2020 & 2033
- Table 40: Germany Dronabinol Volume (K) Forecast, by Application 2020 & 2033
- Table 41: France Dronabinol Revenue (billion) Forecast, by Application 2020 & 2033
- Table 42: France Dronabinol Volume (K) Forecast, by Application 2020 & 2033
- Table 43: Italy Dronabinol Revenue (billion) Forecast, by Application 2020 & 2033
- Table 44: Italy Dronabinol Volume (K) Forecast, by Application 2020 & 2033
- Table 45: Spain Dronabinol Revenue (billion) Forecast, by Application 2020 & 2033
- Table 46: Spain Dronabinol Volume (K) Forecast, by Application 2020 & 2033
- Table 47: Russia Dronabinol Revenue (billion) Forecast, by Application 2020 & 2033
- Table 48: Russia Dronabinol Volume (K) Forecast, by Application 2020 & 2033
- Table 49: Benelux Dronabinol Revenue (billion) Forecast, by Application 2020 & 2033
- Table 50: Benelux Dronabinol Volume (K) Forecast, by Application 2020 & 2033
- Table 51: Nordics Dronabinol Revenue (billion) Forecast, by Application 2020 & 2033
- Table 52: Nordics Dronabinol Volume (K) Forecast, by Application 2020 & 2033
- Table 53: Rest of Europe Dronabinol Revenue (billion) Forecast, by Application 2020 & 2033
- Table 54: Rest of Europe Dronabinol Volume (K) Forecast, by Application 2020 & 2033
- Table 55: Global Dronabinol Revenue billion Forecast, by Application 2020 & 2033
- Table 56: Global Dronabinol Volume K Forecast, by Application 2020 & 2033
- Table 57: Global Dronabinol Revenue billion Forecast, by Types 2020 & 2033
- Table 58: Global Dronabinol Volume K Forecast, by Types 2020 & 2033
- Table 59: Global Dronabinol Revenue billion Forecast, by Country 2020 & 2033
- Table 60: Global Dronabinol Volume K Forecast, by Country 2020 & 2033
- Table 61: Turkey Dronabinol Revenue (billion) Forecast, by Application 2020 & 2033
- Table 62: Turkey Dronabinol Volume (K) Forecast, by Application 2020 & 2033
- Table 63: Israel Dronabinol Revenue (billion) Forecast, by Application 2020 & 2033
- Table 64: Israel Dronabinol Volume (K) Forecast, by Application 2020 & 2033
- Table 65: GCC Dronabinol Revenue (billion) Forecast, by Application 2020 & 2033
- Table 66: GCC Dronabinol Volume (K) Forecast, by Application 2020 & 2033
- Table 67: North Africa Dronabinol Revenue (billion) Forecast, by Application 2020 & 2033
- Table 68: North Africa Dronabinol Volume (K) Forecast, by Application 2020 & 2033
- Table 69: South Africa Dronabinol Revenue (billion) Forecast, by Application 2020 & 2033
- Table 70: South Africa Dronabinol Volume (K) Forecast, by Application 2020 & 2033
- Table 71: Rest of Middle East & Africa Dronabinol Revenue (billion) Forecast, by Application 2020 & 2033
- Table 72: Rest of Middle East & Africa Dronabinol Volume (K) Forecast, by Application 2020 & 2033
- Table 73: Global Dronabinol Revenue billion Forecast, by Application 2020 & 2033
- Table 74: Global Dronabinol Volume K Forecast, by Application 2020 & 2033
- Table 75: Global Dronabinol Revenue billion Forecast, by Types 2020 & 2033
- Table 76: Global Dronabinol Volume K Forecast, by Types 2020 & 2033
- Table 77: Global Dronabinol Revenue billion Forecast, by Country 2020 & 2033
- Table 78: Global Dronabinol Volume K Forecast, by Country 2020 & 2033
- Table 79: China Dronabinol Revenue (billion) Forecast, by Application 2020 & 2033
- Table 80: China Dronabinol Volume (K) Forecast, by Application 2020 & 2033
- Table 81: India Dronabinol Revenue (billion) Forecast, by Application 2020 & 2033
- Table 82: India Dronabinol Volume (K) Forecast, by Application 2020 & 2033
- Table 83: Japan Dronabinol Revenue (billion) Forecast, by Application 2020 & 2033
- Table 84: Japan Dronabinol Volume (K) Forecast, by Application 2020 & 2033
- Table 85: South Korea Dronabinol Revenue (billion) Forecast, by Application 2020 & 2033
- Table 86: South Korea Dronabinol Volume (K) Forecast, by Application 2020 & 2033
- Table 87: ASEAN Dronabinol Revenue (billion) Forecast, by Application 2020 & 2033
- Table 88: ASEAN Dronabinol Volume (K) Forecast, by Application 2020 & 2033
- Table 89: Oceania Dronabinol Revenue (billion) Forecast, by Application 2020 & 2033
- Table 90: Oceania Dronabinol Volume (K) Forecast, by Application 2020 & 2033
- Table 91: Rest of Asia Pacific Dronabinol Revenue (billion) Forecast, by Application 2020 & 2033
- Table 92: Rest of Asia Pacific Dronabinol Volume (K) Forecast, by Application 2020 & 2033
Frequently Asked Questions
1. What is the projected Compound Annual Growth Rate (CAGR) of the Dronabinol?
The projected CAGR is approximately 6.4%.
2. Which companies are prominent players in the Dronabinol?
Key companies in the market include Canopy Growth, Noramco, KinetoChem, Entourage Phytolab, THC Pharm, Echo Pharmaceuticals, BOL Pharma, Aphios Corporation, Benuvia Manufacturing.
3. What are the main segments of the Dronabinol?
The market segments include Application, Types.
4. Can you provide details about the market size?
The market size is estimated to be USD 15.08 billion as of 2022.
5. What are some drivers contributing to market growth?
N/A
6. What are the notable trends driving market growth?
N/A
7. Are there any restraints impacting market growth?
N/A
8. Can you provide examples of recent developments in the market?
N/A
9. What pricing options are available for accessing the report?
Pricing options include single-user, multi-user, and enterprise licenses priced at USD 4000.00, USD 6000.00, and USD 8000.00 respectively.
10. Is the market size provided in terms of value or volume?
The market size is provided in terms of value, measured in billion and volume, measured in K.
11. Are there any specific market keywords associated with the report?
Yes, the market keyword associated with the report is "Dronabinol," which aids in identifying and referencing the specific market segment covered.
12. How do I determine which pricing option suits my needs best?
The pricing options vary based on user requirements and access needs. Individual users may opt for single-user licenses, while businesses requiring broader access may choose multi-user or enterprise licenses for cost-effective access to the report.
13. Are there any additional resources or data provided in the Dronabinol report?
While the report offers comprehensive insights, it's advisable to review the specific contents or supplementary materials provided to ascertain if additional resources or data are available.
14. How can I stay updated on further developments or reports in the Dronabinol?
To stay informed about further developments, trends, and reports in the Dronabinol, consider subscribing to industry newsletters, following relevant companies and organizations, or regularly checking reputable industry news sources and publications.
Methodology
Step 1 - Identification of Relevant Samples Size from Population Database


Step 2 - Approaches for Defining Global Market Size (Value, Volume* & Price*)

Note*: In applicable scenarios
Step 3 - Data Sources
Primary Research
- Web Analytics
- Survey Reports
- Research Institute
- Latest Research Reports
- Opinion Leaders
Secondary Research
- Annual Reports
- White Paper
- Latest Press Release
- Industry Association
- Paid Database
- Investor Presentations

Step 4 - Data Triangulation
Involves using different sources of information in order to increase the validity of a study
These sources are likely to be stakeholders in a program - participants, other researchers, program staff, other community members, and so on.
Then we put all data in single framework & apply various statistical tools to find out the dynamic on the market.
During the analysis stage, feedback from the stakeholder groups would be compared to determine areas of agreement as well as areas of divergence