Key Insights
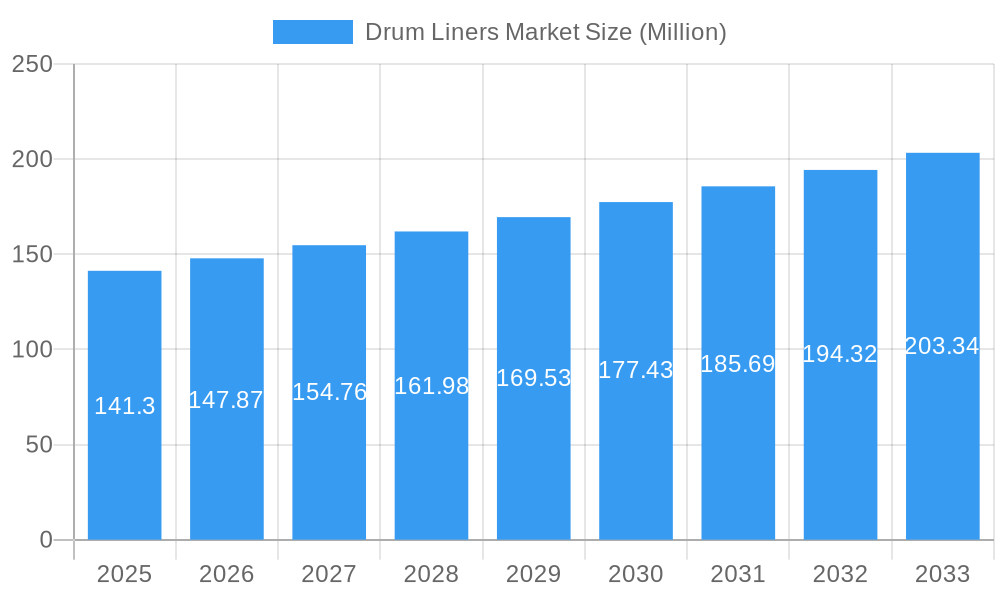
The global drum liners market, valued at $141.30 million in 2025, is projected to experience robust growth, driven by increasing demand across diverse end-use sectors. The market's Compound Annual Growth Rate (CAGR) of 4.67% from 2025 to 2033 indicates a steady expansion, fueled primarily by the burgeoning chemical and flammable substances industries. The rising adoption of drum liners for safe and efficient packaging of hazardous materials is a significant factor contributing to market growth. Furthermore, increasing regulatory scrutiny regarding the safe handling and transportation of chemicals is driving the demand for reliable and compliant drum liners. Growth is also propelled by the expanding food and beverage industry, which necessitates efficient and hygienic packaging solutions to maintain product quality and extend shelf life. The market is segmented by product type (shrink liner, round bottom liner, flat bottom liner, and others), packaging type (flexible, rigid, semi-rigid), and end-user industry (chemicals and flammables, adhesives, inks and coatings, food products, and others). Competition among established players like Greif, Terdex, Bagla Group, Bemis Company Inc, WINPAK LTD, and others fuels innovation and price competitiveness, benefiting consumers. Regional variations in growth are expected, with North America and Asia Pacific likely to dominate due to significant industrial activity and stringent regulations. However, emerging economies in regions like South America and MEA are also anticipated to witness substantial growth as industrialization accelerates.
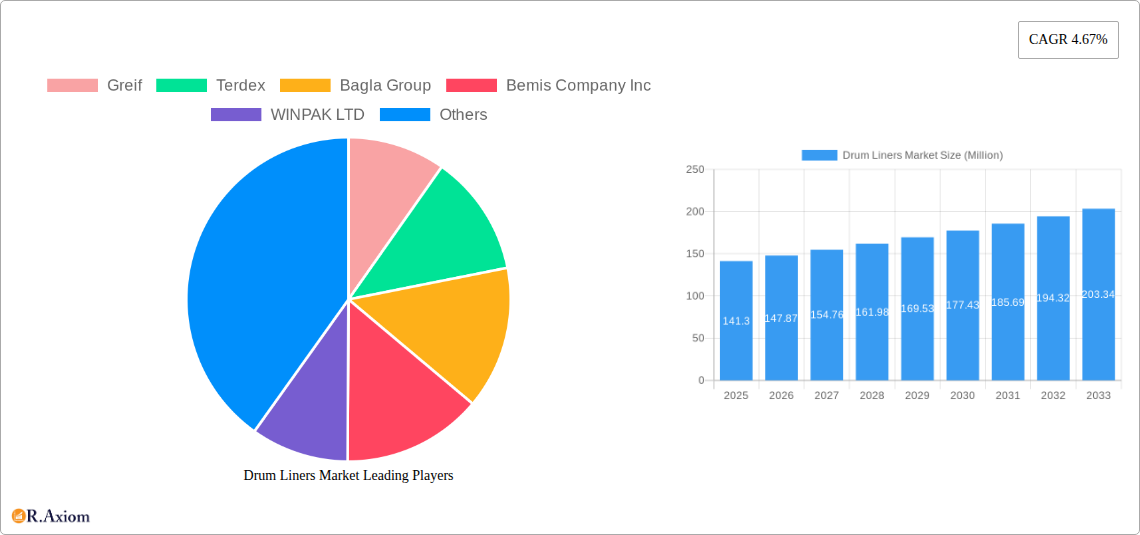
Drum Liners Market Market Size (In Million)
The forecast period from 2025 to 2033 is expected to see consistent growth in the drum liner market. Innovation in liner materials, focusing on improved durability, leak resistance, and recyclability, will be a key driver. The shift towards sustainable packaging solutions will also influence the market, with manufacturers focusing on eco-friendly materials and designs. However, factors such as fluctuations in raw material prices and potential economic downturns may pose challenges to sustained growth. Nonetheless, the overall market outlook remains positive, reflecting the indispensable role of drum liners in various industries for safe and efficient product handling and transportation. The competitive landscape will continue to evolve with mergers and acquisitions, further shaping market dynamics in the years to come.
Drum Liners Market Company Market Share
Drum Liners Market: A Comprehensive Report (2019-2033)
This comprehensive report provides an in-depth analysis of the global Drum Liners Market, offering valuable insights for industry stakeholders, investors, and strategic decision-makers. The report covers the period from 2019 to 2033, with a focus on the forecast period of 2025-2033 and a base year of 2025. The study incorporates detailed segmentation analysis, competitive landscape assessment, and future growth projections, utilizing both historical data (2019-2024) and projected figures for a holistic market overview.
Drum Liners Market Market Concentration & Innovation
The Drum Liners Market exhibits a moderately concentrated structure, with key players like Greif, Berry Global, and Sealed Air holding significant market share. However, the presence of several regional and specialized players fosters competition. Innovation in the sector is primarily driven by the need for enhanced product performance, sustainability, and cost-effectiveness.
- Market Concentration: The top 5 players account for approximately xx% of the global market share in 2025 (estimated).
- Innovation Drivers: Demand for lightweight, high-strength liners, improved barrier properties, and eco-friendly materials are major drivers.
- Regulatory Frameworks: Increasing environmental regulations concerning waste disposal and material usage are influencing product development and material selection.
- Product Substitutes: Alternative packaging solutions, such as IBC totes and flexible intermediate bulk containers (FIBC), pose a competitive challenge.
- End-User Trends: The growing demand from the chemical and flammable goods industries significantly contributes to market growth.
- M&A Activities: Recent mergers and acquisitions, such as Berry Global's USD 3.6 Billion merger with Glatfelter Corporation in February 2024 and Greif Inc.'s USD 145 Million acquisition increasing their stake in Centurion Container LLC in April 2023, demonstrate the ongoing consolidation within the industry. These activities impact market concentration and influence the competitive dynamics significantly.
Drum Liners Market Industry Trends & Insights
The Drum Liners Market is projected to witness robust growth during the forecast period, driven by several key factors. Increasing industrialization and manufacturing activities globally fuel demand for reliable and efficient packaging solutions. The rising adoption of automation in various industries is further enhancing market expansion. The market is experiencing a shift towards sustainable and eco-friendly packaging solutions, driving the development of biodegradable and recyclable liners. This trend is propelled by stringent environmental regulations and increasing consumer awareness. The CAGR for the Drum Liners Market is estimated to be xx% during the forecast period (2025-2033). Market penetration of sustainable liners is expected to reach xx% by 2033. Competitive dynamics are shaped by innovation, pricing strategies, and geographic expansion initiatives by market players.
Dominant Markets & Segments in Drum Liners Market
The Drum Liners Market demonstrates diverse regional and segmental dominance.
Leading Region: North America currently holds a significant market share, driven by robust industrial activity and a strong demand for chemical and hazardous material packaging. Europe and Asia-Pacific are also key regions, exhibiting strong growth potential.
Dominant Segments:
- By Product Type: Shrink liners currently dominate due to their cost-effectiveness and ease of use. However, round bottom liners and flat bottom liners show significant growth potential, driven by niche applications.
- By Packaging Type: Flexible packaging is currently the dominant type, accounting for a larger market share than rigid and semi-rigid packaging types.
- By End User: The chemical and flammable goods industry remains the dominant end-user sector, followed by the adhesives, inks and coatings industries. Food products represent a smaller, but steadily growing segment.
Key Drivers:
- North America: Strong industrial base, high chemical production, stringent safety regulations.
- Europe: Growing demand for sustainable packaging solutions, stringent environmental regulations.
- Asia-Pacific: Rapid industrialization, increasing manufacturing activities, rising disposable income.
Drum Liners Market Product Developments
Recent innovations in drum liners focus on enhanced barrier properties, improved strength-to-weight ratios, and the incorporation of sustainable materials. The development of liners with improved leak resistance and tamper-evident features caters to the growing needs of the chemical and hazardous materials industries. These advancements aim to provide greater protection, improve efficiency, and enhance the overall user experience, ultimately enhancing the market fit and competitive advantage of leading manufacturers.
Report Scope & Segmentation Analysis
This report provides a comprehensive analysis of the Drum Liners Market, segmented by product type (Shrink Liner, Round Bottom Liner, Flat Bottom Liner, Others), packaging type (Flexible, Rigid, Semi-Rigid), and end-user (Chemicals and Flammables, Adhesives, Inks and Coatings, Food Products, Others). Each segment's growth projection, market size, and competitive dynamics are thoroughly examined. Market size for each segment is projected to grow considerably with the Shrink Liner segment expected to hold the largest share across the forecast period.
Key Drivers of Drum Liners Market Growth
Several factors drive the Drum Liners Market growth. These include the increasing demand for safe and efficient packaging solutions across diverse industries, particularly the chemical and hazardous materials sectors. Stringent regulatory standards focused on leak prevention and material safety are also significantly contributing. Furthermore, technological advancements leading to improved liner designs and manufacturing processes play a crucial role.
Challenges in the Drum Liners Market Sector
The Drum Liners Market faces several challenges. Fluctuations in raw material prices impact production costs and profitability. Supply chain disruptions can affect the timely delivery of products. Intense competition among existing players necessitates continuous innovation and cost optimization to maintain a competitive edge. The increasing prevalence of substitute packaging options also presents a challenge.
Emerging Opportunities in Drum Liners Market
Emerging opportunities lie in the development and adoption of sustainable and eco-friendly drum liners. The growing demand for recyclable and biodegradable materials presents a significant market opportunity. Expansion into new and emerging markets in developing economies also offers growth potential. Furthermore, innovations in liner design focusing on enhanced functionality and improved barrier properties provide further opportunities.
Leading Players in the Drum Liners Market Market
- Greif
- Terdex
- Bagla Group
- Bemis Company Inc
- WINPAK LTD
- Shenyang Weiming Technology Co Ltd
- Bollore Group
- Intertape Polymer Ltd
- Berry Global Inc
- Sealed Air
Key Developments in Drum Liners Market Industry
- February 2024: Berry Global announced a merger with Glatfelter Corporation, valued at USD 3.6 Billion. This significantly alters the competitive landscape and expands Berry Global's presence in related markets.
- April 2023: Greif Inc. increased its stake in Centurion Container LLC to 80%, enhancing its market position and production capacity. This acquisition signals Greif's commitment to strengthening its presence within the drum liner market.
Strategic Outlook for Drum Liners Market Market
The Drum Liners Market is poised for continued growth, driven by increasing industrial activity, stringent regulatory compliance needs, and the ongoing development of innovative and sustainable packaging solutions. Companies that successfully adapt to changing market dynamics, embrace sustainable practices, and invest in research and development will be well-positioned to capitalize on the market's significant growth potential in the coming years.
Drum Liners Market Segmentation
-
1. Product Type
- 1.1. Shrink Liner
- 1.2. Round Bottom Liner
- 1.3. Flat Bottom Liner
- 1.4. Others
-
2. Packaging Type
- 2.1. Flexible
- 2.2. Rigid
- 2.3. Semi-Rigid
-
3. End User
- 3.1. Chemicals and Flammables
- 3.2. Adhesives
- 3.3. Inks and Coatings
- 3.4. Food Products
- 3.5. Others
- 4. Geography
-
5. North America
- 5.1. United States
- 5.2. Canada
- 5.3. Rest of North America
-
6. Europe
- 6.1. United Kingdom
- 6.2. Germany
- 6.3. France
- 6.4. Russia
- 6.5. Italy
- 6.6. Spain
- 6.7. Rest of Europe
-
7. Asia-Pacific
- 7.1. India
- 7.2. China
- 7.3. Japan
- 7.4. Australia
- 7.5. Rest of Asia-Pacific
-
8. South America
- 8.1. Brazil
- 8.2. Argentina
- 8.3. Rest of South America
-
9. Middle-East and Africa
- 9.1. United Arab Emirates
- 9.2. South Africa
- 9.3. Rest of Middle-East and Africa
Drum Liners Market Segmentation By Geography
-
1. North America
- 1.1. United States
- 1.2. Canada
- 1.3. Mexico
-
2. South America
- 2.1. Brazil
- 2.2. Argentina
- 2.3. Rest of South America
-
3. Europe
- 3.1. United Kingdom
- 3.2. Germany
- 3.3. France
- 3.4. Italy
- 3.5. Spain
- 3.6. Russia
- 3.7. Benelux
- 3.8. Nordics
- 3.9. Rest of Europe
-
4. Middle East & Africa
- 4.1. Turkey
- 4.2. Israel
- 4.3. GCC
- 4.4. North Africa
- 4.5. South Africa
- 4.6. Rest of Middle East & Africa
-
5. Asia Pacific
- 5.1. China
- 5.2. India
- 5.3. Japan
- 5.4. South Korea
- 5.5. ASEAN
- 5.6. Oceania
- 5.7. Rest of Asia Pacific
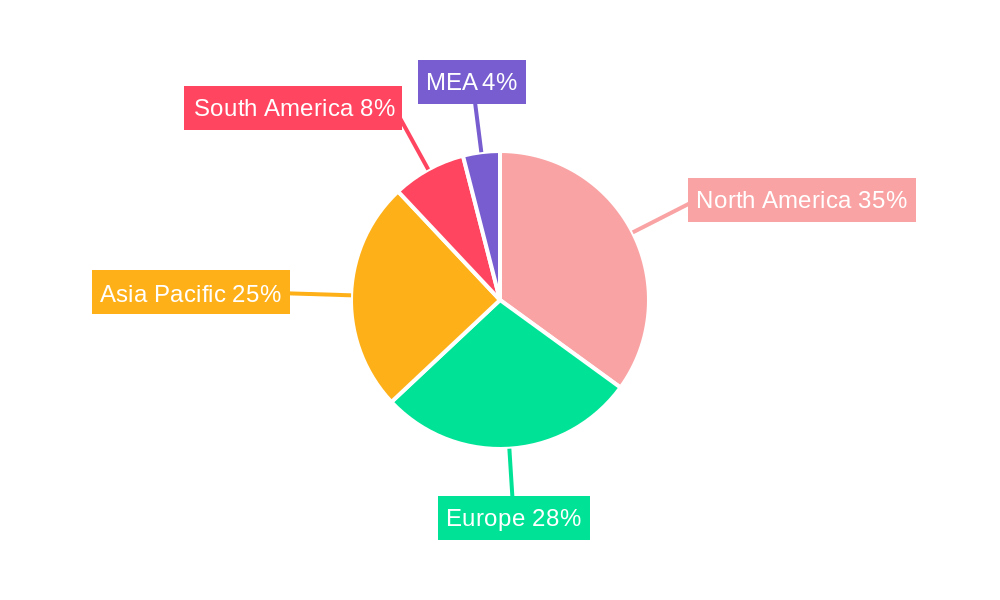
Drum Liners Market Regional Market Share
Geographic Coverage of Drum Liners Market
Drum Liners Market REPORT HIGHLIGHTS
| Aspects | Details |
|---|---|
| Study Period | 2020-2034 |
| Base Year | 2025 |
| Estimated Year | 2026 |
| Forecast Period | 2026-2034 |
| Historical Period | 2020-2025 |
| Growth Rate | CAGR of 6.2% from 2020-2034 |
| Segmentation |
|
Table of Contents
- 1. Introduction
- 1.1. Research Scope
- 1.2. Market Segmentation
- 1.3. Research Objective
- 1.4. Definitions and Assumptions
- 2. Executive Summary
- 2.1. Market Snapshot
- 3. Market Dynamics
- 3.1. Market Drivers
- 3.2. Market Restrains
- 3.3. Market Trends
- 3.4. Market Opportunities
- 4. Market Factor Analysis
- 4.1. Porters Five Forces
- 4.1.1. Bargaining Power of Suppliers
- 4.1.2. Bargaining Power of Buyers
- 4.1.3. Threat of New Entrants
- 4.1.4. Threat of Substitutes
- 4.1.5. Competitive Rivalry
- 4.2. PESTEL analysis
- 4.3. BCG Analysis
- 4.3.1. Stars (High Growth, High Market Share)
- 4.3.2. Cash Cows (Low Growth, High Market Share)
- 4.3.3. Question Mark (High Growth, Low Market Share)
- 4.3.4. Dogs (Low Growth, Low Market Share)
- 4.4. Ansoff Matrix Analysis
- 4.5. Supply Chain Analysis
- 4.6. Regulatory Landscape
- 4.7. Current Market Potential and Opportunity Assessment (TAM–SAM–SOM Framework)
- 4.8. RAX Analyst Note
- 4.1. Porters Five Forces
- 5. Market Analysis, Insights and Forecast 2021-2033
- 5.1. Market Analysis, Insights and Forecast - by Product Type
- 5.1.1. Shrink Liner
- 5.1.2. Round Bottom Liner
- 5.1.3. Flat Bottom Liner
- 5.1.4. Others
- 5.2. Market Analysis, Insights and Forecast - by Packaging Type
- 5.2.1. Flexible
- 5.2.2. Rigid
- 5.2.3. Semi-Rigid
- 5.3. Market Analysis, Insights and Forecast - by End User
- 5.3.1. Chemicals and Flammables
- 5.3.2. Adhesives
- 5.3.3. Inks and Coatings
- 5.3.4. Food Products
- 5.3.5. Others
- 5.4. Market Analysis, Insights and Forecast - by Geography
- 5.5. Market Analysis, Insights and Forecast - by North America
- 5.5.1. United States
- 5.5.2. Canada
- 5.5.3. Rest of North America
- 5.6. Market Analysis, Insights and Forecast - by Europe
- 5.6.1. United Kingdom
- 5.6.2. Germany
- 5.6.3. France
- 5.6.4. Russia
- 5.6.5. Italy
- 5.6.6. Spain
- 5.6.7. Rest of Europe
- 5.7. Market Analysis, Insights and Forecast - by Asia-Pacific
- 5.7.1. India
- 5.7.2. China
- 5.7.3. Japan
- 5.7.4. Australia
- 5.7.5. Rest of Asia-Pacific
- 5.8. Market Analysis, Insights and Forecast - by South America
- 5.8.1. Brazil
- 5.8.2. Argentina
- 5.8.3. Rest of South America
- 5.9. Market Analysis, Insights and Forecast - by Middle-East and Africa
- 5.9.1. United Arab Emirates
- 5.9.2. South Africa
- 5.9.3. Rest of Middle-East and Africa
- 5.10. Market Analysis, Insights and Forecast - by Region
- 5.10.1. North America
- 5.10.2. South America
- 5.10.3. Europe
- 5.10.4. Middle East & Africa
- 5.10.5. Asia Pacific
- 5.1. Market Analysis, Insights and Forecast - by Product Type
- 6. Global Drum Liners Market Analysis, Insights and Forecast, 2021-2033
- 6.1. Market Analysis, Insights and Forecast - by Product Type
- 6.1.1. Shrink Liner
- 6.1.2. Round Bottom Liner
- 6.1.3. Flat Bottom Liner
- 6.1.4. Others
- 6.2. Market Analysis, Insights and Forecast - by Packaging Type
- 6.2.1. Flexible
- 6.2.2. Rigid
- 6.2.3. Semi-Rigid
- 6.3. Market Analysis, Insights and Forecast - by End User
- 6.3.1. Chemicals and Flammables
- 6.3.2. Adhesives
- 6.3.3. Inks and Coatings
- 6.3.4. Food Products
- 6.3.5. Others
- 6.4. Market Analysis, Insights and Forecast - by Geography
- 6.5. Market Analysis, Insights and Forecast - by North America
- 6.5.1. United States
- 6.5.2. Canada
- 6.5.3. Rest of North America
- 6.6. Market Analysis, Insights and Forecast - by Europe
- 6.6.1. United Kingdom
- 6.6.2. Germany
- 6.6.3. France
- 6.6.4. Russia
- 6.6.5. Italy
- 6.6.6. Spain
- 6.6.7. Rest of Europe
- 6.7. Market Analysis, Insights and Forecast - by Asia-Pacific
- 6.7.1. India
- 6.7.2. China
- 6.7.3. Japan
- 6.7.4. Australia
- 6.7.5. Rest of Asia-Pacific
- 6.8. Market Analysis, Insights and Forecast - by South America
- 6.8.1. Brazil
- 6.8.2. Argentina
- 6.8.3. Rest of South America
- 6.9. Market Analysis, Insights and Forecast - by Middle-East and Africa
- 6.9.1. United Arab Emirates
- 6.9.2. South Africa
- 6.9.3. Rest of Middle-East and Africa
- 6.1. Market Analysis, Insights and Forecast - by Product Type
- 7. North America Drum Liners Market Analysis, Insights and Forecast, 2020-2032
- 7.1. Market Analysis, Insights and Forecast - by Product Type
- 7.1.1. Shrink Liner
- 7.1.2. Round Bottom Liner
- 7.1.3. Flat Bottom Liner
- 7.1.4. Others
- 7.2. Market Analysis, Insights and Forecast - by Packaging Type
- 7.2.1. Flexible
- 7.2.2. Rigid
- 7.2.3. Semi-Rigid
- 7.3. Market Analysis, Insights and Forecast - by End User
- 7.3.1. Chemicals and Flammables
- 7.3.2. Adhesives
- 7.3.3. Inks and Coatings
- 7.3.4. Food Products
- 7.3.5. Others
- 7.4. Market Analysis, Insights and Forecast - by Geography
- 7.5. Market Analysis, Insights and Forecast - by North America
- 7.5.1. United States
- 7.5.2. Canada
- 7.5.3. Rest of North America
- 7.6. Market Analysis, Insights and Forecast - by Europe
- 7.6.1. United Kingdom
- 7.6.2. Germany
- 7.6.3. France
- 7.6.4. Russia
- 7.6.5. Italy
- 7.6.6. Spain
- 7.6.7. Rest of Europe
- 7.7. Market Analysis, Insights and Forecast - by Asia-Pacific
- 7.7.1. India
- 7.7.2. China
- 7.7.3. Japan
- 7.7.4. Australia
- 7.7.5. Rest of Asia-Pacific
- 7.8. Market Analysis, Insights and Forecast - by South America
- 7.8.1. Brazil
- 7.8.2. Argentina
- 7.8.3. Rest of South America
- 7.9. Market Analysis, Insights and Forecast - by Middle-East and Africa
- 7.9.1. United Arab Emirates
- 7.9.2. South Africa
- 7.9.3. Rest of Middle-East and Africa
- 7.1. Market Analysis, Insights and Forecast - by Product Type
- 8. South America Drum Liners Market Analysis, Insights and Forecast, 2020-2032
- 8.1. Market Analysis, Insights and Forecast - by Product Type
- 8.1.1. Shrink Liner
- 8.1.2. Round Bottom Liner
- 8.1.3. Flat Bottom Liner
- 8.1.4. Others
- 8.2. Market Analysis, Insights and Forecast - by Packaging Type
- 8.2.1. Flexible
- 8.2.2. Rigid
- 8.2.3. Semi-Rigid
- 8.3. Market Analysis, Insights and Forecast - by End User
- 8.3.1. Chemicals and Flammables
- 8.3.2. Adhesives
- 8.3.3. Inks and Coatings
- 8.3.4. Food Products
- 8.3.5. Others
- 8.4. Market Analysis, Insights and Forecast - by Geography
- 8.5. Market Analysis, Insights and Forecast - by North America
- 8.5.1. United States
- 8.5.2. Canada
- 8.5.3. Rest of North America
- 8.6. Market Analysis, Insights and Forecast - by Europe
- 8.6.1. United Kingdom
- 8.6.2. Germany
- 8.6.3. France
- 8.6.4. Russia
- 8.6.5. Italy
- 8.6.6. Spain
- 8.6.7. Rest of Europe
- 8.7. Market Analysis, Insights and Forecast - by Asia-Pacific
- 8.7.1. India
- 8.7.2. China
- 8.7.3. Japan
- 8.7.4. Australia
- 8.7.5. Rest of Asia-Pacific
- 8.8. Market Analysis, Insights and Forecast - by South America
- 8.8.1. Brazil
- 8.8.2. Argentina
- 8.8.3. Rest of South America
- 8.9. Market Analysis, Insights and Forecast - by Middle-East and Africa
- 8.9.1. United Arab Emirates
- 8.9.2. South Africa
- 8.9.3. Rest of Middle-East and Africa
- 8.1. Market Analysis, Insights and Forecast - by Product Type
- 9. Europe Drum Liners Market Analysis, Insights and Forecast, 2020-2032
- 9.1. Market Analysis, Insights and Forecast - by Product Type
- 9.1.1. Shrink Liner
- 9.1.2. Round Bottom Liner
- 9.1.3. Flat Bottom Liner
- 9.1.4. Others
- 9.2. Market Analysis, Insights and Forecast - by Packaging Type
- 9.2.1. Flexible
- 9.2.2. Rigid
- 9.2.3. Semi-Rigid
- 9.3. Market Analysis, Insights and Forecast - by End User
- 9.3.1. Chemicals and Flammables
- 9.3.2. Adhesives
- 9.3.3. Inks and Coatings
- 9.3.4. Food Products
- 9.3.5. Others
- 9.4. Market Analysis, Insights and Forecast - by Geography
- 9.5. Market Analysis, Insights and Forecast - by North America
- 9.5.1. United States
- 9.5.2. Canada
- 9.5.3. Rest of North America
- 9.6. Market Analysis, Insights and Forecast - by Europe
- 9.6.1. United Kingdom
- 9.6.2. Germany
- 9.6.3. France
- 9.6.4. Russia
- 9.6.5. Italy
- 9.6.6. Spain
- 9.6.7. Rest of Europe
- 9.7. Market Analysis, Insights and Forecast - by Asia-Pacific
- 9.7.1. India
- 9.7.2. China
- 9.7.3. Japan
- 9.7.4. Australia
- 9.7.5. Rest of Asia-Pacific
- 9.8. Market Analysis, Insights and Forecast - by South America
- 9.8.1. Brazil
- 9.8.2. Argentina
- 9.8.3. Rest of South America
- 9.9. Market Analysis, Insights and Forecast - by Middle-East and Africa
- 9.9.1. United Arab Emirates
- 9.9.2. South Africa
- 9.9.3. Rest of Middle-East and Africa
- 9.1. Market Analysis, Insights and Forecast - by Product Type
- 10. Middle East & Africa Drum Liners Market Analysis, Insights and Forecast, 2020-2032
- 10.1. Market Analysis, Insights and Forecast - by Product Type
- 10.1.1. Shrink Liner
- 10.1.2. Round Bottom Liner
- 10.1.3. Flat Bottom Liner
- 10.1.4. Others
- 10.2. Market Analysis, Insights and Forecast - by Packaging Type
- 10.2.1. Flexible
- 10.2.2. Rigid
- 10.2.3. Semi-Rigid
- 10.3. Market Analysis, Insights and Forecast - by End User
- 10.3.1. Chemicals and Flammables
- 10.3.2. Adhesives
- 10.3.3. Inks and Coatings
- 10.3.4. Food Products
- 10.3.5. Others
- 10.4. Market Analysis, Insights and Forecast - by Geography
- 10.5. Market Analysis, Insights and Forecast - by North America
- 10.5.1. United States
- 10.5.2. Canada
- 10.5.3. Rest of North America
- 10.6. Market Analysis, Insights and Forecast - by Europe
- 10.6.1. United Kingdom
- 10.6.2. Germany
- 10.6.3. France
- 10.6.4. Russia
- 10.6.5. Italy
- 10.6.6. Spain
- 10.6.7. Rest of Europe
- 10.7. Market Analysis, Insights and Forecast - by Asia-Pacific
- 10.7.1. India
- 10.7.2. China
- 10.7.3. Japan
- 10.7.4. Australia
- 10.7.5. Rest of Asia-Pacific
- 10.8. Market Analysis, Insights and Forecast - by South America
- 10.8.1. Brazil
- 10.8.2. Argentina
- 10.8.3. Rest of South America
- 10.9. Market Analysis, Insights and Forecast - by Middle-East and Africa
- 10.9.1. United Arab Emirates
- 10.9.2. South Africa
- 10.9.3. Rest of Middle-East and Africa
- 10.1. Market Analysis, Insights and Forecast - by Product Type
- 11. Asia Pacific Drum Liners Market Analysis, Insights and Forecast, 2020-2032
- 11.1. Market Analysis, Insights and Forecast - by Product Type
- 11.1.1. Shrink Liner
- 11.1.2. Round Bottom Liner
- 11.1.3. Flat Bottom Liner
- 11.1.4. Others
- 11.2. Market Analysis, Insights and Forecast - by Packaging Type
- 11.2.1. Flexible
- 11.2.2. Rigid
- 11.2.3. Semi-Rigid
- 11.3. Market Analysis, Insights and Forecast - by End User
- 11.3.1. Chemicals and Flammables
- 11.3.2. Adhesives
- 11.3.3. Inks and Coatings
- 11.3.4. Food Products
- 11.3.5. Others
- 11.4. Market Analysis, Insights and Forecast - by Geography
- 11.5. Market Analysis, Insights and Forecast - by North America
- 11.5.1. United States
- 11.5.2. Canada
- 11.5.3. Rest of North America
- 11.6. Market Analysis, Insights and Forecast - by Europe
- 11.6.1. United Kingdom
- 11.6.2. Germany
- 11.6.3. France
- 11.6.4. Russia
- 11.6.5. Italy
- 11.6.6. Spain
- 11.6.7. Rest of Europe
- 11.7. Market Analysis, Insights and Forecast - by Asia-Pacific
- 11.7.1. India
- 11.7.2. China
- 11.7.3. Japan
- 11.7.4. Australia
- 11.7.5. Rest of Asia-Pacific
- 11.8. Market Analysis, Insights and Forecast - by South America
- 11.8.1. Brazil
- 11.8.2. Argentina
- 11.8.3. Rest of South America
- 11.9. Market Analysis, Insights and Forecast - by Middle-East and Africa
- 11.9.1. United Arab Emirates
- 11.9.2. South Africa
- 11.9.3. Rest of Middle-East and Africa
- 11.1. Market Analysis, Insights and Forecast - by Product Type
- 12. Competitive Analysis
- 12.1. Company Profiles
- 12.1.1 Greif
- 12.1.1.1. Company Overview
- 12.1.1.2. Products
- 12.1.1.3. Company Financials
- 12.1.1.4. SWOT Analysis
- 12.1.2 Terdex
- 12.1.2.1. Company Overview
- 12.1.2.2. Products
- 12.1.2.3. Company Financials
- 12.1.2.4. SWOT Analysis
- 12.1.3 Bagla Group
- 12.1.3.1. Company Overview
- 12.1.3.2. Products
- 12.1.3.3. Company Financials
- 12.1.3.4. SWOT Analysis
- 12.1.4 Bemis Company Inc
- 12.1.4.1. Company Overview
- 12.1.4.2. Products
- 12.1.4.3. Company Financials
- 12.1.4.4. SWOT Analysis
- 12.1.5 WINPAK LTD
- 12.1.5.1. Company Overview
- 12.1.5.2. Products
- 12.1.5.3. Company Financials
- 12.1.5.4. SWOT Analysis
- 12.1.6 Shenyang Weiming Technology Co Ltd
- 12.1.6.1. Company Overview
- 12.1.6.2. Products
- 12.1.6.3. Company Financials
- 12.1.6.4. SWOT Analysis
- 12.1.7 Bollore Group
- 12.1.7.1. Company Overview
- 12.1.7.2. Products
- 12.1.7.3. Company Financials
- 12.1.7.4. SWOT Analysis
- 12.1.8 Intertape Polymer Ltd
- 12.1.8.1. Company Overview
- 12.1.8.2. Products
- 12.1.8.3. Company Financials
- 12.1.8.4. SWOT Analysis
- 12.1.9 Berry Global Inc
- 12.1.9.1. Company Overview
- 12.1.9.2. Products
- 12.1.9.3. Company Financials
- 12.1.9.4. SWOT Analysis
- 12.1.10 Sealed Air
- 12.1.10.1. Company Overview
- 12.1.10.2. Products
- 12.1.10.3. Company Financials
- 12.1.10.4. SWOT Analysis
- 12.1.1 Greif
- 12.2. Market Entropy
- 12.2.1 Company's Key Areas Served
- 12.2.2 Recent Developments
- 12.3. Company Market Share Analysis 2025
- 12.3.1 Top 5 Companies Market Share Analysis
- 12.3.2 Top 3 Companies Market Share Analysis
- 12.4. List of Potential Customers
- 13. Research Methodology
List of Figures
- Figure 1: Global Drum Liners Market Revenue Breakdown (million, %) by Region 2025 & 2033
- Figure 2: Global Drum Liners Market Volume Breakdown (K Tons, %) by Region 2025 & 2033
- Figure 3: North America Drum Liners Market Revenue (million), by Product Type 2025 & 2033
- Figure 4: North America Drum Liners Market Volume (K Tons), by Product Type 2025 & 2033
- Figure 5: North America Drum Liners Market Revenue Share (%), by Product Type 2025 & 2033
- Figure 6: North America Drum Liners Market Volume Share (%), by Product Type 2025 & 2033
- Figure 7: North America Drum Liners Market Revenue (million), by Packaging Type 2025 & 2033
- Figure 8: North America Drum Liners Market Volume (K Tons), by Packaging Type 2025 & 2033
- Figure 9: North America Drum Liners Market Revenue Share (%), by Packaging Type 2025 & 2033
- Figure 10: North America Drum Liners Market Volume Share (%), by Packaging Type 2025 & 2033
- Figure 11: North America Drum Liners Market Revenue (million), by End User 2025 & 2033
- Figure 12: North America Drum Liners Market Volume (K Tons), by End User 2025 & 2033
- Figure 13: North America Drum Liners Market Revenue Share (%), by End User 2025 & 2033
- Figure 14: North America Drum Liners Market Volume Share (%), by End User 2025 & 2033
- Figure 15: North America Drum Liners Market Revenue (million), by Geography 2025 & 2033
- Figure 16: North America Drum Liners Market Volume (K Tons), by Geography 2025 & 2033
- Figure 17: North America Drum Liners Market Revenue Share (%), by Geography 2025 & 2033
- Figure 18: North America Drum Liners Market Volume Share (%), by Geography 2025 & 2033
- Figure 19: North America Drum Liners Market Revenue (million), by North America 2025 & 2033
- Figure 20: North America Drum Liners Market Volume (K Tons), by North America 2025 & 2033
- Figure 21: North America Drum Liners Market Revenue Share (%), by North America 2025 & 2033
- Figure 22: North America Drum Liners Market Volume Share (%), by North America 2025 & 2033
- Figure 23: North America Drum Liners Market Revenue (million), by Europe 2025 & 2033
- Figure 24: North America Drum Liners Market Volume (K Tons), by Europe 2025 & 2033
- Figure 25: North America Drum Liners Market Revenue Share (%), by Europe 2025 & 2033
- Figure 26: North America Drum Liners Market Volume Share (%), by Europe 2025 & 2033
- Figure 27: North America Drum Liners Market Revenue (million), by Asia-Pacific 2025 & 2033
- Figure 28: North America Drum Liners Market Volume (K Tons), by Asia-Pacific 2025 & 2033
- Figure 29: North America Drum Liners Market Revenue Share (%), by Asia-Pacific 2025 & 2033
- Figure 30: North America Drum Liners Market Volume Share (%), by Asia-Pacific 2025 & 2033
- Figure 31: North America Drum Liners Market Revenue (million), by South America 2025 & 2033
- Figure 32: North America Drum Liners Market Volume (K Tons), by South America 2025 & 2033
- Figure 33: North America Drum Liners Market Revenue Share (%), by South America 2025 & 2033
- Figure 34: North America Drum Liners Market Volume Share (%), by South America 2025 & 2033
- Figure 35: North America Drum Liners Market Revenue (million), by Middle-East and Africa 2025 & 2033
- Figure 36: North America Drum Liners Market Volume (K Tons), by Middle-East and Africa 2025 & 2033
- Figure 37: North America Drum Liners Market Revenue Share (%), by Middle-East and Africa 2025 & 2033
- Figure 38: North America Drum Liners Market Volume Share (%), by Middle-East and Africa 2025 & 2033
- Figure 39: North America Drum Liners Market Revenue (million), by Country 2025 & 2033
- Figure 40: North America Drum Liners Market Volume (K Tons), by Country 2025 & 2033
- Figure 41: North America Drum Liners Market Revenue Share (%), by Country 2025 & 2033
- Figure 42: North America Drum Liners Market Volume Share (%), by Country 2025 & 2033
- Figure 43: South America Drum Liners Market Revenue (million), by Product Type 2025 & 2033
- Figure 44: South America Drum Liners Market Volume (K Tons), by Product Type 2025 & 2033
- Figure 45: South America Drum Liners Market Revenue Share (%), by Product Type 2025 & 2033
- Figure 46: South America Drum Liners Market Volume Share (%), by Product Type 2025 & 2033
- Figure 47: South America Drum Liners Market Revenue (million), by Packaging Type 2025 & 2033
- Figure 48: South America Drum Liners Market Volume (K Tons), by Packaging Type 2025 & 2033
- Figure 49: South America Drum Liners Market Revenue Share (%), by Packaging Type 2025 & 2033
- Figure 50: South America Drum Liners Market Volume Share (%), by Packaging Type 2025 & 2033
- Figure 51: South America Drum Liners Market Revenue (million), by End User 2025 & 2033
- Figure 52: South America Drum Liners Market Volume (K Tons), by End User 2025 & 2033
- Figure 53: South America Drum Liners Market Revenue Share (%), by End User 2025 & 2033
- Figure 54: South America Drum Liners Market Volume Share (%), by End User 2025 & 2033
- Figure 55: South America Drum Liners Market Revenue (million), by Geography 2025 & 2033
- Figure 56: South America Drum Liners Market Volume (K Tons), by Geography 2025 & 2033
- Figure 57: South America Drum Liners Market Revenue Share (%), by Geography 2025 & 2033
- Figure 58: South America Drum Liners Market Volume Share (%), by Geography 2025 & 2033
- Figure 59: South America Drum Liners Market Revenue (million), by North America 2025 & 2033
- Figure 60: South America Drum Liners Market Volume (K Tons), by North America 2025 & 2033
- Figure 61: South America Drum Liners Market Revenue Share (%), by North America 2025 & 2033
- Figure 62: South America Drum Liners Market Volume Share (%), by North America 2025 & 2033
- Figure 63: South America Drum Liners Market Revenue (million), by Europe 2025 & 2033
- Figure 64: South America Drum Liners Market Volume (K Tons), by Europe 2025 & 2033
- Figure 65: South America Drum Liners Market Revenue Share (%), by Europe 2025 & 2033
- Figure 66: South America Drum Liners Market Volume Share (%), by Europe 2025 & 2033
- Figure 67: South America Drum Liners Market Revenue (million), by Asia-Pacific 2025 & 2033
- Figure 68: South America Drum Liners Market Volume (K Tons), by Asia-Pacific 2025 & 2033
- Figure 69: South America Drum Liners Market Revenue Share (%), by Asia-Pacific 2025 & 2033
- Figure 70: South America Drum Liners Market Volume Share (%), by Asia-Pacific 2025 & 2033
- Figure 71: South America Drum Liners Market Revenue (million), by South America 2025 & 2033
- Figure 72: South America Drum Liners Market Volume (K Tons), by South America 2025 & 2033
- Figure 73: South America Drum Liners Market Revenue Share (%), by South America 2025 & 2033
- Figure 74: South America Drum Liners Market Volume Share (%), by South America 2025 & 2033
- Figure 75: South America Drum Liners Market Revenue (million), by Middle-East and Africa 2025 & 2033
- Figure 76: South America Drum Liners Market Volume (K Tons), by Middle-East and Africa 2025 & 2033
- Figure 77: South America Drum Liners Market Revenue Share (%), by Middle-East and Africa 2025 & 2033
- Figure 78: South America Drum Liners Market Volume Share (%), by Middle-East and Africa 2025 & 2033
- Figure 79: South America Drum Liners Market Revenue (million), by Country 2025 & 2033
- Figure 80: South America Drum Liners Market Volume (K Tons), by Country 2025 & 2033
- Figure 81: South America Drum Liners Market Revenue Share (%), by Country 2025 & 2033
- Figure 82: South America Drum Liners Market Volume Share (%), by Country 2025 & 2033
- Figure 83: Europe Drum Liners Market Revenue (million), by Product Type 2025 & 2033
- Figure 84: Europe Drum Liners Market Volume (K Tons), by Product Type 2025 & 2033
- Figure 85: Europe Drum Liners Market Revenue Share (%), by Product Type 2025 & 2033
- Figure 86: Europe Drum Liners Market Volume Share (%), by Product Type 2025 & 2033
- Figure 87: Europe Drum Liners Market Revenue (million), by Packaging Type 2025 & 2033
- Figure 88: Europe Drum Liners Market Volume (K Tons), by Packaging Type 2025 & 2033
- Figure 89: Europe Drum Liners Market Revenue Share (%), by Packaging Type 2025 & 2033
- Figure 90: Europe Drum Liners Market Volume Share (%), by Packaging Type 2025 & 2033
- Figure 91: Europe Drum Liners Market Revenue (million), by End User 2025 & 2033
- Figure 92: Europe Drum Liners Market Volume (K Tons), by End User 2025 & 2033
- Figure 93: Europe Drum Liners Market Revenue Share (%), by End User 2025 & 2033
- Figure 94: Europe Drum Liners Market Volume Share (%), by End User 2025 & 2033
- Figure 95: Europe Drum Liners Market Revenue (million), by Geography 2025 & 2033
- Figure 96: Europe Drum Liners Market Volume (K Tons), by Geography 2025 & 2033
- Figure 97: Europe Drum Liners Market Revenue Share (%), by Geography 2025 & 2033
- Figure 98: Europe Drum Liners Market Volume Share (%), by Geography 2025 & 2033
- Figure 99: Europe Drum Liners Market Revenue (million), by North America 2025 & 2033
- Figure 100: Europe Drum Liners Market Volume (K Tons), by North America 2025 & 2033
- Figure 101: Europe Drum Liners Market Revenue Share (%), by North America 2025 & 2033
- Figure 102: Europe Drum Liners Market Volume Share (%), by North America 2025 & 2033
- Figure 103: Europe Drum Liners Market Revenue (million), by Europe 2025 & 2033
- Figure 104: Europe Drum Liners Market Volume (K Tons), by Europe 2025 & 2033
- Figure 105: Europe Drum Liners Market Revenue Share (%), by Europe 2025 & 2033
- Figure 106: Europe Drum Liners Market Volume Share (%), by Europe 2025 & 2033
- Figure 107: Europe Drum Liners Market Revenue (million), by Asia-Pacific 2025 & 2033
- Figure 108: Europe Drum Liners Market Volume (K Tons), by Asia-Pacific 2025 & 2033
- Figure 109: Europe Drum Liners Market Revenue Share (%), by Asia-Pacific 2025 & 2033
- Figure 110: Europe Drum Liners Market Volume Share (%), by Asia-Pacific 2025 & 2033
- Figure 111: Europe Drum Liners Market Revenue (million), by South America 2025 & 2033
- Figure 112: Europe Drum Liners Market Volume (K Tons), by South America 2025 & 2033
- Figure 113: Europe Drum Liners Market Revenue Share (%), by South America 2025 & 2033
- Figure 114: Europe Drum Liners Market Volume Share (%), by South America 2025 & 2033
- Figure 115: Europe Drum Liners Market Revenue (million), by Middle-East and Africa 2025 & 2033
- Figure 116: Europe Drum Liners Market Volume (K Tons), by Middle-East and Africa 2025 & 2033
- Figure 117: Europe Drum Liners Market Revenue Share (%), by Middle-East and Africa 2025 & 2033
- Figure 118: Europe Drum Liners Market Volume Share (%), by Middle-East and Africa 2025 & 2033
- Figure 119: Europe Drum Liners Market Revenue (million), by Country 2025 & 2033
- Figure 120: Europe Drum Liners Market Volume (K Tons), by Country 2025 & 2033
- Figure 121: Europe Drum Liners Market Revenue Share (%), by Country 2025 & 2033
- Figure 122: Europe Drum Liners Market Volume Share (%), by Country 2025 & 2033
- Figure 123: Middle East & Africa Drum Liners Market Revenue (million), by Product Type 2025 & 2033
- Figure 124: Middle East & Africa Drum Liners Market Volume (K Tons), by Product Type 2025 & 2033
- Figure 125: Middle East & Africa Drum Liners Market Revenue Share (%), by Product Type 2025 & 2033
- Figure 126: Middle East & Africa Drum Liners Market Volume Share (%), by Product Type 2025 & 2033
- Figure 127: Middle East & Africa Drum Liners Market Revenue (million), by Packaging Type 2025 & 2033
- Figure 128: Middle East & Africa Drum Liners Market Volume (K Tons), by Packaging Type 2025 & 2033
- Figure 129: Middle East & Africa Drum Liners Market Revenue Share (%), by Packaging Type 2025 & 2033
- Figure 130: Middle East & Africa Drum Liners Market Volume Share (%), by Packaging Type 2025 & 2033
- Figure 131: Middle East & Africa Drum Liners Market Revenue (million), by End User 2025 & 2033
- Figure 132: Middle East & Africa Drum Liners Market Volume (K Tons), by End User 2025 & 2033
- Figure 133: Middle East & Africa Drum Liners Market Revenue Share (%), by End User 2025 & 2033
- Figure 134: Middle East & Africa Drum Liners Market Volume Share (%), by End User 2025 & 2033
- Figure 135: Middle East & Africa Drum Liners Market Revenue (million), by Geography 2025 & 2033
- Figure 136: Middle East & Africa Drum Liners Market Volume (K Tons), by Geography 2025 & 2033
- Figure 137: Middle East & Africa Drum Liners Market Revenue Share (%), by Geography 2025 & 2033
- Figure 138: Middle East & Africa Drum Liners Market Volume Share (%), by Geography 2025 & 2033
- Figure 139: Middle East & Africa Drum Liners Market Revenue (million), by North America 2025 & 2033
- Figure 140: Middle East & Africa Drum Liners Market Volume (K Tons), by North America 2025 & 2033
- Figure 141: Middle East & Africa Drum Liners Market Revenue Share (%), by North America 2025 & 2033
- Figure 142: Middle East & Africa Drum Liners Market Volume Share (%), by North America 2025 & 2033
- Figure 143: Middle East & Africa Drum Liners Market Revenue (million), by Europe 2025 & 2033
- Figure 144: Middle East & Africa Drum Liners Market Volume (K Tons), by Europe 2025 & 2033
- Figure 145: Middle East & Africa Drum Liners Market Revenue Share (%), by Europe 2025 & 2033
- Figure 146: Middle East & Africa Drum Liners Market Volume Share (%), by Europe 2025 & 2033
- Figure 147: Middle East & Africa Drum Liners Market Revenue (million), by Asia-Pacific 2025 & 2033
- Figure 148: Middle East & Africa Drum Liners Market Volume (K Tons), by Asia-Pacific 2025 & 2033
- Figure 149: Middle East & Africa Drum Liners Market Revenue Share (%), by Asia-Pacific 2025 & 2033
- Figure 150: Middle East & Africa Drum Liners Market Volume Share (%), by Asia-Pacific 2025 & 2033
- Figure 151: Middle East & Africa Drum Liners Market Revenue (million), by South America 2025 & 2033
- Figure 152: Middle East & Africa Drum Liners Market Volume (K Tons), by South America 2025 & 2033
- Figure 153: Middle East & Africa Drum Liners Market Revenue Share (%), by South America 2025 & 2033
- Figure 154: Middle East & Africa Drum Liners Market Volume Share (%), by South America 2025 & 2033
- Figure 155: Middle East & Africa Drum Liners Market Revenue (million), by Middle-East and Africa 2025 & 2033
- Figure 156: Middle East & Africa Drum Liners Market Volume (K Tons), by Middle-East and Africa 2025 & 2033
- Figure 157: Middle East & Africa Drum Liners Market Revenue Share (%), by Middle-East and Africa 2025 & 2033
- Figure 158: Middle East & Africa Drum Liners Market Volume Share (%), by Middle-East and Africa 2025 & 2033
- Figure 159: Middle East & Africa Drum Liners Market Revenue (million), by Country 2025 & 2033
- Figure 160: Middle East & Africa Drum Liners Market Volume (K Tons), by Country 2025 & 2033
- Figure 161: Middle East & Africa Drum Liners Market Revenue Share (%), by Country 2025 & 2033
- Figure 162: Middle East & Africa Drum Liners Market Volume Share (%), by Country 2025 & 2033
- Figure 163: Asia Pacific Drum Liners Market Revenue (million), by Product Type 2025 & 2033
- Figure 164: Asia Pacific Drum Liners Market Volume (K Tons), by Product Type 2025 & 2033
- Figure 165: Asia Pacific Drum Liners Market Revenue Share (%), by Product Type 2025 & 2033
- Figure 166: Asia Pacific Drum Liners Market Volume Share (%), by Product Type 2025 & 2033
- Figure 167: Asia Pacific Drum Liners Market Revenue (million), by Packaging Type 2025 & 2033
- Figure 168: Asia Pacific Drum Liners Market Volume (K Tons), by Packaging Type 2025 & 2033
- Figure 169: Asia Pacific Drum Liners Market Revenue Share (%), by Packaging Type 2025 & 2033
- Figure 170: Asia Pacific Drum Liners Market Volume Share (%), by Packaging Type 2025 & 2033
- Figure 171: Asia Pacific Drum Liners Market Revenue (million), by End User 2025 & 2033
- Figure 172: Asia Pacific Drum Liners Market Volume (K Tons), by End User 2025 & 2033
- Figure 173: Asia Pacific Drum Liners Market Revenue Share (%), by End User 2025 & 2033
- Figure 174: Asia Pacific Drum Liners Market Volume Share (%), by End User 2025 & 2033
- Figure 175: Asia Pacific Drum Liners Market Revenue (million), by Geography 2025 & 2033
- Figure 176: Asia Pacific Drum Liners Market Volume (K Tons), by Geography 2025 & 2033
- Figure 177: Asia Pacific Drum Liners Market Revenue Share (%), by Geography 2025 & 2033
- Figure 178: Asia Pacific Drum Liners Market Volume Share (%), by Geography 2025 & 2033
- Figure 179: Asia Pacific Drum Liners Market Revenue (million), by North America 2025 & 2033
- Figure 180: Asia Pacific Drum Liners Market Volume (K Tons), by North America 2025 & 2033
- Figure 181: Asia Pacific Drum Liners Market Revenue Share (%), by North America 2025 & 2033
- Figure 182: Asia Pacific Drum Liners Market Volume Share (%), by North America 2025 & 2033
- Figure 183: Asia Pacific Drum Liners Market Revenue (million), by Europe 2025 & 2033
- Figure 184: Asia Pacific Drum Liners Market Volume (K Tons), by Europe 2025 & 2033
- Figure 185: Asia Pacific Drum Liners Market Revenue Share (%), by Europe 2025 & 2033
- Figure 186: Asia Pacific Drum Liners Market Volume Share (%), by Europe 2025 & 2033
- Figure 187: Asia Pacific Drum Liners Market Revenue (million), by Asia-Pacific 2025 & 2033
- Figure 188: Asia Pacific Drum Liners Market Volume (K Tons), by Asia-Pacific 2025 & 2033
- Figure 189: Asia Pacific Drum Liners Market Revenue Share (%), by Asia-Pacific 2025 & 2033
- Figure 190: Asia Pacific Drum Liners Market Volume Share (%), by Asia-Pacific 2025 & 2033
- Figure 191: Asia Pacific Drum Liners Market Revenue (million), by South America 2025 & 2033
- Figure 192: Asia Pacific Drum Liners Market Volume (K Tons), by South America 2025 & 2033
- Figure 193: Asia Pacific Drum Liners Market Revenue Share (%), by South America 2025 & 2033
- Figure 194: Asia Pacific Drum Liners Market Volume Share (%), by South America 2025 & 2033
- Figure 195: Asia Pacific Drum Liners Market Revenue (million), by Middle-East and Africa 2025 & 2033
- Figure 196: Asia Pacific Drum Liners Market Volume (K Tons), by Middle-East and Africa 2025 & 2033
- Figure 197: Asia Pacific Drum Liners Market Revenue Share (%), by Middle-East and Africa 2025 & 2033
- Figure 198: Asia Pacific Drum Liners Market Volume Share (%), by Middle-East and Africa 2025 & 2033
- Figure 199: Asia Pacific Drum Liners Market Revenue (million), by Country 2025 & 2033
- Figure 200: Asia Pacific Drum Liners Market Volume (K Tons), by Country 2025 & 2033
- Figure 201: Asia Pacific Drum Liners Market Revenue Share (%), by Country 2025 & 2033
- Figure 202: Asia Pacific Drum Liners Market Volume Share (%), by Country 2025 & 2033
List of Tables
- Table 1: Global Drum Liners Market Revenue million Forecast, by Product Type 2020 & 2033
- Table 2: Global Drum Liners Market Volume K Tons Forecast, by Product Type 2020 & 2033
- Table 3: Global Drum Liners Market Revenue million Forecast, by Packaging Type 2020 & 2033
- Table 4: Global Drum Liners Market Volume K Tons Forecast, by Packaging Type 2020 & 2033
- Table 5: Global Drum Liners Market Revenue million Forecast, by End User 2020 & 2033
- Table 6: Global Drum Liners Market Volume K Tons Forecast, by End User 2020 & 2033
- Table 7: Global Drum Liners Market Revenue million Forecast, by Geography 2020 & 2033
- Table 8: Global Drum Liners Market Volume K Tons Forecast, by Geography 2020 & 2033
- Table 9: Global Drum Liners Market Revenue million Forecast, by North America 2020 & 2033
- Table 10: Global Drum Liners Market Volume K Tons Forecast, by North America 2020 & 2033
- Table 11: Global Drum Liners Market Revenue million Forecast, by Europe 2020 & 2033
- Table 12: Global Drum Liners Market Volume K Tons Forecast, by Europe 2020 & 2033
- Table 13: Global Drum Liners Market Revenue million Forecast, by Asia-Pacific 2020 & 2033
- Table 14: Global Drum Liners Market Volume K Tons Forecast, by Asia-Pacific 2020 & 2033
- Table 15: Global Drum Liners Market Revenue million Forecast, by South America 2020 & 2033
- Table 16: Global Drum Liners Market Volume K Tons Forecast, by South America 2020 & 2033
- Table 17: Global Drum Liners Market Revenue million Forecast, by Middle-East and Africa 2020 & 2033
- Table 18: Global Drum Liners Market Volume K Tons Forecast, by Middle-East and Africa 2020 & 2033
- Table 19: Global Drum Liners Market Revenue million Forecast, by Region 2020 & 2033
- Table 20: Global Drum Liners Market Volume K Tons Forecast, by Region 2020 & 2033
- Table 21: Global Drum Liners Market Revenue million Forecast, by Product Type 2020 & 2033
- Table 22: Global Drum Liners Market Volume K Tons Forecast, by Product Type 2020 & 2033
- Table 23: Global Drum Liners Market Revenue million Forecast, by Packaging Type 2020 & 2033
- Table 24: Global Drum Liners Market Volume K Tons Forecast, by Packaging Type 2020 & 2033
- Table 25: Global Drum Liners Market Revenue million Forecast, by End User 2020 & 2033
- Table 26: Global Drum Liners Market Volume K Tons Forecast, by End User 2020 & 2033
- Table 27: Global Drum Liners Market Revenue million Forecast, by Geography 2020 & 2033
- Table 28: Global Drum Liners Market Volume K Tons Forecast, by Geography 2020 & 2033
- Table 29: Global Drum Liners Market Revenue million Forecast, by North America 2020 & 2033
- Table 30: Global Drum Liners Market Volume K Tons Forecast, by North America 2020 & 2033
- Table 31: Global Drum Liners Market Revenue million Forecast, by Europe 2020 & 2033
- Table 32: Global Drum Liners Market Volume K Tons Forecast, by Europe 2020 & 2033
- Table 33: Global Drum Liners Market Revenue million Forecast, by Asia-Pacific 2020 & 2033
- Table 34: Global Drum Liners Market Volume K Tons Forecast, by Asia-Pacific 2020 & 2033
- Table 35: Global Drum Liners Market Revenue million Forecast, by South America 2020 & 2033
- Table 36: Global Drum Liners Market Volume K Tons Forecast, by South America 2020 & 2033
- Table 37: Global Drum Liners Market Revenue million Forecast, by Middle-East and Africa 2020 & 2033
- Table 38: Global Drum Liners Market Volume K Tons Forecast, by Middle-East and Africa 2020 & 2033
- Table 39: Global Drum Liners Market Revenue million Forecast, by Country 2020 & 2033
- Table 40: Global Drum Liners Market Volume K Tons Forecast, by Country 2020 & 2033
- Table 41: United States Drum Liners Market Revenue (million) Forecast, by Application 2020 & 2033
- Table 42: United States Drum Liners Market Volume (K Tons) Forecast, by Application 2020 & 2033
- Table 43: Canada Drum Liners Market Revenue (million) Forecast, by Application 2020 & 2033
- Table 44: Canada Drum Liners Market Volume (K Tons) Forecast, by Application 2020 & 2033
- Table 45: Mexico Drum Liners Market Revenue (million) Forecast, by Application 2020 & 2033
- Table 46: Mexico Drum Liners Market Volume (K Tons) Forecast, by Application 2020 & 2033
- Table 47: Global Drum Liners Market Revenue million Forecast, by Product Type 2020 & 2033
- Table 48: Global Drum Liners Market Volume K Tons Forecast, by Product Type 2020 & 2033
- Table 49: Global Drum Liners Market Revenue million Forecast, by Packaging Type 2020 & 2033
- Table 50: Global Drum Liners Market Volume K Tons Forecast, by Packaging Type 2020 & 2033
- Table 51: Global Drum Liners Market Revenue million Forecast, by End User 2020 & 2033
- Table 52: Global Drum Liners Market Volume K Tons Forecast, by End User 2020 & 2033
- Table 53: Global Drum Liners Market Revenue million Forecast, by Geography 2020 & 2033
- Table 54: Global Drum Liners Market Volume K Tons Forecast, by Geography 2020 & 2033
- Table 55: Global Drum Liners Market Revenue million Forecast, by North America 2020 & 2033
- Table 56: Global Drum Liners Market Volume K Tons Forecast, by North America 2020 & 2033
- Table 57: Global Drum Liners Market Revenue million Forecast, by Europe 2020 & 2033
- Table 58: Global Drum Liners Market Volume K Tons Forecast, by Europe 2020 & 2033
- Table 59: Global Drum Liners Market Revenue million Forecast, by Asia-Pacific 2020 & 2033
- Table 60: Global Drum Liners Market Volume K Tons Forecast, by Asia-Pacific 2020 & 2033
- Table 61: Global Drum Liners Market Revenue million Forecast, by South America 2020 & 2033
- Table 62: Global Drum Liners Market Volume K Tons Forecast, by South America 2020 & 2033
- Table 63: Global Drum Liners Market Revenue million Forecast, by Middle-East and Africa 2020 & 2033
- Table 64: Global Drum Liners Market Volume K Tons Forecast, by Middle-East and Africa 2020 & 2033
- Table 65: Global Drum Liners Market Revenue million Forecast, by Country 2020 & 2033
- Table 66: Global Drum Liners Market Volume K Tons Forecast, by Country 2020 & 2033
- Table 67: Brazil Drum Liners Market Revenue (million) Forecast, by Application 2020 & 2033
- Table 68: Brazil Drum Liners Market Volume (K Tons) Forecast, by Application 2020 & 2033
- Table 69: Argentina Drum Liners Market Revenue (million) Forecast, by Application 2020 & 2033
- Table 70: Argentina Drum Liners Market Volume (K Tons) Forecast, by Application 2020 & 2033
- Table 71: Rest of South America Drum Liners Market Revenue (million) Forecast, by Application 2020 & 2033
- Table 72: Rest of South America Drum Liners Market Volume (K Tons) Forecast, by Application 2020 & 2033
- Table 73: Global Drum Liners Market Revenue million Forecast, by Product Type 2020 & 2033
- Table 74: Global Drum Liners Market Volume K Tons Forecast, by Product Type 2020 & 2033
- Table 75: Global Drum Liners Market Revenue million Forecast, by Packaging Type 2020 & 2033
- Table 76: Global Drum Liners Market Volume K Tons Forecast, by Packaging Type 2020 & 2033
- Table 77: Global Drum Liners Market Revenue million Forecast, by End User 2020 & 2033
- Table 78: Global Drum Liners Market Volume K Tons Forecast, by End User 2020 & 2033
- Table 79: Global Drum Liners Market Revenue million Forecast, by Geography 2020 & 2033
- Table 80: Global Drum Liners Market Volume K Tons Forecast, by Geography 2020 & 2033
- Table 81: Global Drum Liners Market Revenue million Forecast, by North America 2020 & 2033
- Table 82: Global Drum Liners Market Volume K Tons Forecast, by North America 2020 & 2033
- Table 83: Global Drum Liners Market Revenue million Forecast, by Europe 2020 & 2033
- Table 84: Global Drum Liners Market Volume K Tons Forecast, by Europe 2020 & 2033
- Table 85: Global Drum Liners Market Revenue million Forecast, by Asia-Pacific 2020 & 2033
- Table 86: Global Drum Liners Market Volume K Tons Forecast, by Asia-Pacific 2020 & 2033
- Table 87: Global Drum Liners Market Revenue million Forecast, by South America 2020 & 2033
- Table 88: Global Drum Liners Market Volume K Tons Forecast, by South America 2020 & 2033
- Table 89: Global Drum Liners Market Revenue million Forecast, by Middle-East and Africa 2020 & 2033
- Table 90: Global Drum Liners Market Volume K Tons Forecast, by Middle-East and Africa 2020 & 2033
- Table 91: Global Drum Liners Market Revenue million Forecast, by Country 2020 & 2033
- Table 92: Global Drum Liners Market Volume K Tons Forecast, by Country 2020 & 2033
- Table 93: United Kingdom Drum Liners Market Revenue (million) Forecast, by Application 2020 & 2033
- Table 94: United Kingdom Drum Liners Market Volume (K Tons) Forecast, by Application 2020 & 2033
- Table 95: Germany Drum Liners Market Revenue (million) Forecast, by Application 2020 & 2033
- Table 96: Germany Drum Liners Market Volume (K Tons) Forecast, by Application 2020 & 2033
- Table 97: France Drum Liners Market Revenue (million) Forecast, by Application 2020 & 2033
- Table 98: France Drum Liners Market Volume (K Tons) Forecast, by Application 2020 & 2033
- Table 99: Italy Drum Liners Market Revenue (million) Forecast, by Application 2020 & 2033
- Table 100: Italy Drum Liners Market Volume (K Tons) Forecast, by Application 2020 & 2033
- Table 101: Spain Drum Liners Market Revenue (million) Forecast, by Application 2020 & 2033
- Table 102: Spain Drum Liners Market Volume (K Tons) Forecast, by Application 2020 & 2033
- Table 103: Russia Drum Liners Market Revenue (million) Forecast, by Application 2020 & 2033
- Table 104: Russia Drum Liners Market Volume (K Tons) Forecast, by Application 2020 & 2033
- Table 105: Benelux Drum Liners Market Revenue (million) Forecast, by Application 2020 & 2033
- Table 106: Benelux Drum Liners Market Volume (K Tons) Forecast, by Application 2020 & 2033
- Table 107: Nordics Drum Liners Market Revenue (million) Forecast, by Application 2020 & 2033
- Table 108: Nordics Drum Liners Market Volume (K Tons) Forecast, by Application 2020 & 2033
- Table 109: Rest of Europe Drum Liners Market Revenue (million) Forecast, by Application 2020 & 2033
- Table 110: Rest of Europe Drum Liners Market Volume (K Tons) Forecast, by Application 2020 & 2033
- Table 111: Global Drum Liners Market Revenue million Forecast, by Product Type 2020 & 2033
- Table 112: Global Drum Liners Market Volume K Tons Forecast, by Product Type 2020 & 2033
- Table 113: Global Drum Liners Market Revenue million Forecast, by Packaging Type 2020 & 2033
- Table 114: Global Drum Liners Market Volume K Tons Forecast, by Packaging Type 2020 & 2033
- Table 115: Global Drum Liners Market Revenue million Forecast, by End User 2020 & 2033
- Table 116: Global Drum Liners Market Volume K Tons Forecast, by End User 2020 & 2033
- Table 117: Global Drum Liners Market Revenue million Forecast, by Geography 2020 & 2033
- Table 118: Global Drum Liners Market Volume K Tons Forecast, by Geography 2020 & 2033
- Table 119: Global Drum Liners Market Revenue million Forecast, by North America 2020 & 2033
- Table 120: Global Drum Liners Market Volume K Tons Forecast, by North America 2020 & 2033
- Table 121: Global Drum Liners Market Revenue million Forecast, by Europe 2020 & 2033
- Table 122: Global Drum Liners Market Volume K Tons Forecast, by Europe 2020 & 2033
- Table 123: Global Drum Liners Market Revenue million Forecast, by Asia-Pacific 2020 & 2033
- Table 124: Global Drum Liners Market Volume K Tons Forecast, by Asia-Pacific 2020 & 2033
- Table 125: Global Drum Liners Market Revenue million Forecast, by South America 2020 & 2033
- Table 126: Global Drum Liners Market Volume K Tons Forecast, by South America 2020 & 2033
- Table 127: Global Drum Liners Market Revenue million Forecast, by Middle-East and Africa 2020 & 2033
- Table 128: Global Drum Liners Market Volume K Tons Forecast, by Middle-East and Africa 2020 & 2033
- Table 129: Global Drum Liners Market Revenue million Forecast, by Country 2020 & 2033
- Table 130: Global Drum Liners Market Volume K Tons Forecast, by Country 2020 & 2033
- Table 131: Turkey Drum Liners Market Revenue (million) Forecast, by Application 2020 & 2033
- Table 132: Turkey Drum Liners Market Volume (K Tons) Forecast, by Application 2020 & 2033
- Table 133: Israel Drum Liners Market Revenue (million) Forecast, by Application 2020 & 2033
- Table 134: Israel Drum Liners Market Volume (K Tons) Forecast, by Application 2020 & 2033
- Table 135: GCC Drum Liners Market Revenue (million) Forecast, by Application 2020 & 2033
- Table 136: GCC Drum Liners Market Volume (K Tons) Forecast, by Application 2020 & 2033
- Table 137: North Africa Drum Liners Market Revenue (million) Forecast, by Application 2020 & 2033
- Table 138: North Africa Drum Liners Market Volume (K Tons) Forecast, by Application 2020 & 2033
- Table 139: South Africa Drum Liners Market Revenue (million) Forecast, by Application 2020 & 2033
- Table 140: South Africa Drum Liners Market Volume (K Tons) Forecast, by Application 2020 & 2033
- Table 141: Rest of Middle East & Africa Drum Liners Market Revenue (million) Forecast, by Application 2020 & 2033
- Table 142: Rest of Middle East & Africa Drum Liners Market Volume (K Tons) Forecast, by Application 2020 & 2033
- Table 143: Global Drum Liners Market Revenue million Forecast, by Product Type 2020 & 2033
- Table 144: Global Drum Liners Market Volume K Tons Forecast, by Product Type 2020 & 2033
- Table 145: Global Drum Liners Market Revenue million Forecast, by Packaging Type 2020 & 2033
- Table 146: Global Drum Liners Market Volume K Tons Forecast, by Packaging Type 2020 & 2033
- Table 147: Global Drum Liners Market Revenue million Forecast, by End User 2020 & 2033
- Table 148: Global Drum Liners Market Volume K Tons Forecast, by End User 2020 & 2033
- Table 149: Global Drum Liners Market Revenue million Forecast, by Geography 2020 & 2033
- Table 150: Global Drum Liners Market Volume K Tons Forecast, by Geography 2020 & 2033
- Table 151: Global Drum Liners Market Revenue million Forecast, by North America 2020 & 2033
- Table 152: Global Drum Liners Market Volume K Tons Forecast, by North America 2020 & 2033
- Table 153: Global Drum Liners Market Revenue million Forecast, by Europe 2020 & 2033
- Table 154: Global Drum Liners Market Volume K Tons Forecast, by Europe 2020 & 2033
- Table 155: Global Drum Liners Market Revenue million Forecast, by Asia-Pacific 2020 & 2033
- Table 156: Global Drum Liners Market Volume K Tons Forecast, by Asia-Pacific 2020 & 2033
- Table 157: Global Drum Liners Market Revenue million Forecast, by South America 2020 & 2033
- Table 158: Global Drum Liners Market Volume K Tons Forecast, by South America 2020 & 2033
- Table 159: Global Drum Liners Market Revenue million Forecast, by Middle-East and Africa 2020 & 2033
- Table 160: Global Drum Liners Market Volume K Tons Forecast, by Middle-East and Africa 2020 & 2033
- Table 161: Global Drum Liners Market Revenue million Forecast, by Country 2020 & 2033
- Table 162: Global Drum Liners Market Volume K Tons Forecast, by Country 2020 & 2033
- Table 163: China Drum Liners Market Revenue (million) Forecast, by Application 2020 & 2033
- Table 164: China Drum Liners Market Volume (K Tons) Forecast, by Application 2020 & 2033
- Table 165: India Drum Liners Market Revenue (million) Forecast, by Application 2020 & 2033
- Table 166: India Drum Liners Market Volume (K Tons) Forecast, by Application 2020 & 2033
- Table 167: Japan Drum Liners Market Revenue (million) Forecast, by Application 2020 & 2033
- Table 168: Japan Drum Liners Market Volume (K Tons) Forecast, by Application 2020 & 2033
- Table 169: South Korea Drum Liners Market Revenue (million) Forecast, by Application 2020 & 2033
- Table 170: South Korea Drum Liners Market Volume (K Tons) Forecast, by Application 2020 & 2033
- Table 171: ASEAN Drum Liners Market Revenue (million) Forecast, by Application 2020 & 2033
- Table 172: ASEAN Drum Liners Market Volume (K Tons) Forecast, by Application 2020 & 2033
- Table 173: Oceania Drum Liners Market Revenue (million) Forecast, by Application 2020 & 2033
- Table 174: Oceania Drum Liners Market Volume (K Tons) Forecast, by Application 2020 & 2033
- Table 175: Rest of Asia Pacific Drum Liners Market Revenue (million) Forecast, by Application 2020 & 2033
- Table 176: Rest of Asia Pacific Drum Liners Market Volume (K Tons) Forecast, by Application 2020 & 2033
Frequently Asked Questions
1. What is the projected Compound Annual Growth Rate (CAGR) of the Drum Liners Market?
The projected CAGR is approximately 6.2%.
2. Which companies are prominent players in the Drum Liners Market?
Key companies in the market include Greif, Terdex, Bagla Group, Bemis Company Inc, WINPAK LTD, Shenyang Weiming Technology Co Ltd, Bollore Group, Intertape Polymer Ltd, Berry Global Inc, Sealed Air.
3. What are the main segments of the Drum Liners Market?
The market segments include Product Type, Packaging Type, End User, Geography, North America, Europe, Asia-Pacific, South America, Middle-East and Africa.
4. Can you provide details about the market size?
The market size is estimated to be USD 710 million as of 2022.
5. What are some drivers contributing to market growth?
Advancements in Materials or Designs that Enhance Durability Which Led to Increase the Drum Liner Market.
6. What are the notable trends driving market growth?
Chemicals and Flammables is the Fastest Growing Segment.
7. Are there any restraints impacting market growth?
Higher Production Costs or Expensive Raw Materials can Limit Market Accessibility.
8. Can you provide examples of recent developments in the market?
February 2024: Berry Global announced a merger with Glatfelter Corporation, valued at USD 3.6 billion. The merger involves combining the majority of Berry’s Health, Hygiene, and Specialties segment with its Global Nonwovens and Films business (HNNF) to establish a new publicly traded company, NewCo.
9. What pricing options are available for accessing the report?
Pricing options include single-user, multi-user, and enterprise licenses priced at USD 4750, USD 5250, and USD 8750 respectively.
10. Is the market size provided in terms of value or volume?
The market size is provided in terms of value, measured in million and volume, measured in K Tons.
11. Are there any specific market keywords associated with the report?
Yes, the market keyword associated with the report is "Drum Liners Market," which aids in identifying and referencing the specific market segment covered.
12. How do I determine which pricing option suits my needs best?
The pricing options vary based on user requirements and access needs. Individual users may opt for single-user licenses, while businesses requiring broader access may choose multi-user or enterprise licenses for cost-effective access to the report.
13. Are there any additional resources or data provided in the Drum Liners Market report?
While the report offers comprehensive insights, it's advisable to review the specific contents or supplementary materials provided to ascertain if additional resources or data are available.
14. How can I stay updated on further developments or reports in the Drum Liners Market?
To stay informed about further developments, trends, and reports in the Drum Liners Market, consider subscribing to industry newsletters, following relevant companies and organizations, or regularly checking reputable industry news sources and publications.
Methodology
Step 1 - Identification of Relevant Samples Size from Population Database


Step 2 - Approaches for Defining Global Market Size (Value, Volume* & Price*)

Note*: In applicable scenarios
Step 3 - Data Sources
Primary Research
- Web Analytics
- Survey Reports
- Research Institute
- Latest Research Reports
- Opinion Leaders
Secondary Research
- Annual Reports
- White Paper
- Latest Press Release
- Industry Association
- Paid Database
- Investor Presentations

Step 4 - Data Triangulation
Involves using different sources of information in order to increase the validity of a study
These sources are likely to be stakeholders in a program - participants, other researchers, program staff, other community members, and so on.
Then we put all data in single framework & apply various statistical tools to find out the dynamic on the market.
During the analysis stage, feedback from the stakeholder groups would be compared to determine areas of agreement as well as areas of divergence

