Key Insights
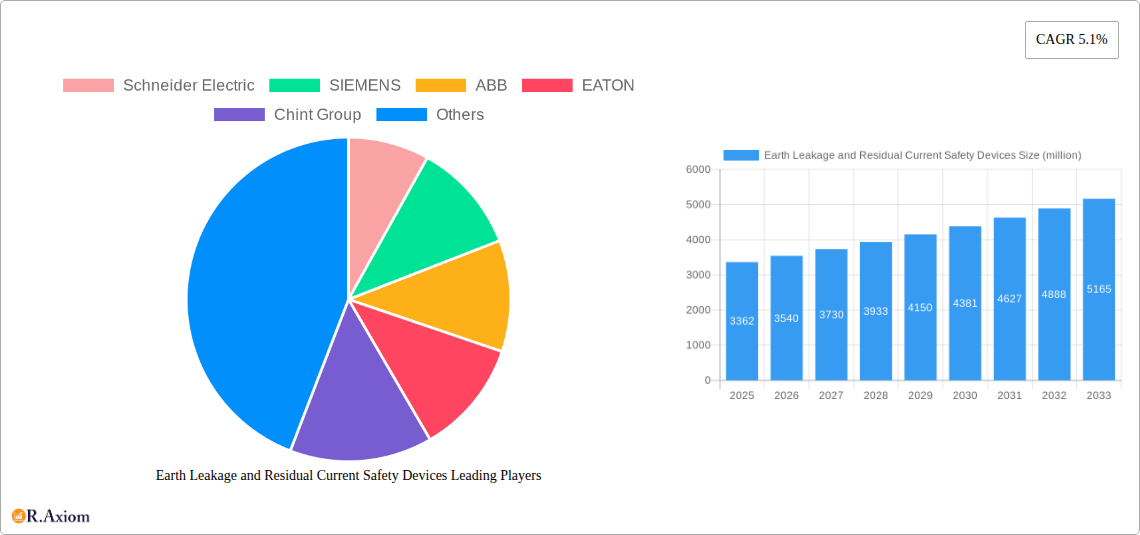
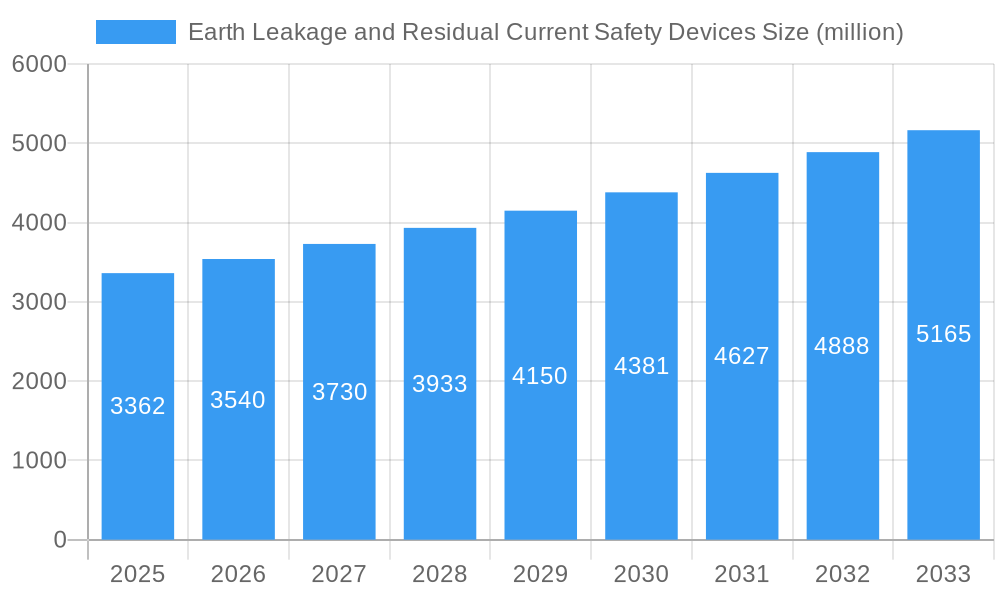
The global market for Earth Leakage and Residual Current Safety Devices (ELCBs/RCDs) is experiencing steady growth, projected to reach a value of $3.362 billion in 2025, with a Compound Annual Growth Rate (CAGR) of 5.1% from 2019 to 2033. This growth is driven by increasing safety concerns across residential, commercial, and industrial sectors, stringent building codes mandating ELCB/RCD installations, and rising awareness of electrical safety hazards. The market is witnessing a shift towards advanced features, including higher sensitivity devices, communication capabilities for improved monitoring and remote diagnostics, and integration with smart home systems. Furthermore, the growing adoption of renewable energy sources necessitates robust safety devices like ELCBs/RCDs to ensure grid stability and user protection. Key players like Schneider Electric, Siemens, ABB, and Eaton are driving innovation and market expansion through strategic partnerships, mergers and acquisitions, and the development of sophisticated, reliable products. The expansion into developing economies presents significant untapped potential, fueled by increasing electrification rates and rising construction activity. However, challenges exist, including the high initial investment cost associated with installing ELCBs/RCDs, especially in underdeveloped regions, and potential competition from cheaper, less reliable alternatives.
Earth Leakage and Residual Current Safety Devices Market Size (In Billion)
Despite these challenges, the long-term outlook for the ELCB/RCD market remains positive. Continued urbanization and industrialization, particularly in emerging markets, will fuel substantial demand for these safety devices. The increasing adoption of energy-efficient technologies and the ongoing focus on improving workplace and home safety standards will further propel market expansion. Competitive landscape dynamics suggest continued innovation and strategic partnerships, driving product differentiation and broadening the market reach of major players. Future growth will likely hinge on the successful development and adoption of next-generation devices offering increased functionality, enhanced reliability, and better integration with smart grids and building automation systems. The focus will shift towards providing customized solutions for various applications, catering to specific market needs and ensuring compliance with evolving safety regulations across diverse geographical locations.
Earth Leakage and Residual Current Safety Devices Company Market Share
Earth Leakage and Residual Current Safety Devices Market Report: 2019-2033
This comprehensive report provides a detailed analysis of the global Earth Leakage and Residual Current Safety Devices market, offering invaluable insights for industry stakeholders, investors, and strategic decision-makers. The study covers the period 2019-2033, with a base year of 2025 and a forecast period of 2025-2033. The report utilizes rigorous research methodologies to project a market valued at $XX million in 2025, expected to reach $XX million by 2033, exhibiting a CAGR of XX%.
Earth Leakage and Residual Current Safety Devices Market Concentration & Innovation
This section analyzes the competitive landscape, innovation trends, and regulatory influences shaping the Earth Leakage and Residual Current Safety Devices market. The market exhibits a moderately concentrated structure, with key players like Schneider Electric, SIEMENS, ABB, and Eaton holding significant market share. However, regional players and specialized manufacturers are also making inroads, fostering competition.
- Market Share: Schneider Electric holds an estimated XX% market share in 2025, followed by SIEMENS with XX%, ABB with XX%, and Eaton with XX%. The remaining market share is distributed amongst other players, including Chint Group, DELIXI ELECTRIC, and Legrand.
- M&A Activity: The past five years have witnessed significant M&A activity, with deal values exceeding $XX million. These transactions primarily focused on expanding product portfolios, enhancing geographical reach, and accessing new technologies. For example, a notable acquisition in 2022 involved [Company A] acquiring [Company B] for $XX million.
- Innovation Drivers: The increasing demand for enhanced safety features, stringent regulatory compliance requirements, and the growing adoption of smart technologies are driving innovation in the sector. New products incorporating advanced features like arc fault detection and communication capabilities are gaining traction.
- Regulatory Frameworks: Stringent safety regulations in various regions, such as IEC standards and local building codes, are impacting product design and adoption rates. These regulations are driving the demand for compliant devices.
- Product Substitutes: While there are limited direct substitutes, alternative safety solutions like fuses and circuit breakers are considered indirect alternatives and are influencing market growth.
- End-User Trends: Increasing awareness of safety and rising adoption of energy-efficient solutions are influencing demand in various industries.
Earth Leakage and Residual Current Safety Devices Industry Trends & Insights
The Earth Leakage and Residual Current Safety Devices market is experiencing robust growth fueled by several key factors. The rising adoption of these devices in residential, commercial, and industrial sectors, owing to increased awareness of electrical safety, is a primary growth driver. Furthermore, the increasing demand for smart home and building automation systems is creating opportunities for integration with sophisticated safety devices.
Technological advancements, including the incorporation of advanced sensors and communication protocols, are enhancing the functionality and reliability of these devices. The market is witnessing a shift towards smart safety devices that can provide real-time monitoring and alerts. Consumer preferences are increasingly leaning towards energy-efficient and user-friendly products, driving innovation and product differentiation. Competitive dynamics are characterized by both established players and emerging companies vying for market share through product innovation, strategic partnerships, and expansion into new markets. The market is projected to exhibit a CAGR of XX% during the forecast period, with a market penetration rate of XX% by 2033.
Dominant Markets & Segments in Earth Leakage and Residual Current Safety Devices
The Asia-Pacific region dominates the global market for Earth Leakage and Residual Current Safety Devices, driven by rapid infrastructure development, rising industrialization, and increasing disposable incomes. China and India are significant contributors to this regional dominance.
- Key Drivers in Asia-Pacific:
- Rapid urbanization and infrastructure development.
- Growing industrialization and manufacturing activities.
- Rising awareness of electrical safety and increased demand for compliant devices.
- Favorable government policies and initiatives supporting energy efficiency and safety standards.
- High population density and increased electricity consumption.
The European and North American markets also exhibit substantial growth, fueled by stringent safety regulations and increasing investments in energy-efficient building technologies. However, these markets are characterized by higher levels of market saturation compared to the Asia-Pacific region.
Earth Leakage and Residual Current Safety Devices Product Developments
Significant advancements in Earth Leakage and Residual Current Safety Devices are focusing on enhanced safety features, improved energy efficiency, and greater integration capabilities. The latest models incorporate smart technologies, providing remote monitoring, predictive maintenance, and improved diagnostics. This trend aligns with the growing adoption of smart homes and buildings, creating a strong market fit for these advanced devices. Miniaturization and modular designs are also gaining traction, enabling flexible installation options. The integration of these devices into larger electrical systems enhances overall safety and efficiency.
Report Scope & Segmentation Analysis
This report segments the Earth Leakage and Residual Current Safety Devices market based on several factors: Product type (e.g., RCCBs, RCDs, ELBs), voltage rating, end-use sector (residential, commercial, industrial), and geography. Each segment offers unique growth prospects and competitive dynamics. The residential segment is expected to grow steadily, driven by increasing construction activities and consumer awareness. The industrial segment shows significant growth potential due to the high demand for safety and reliability in industrial settings. Geographical segmentation reveals the strongest growth in the Asia-Pacific region due to rapid urbanization and industrial development.
Key Drivers of Earth Leakage and Residual Current Safety Devices Growth
Several factors fuel the growth of the Earth Leakage and Residual Current Safety Devices market. Stringent safety regulations worldwide are mandating the adoption of these devices, improving safety and reducing electrical accidents. Technological advancements, such as the development of smart safety devices with remote monitoring capabilities, are enhancing market appeal. Furthermore, rising construction activities globally are driving demand for these essential safety components, particularly in developing economies undergoing rapid infrastructure development.
Challenges in the Earth Leakage and Residual Current Safety Devices Sector
The Earth Leakage and Residual Current Safety Devices market faces certain challenges. Supply chain disruptions caused by global events (e.g., geopolitical tensions, pandemics) can affect production and pricing. Intense competition among established and emerging players can lead to price pressures and reduced profit margins. The counterfeit market also represents a considerable concern, potentially compromising safety and undermining consumer confidence. These factors, alongside variations in regulatory frameworks across different regions, pose challenges to market growth.
Emerging Opportunities in Earth Leakage and Residual Current Safety Devices
Several emerging opportunities exist within the Earth Leakage and Residual Current Safety Devices market. The integration of these devices with smart home and building automation systems is opening up new avenues for growth. The increasing demand for energy-efficient solutions is driving innovation in energy-saving devices. The expansion into untapped markets in developing economies presents substantial potential for growth. The rise of the Internet of Things (IoT) offers opportunities for creating connected safety systems.
Leading Players in the Earth Leakage and Residual Current Safety Devices Market
- Schneider Electric
- SIEMENS
- ABB
- EATON
- Chint Group
- DELIXI ELECTRIC
- Legrand
- Rockwell Automation
- BG Electrical
- LOVATO Electric
- Sassin International Electric
- IMO Precision Controls
- Makel
- Doepke
- HIMEL
- GEYA Electrical
- Protek Electronics
Key Developments in Earth Leakage and Residual Current Safety Devices Industry
- 2023: Schneider Electric launches a new range of smart RCCBs with integrated communication capabilities.
- 2022: ABB acquires a smaller competitor, expanding its product portfolio and market reach. [Specific deal details if available]
- 2021: New safety regulations introduced in [Region] impact product design and demand.
- 2020: Supply chain disruptions impact production and pricing across the industry.
- 2019: Increased adoption of smart home technologies drives demand for compatible safety devices.
Strategic Outlook for Earth Leakage and Residual Current Safety Devices Market
The future of the Earth Leakage and Residual Current Safety Devices market appears bright. Continued technological advancements, stringent safety regulations, and increasing construction activities are expected to drive sustained growth. The integration of these devices into smart grids and broader IoT ecosystems will unlock new opportunities. Expanding into emerging markets and focusing on product innovation will be key for companies seeking to capitalize on this evolving landscape. The focus on energy efficiency and sustainability will play an even larger role, driving innovation toward smart and energy-efficient solutions.
Earth Leakage and Residual Current Safety Devices Segmentation
-
1. Application
- 1.1. Home
- 1.2. Commercial
- 1.3. Industrial
-
2. Types
- 2.1. Type AC RCD
- 2.2. Type A RCD
- 2.3. Type B RCD
- 2.4. Type F RCD
- 2.5. Others
Earth Leakage and Residual Current Safety Devices Segmentation By Geography
-
1. North America
- 1.1. United States
- 1.2. Canada
- 1.3. Mexico
-
2. South America
- 2.1. Brazil
- 2.2. Argentina
- 2.3. Rest of South America
-
3. Europe
- 3.1. United Kingdom
- 3.2. Germany
- 3.3. France
- 3.4. Italy
- 3.5. Spain
- 3.6. Russia
- 3.7. Benelux
- 3.8. Nordics
- 3.9. Rest of Europe
-
4. Middle East & Africa
- 4.1. Turkey
- 4.2. Israel
- 4.3. GCC
- 4.4. North Africa
- 4.5. South Africa
- 4.6. Rest of Middle East & Africa
-
5. Asia Pacific
- 5.1. China
- 5.2. India
- 5.3. Japan
- 5.4. South Korea
- 5.5. ASEAN
- 5.6. Oceania
- 5.7. Rest of Asia Pacific
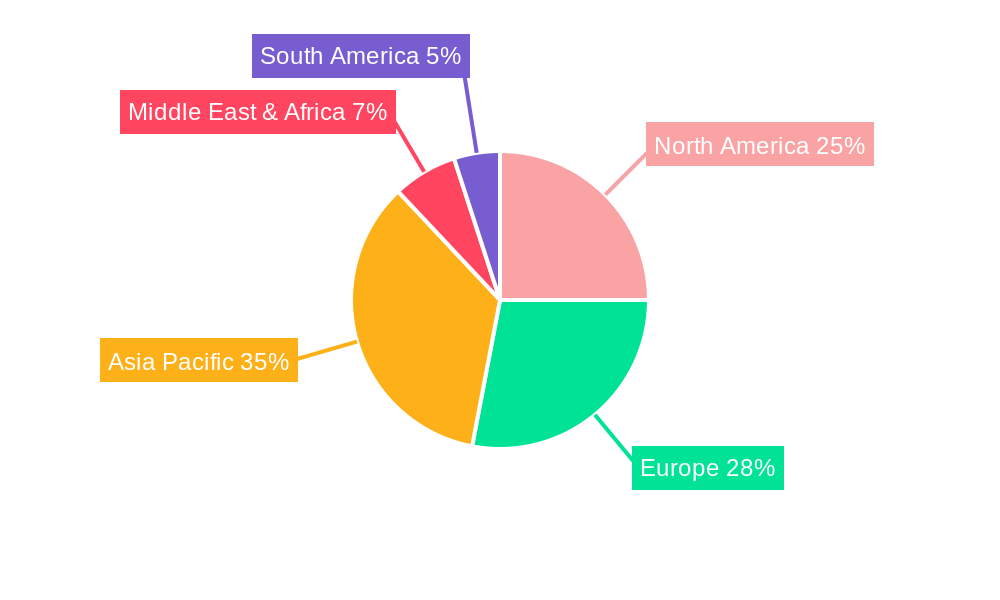
Earth Leakage and Residual Current Safety Devices Regional Market Share
Geographic Coverage of Earth Leakage and Residual Current Safety Devices
Earth Leakage and Residual Current Safety Devices REPORT HIGHLIGHTS
| Aspects | Details |
|---|---|
| Study Period | 2020-2034 |
| Base Year | 2025 |
| Estimated Year | 2026 |
| Forecast Period | 2026-2034 |
| Historical Period | 2020-2025 |
| Growth Rate | CAGR of 5.1% from 2020-2034 |
| Segmentation |
|
Table of Contents
- 1. Introduction
- 1.1. Research Scope
- 1.2. Market Segmentation
- 1.3. Research Objective
- 1.4. Definitions and Assumptions
- 2. Executive Summary
- 2.1. Market Snapshot
- 3. Market Dynamics
- 3.1. Market Drivers
- 3.2. Market Restrains
- 3.3. Market Trends
- 3.4. Market Opportunities
- 4. Market Factor Analysis
- 4.1. Porters Five Forces
- 4.1.1. Bargaining Power of Suppliers
- 4.1.2. Bargaining Power of Buyers
- 4.1.3. Threat of New Entrants
- 4.1.4. Threat of Substitutes
- 4.1.5. Competitive Rivalry
- 4.2. PESTEL analysis
- 4.3. BCG Analysis
- 4.3.1. Stars (High Growth, High Market Share)
- 4.3.2. Cash Cows (Low Growth, High Market Share)
- 4.3.3. Question Mark (High Growth, Low Market Share)
- 4.3.4. Dogs (Low Growth, Low Market Share)
- 4.4. Ansoff Matrix Analysis
- 4.5. Supply Chain Analysis
- 4.6. Regulatory Landscape
- 4.7. Current Market Potential and Opportunity Assessment (TAM–SAM–SOM Framework)
- 4.8. RAX Analyst Note
- 4.1. Porters Five Forces
- 5. Market Analysis, Insights and Forecast 2021-2033
- 5.1. Market Analysis, Insights and Forecast - by Application
- 5.1.1. Home
- 5.1.2. Commercial
- 5.1.3. Industrial
- 5.2. Market Analysis, Insights and Forecast - by Types
- 5.2.1. Type AC RCD
- 5.2.2. Type A RCD
- 5.2.3. Type B RCD
- 5.2.4. Type F RCD
- 5.2.5. Others
- 5.3. Market Analysis, Insights and Forecast - by Region
- 5.3.1. North America
- 5.3.2. South America
- 5.3.3. Europe
- 5.3.4. Middle East & Africa
- 5.3.5. Asia Pacific
- 5.1. Market Analysis, Insights and Forecast - by Application
- 6. Global Earth Leakage and Residual Current Safety Devices Analysis, Insights and Forecast, 2021-2033
- 6.1. Market Analysis, Insights and Forecast - by Application
- 6.1.1. Home
- 6.1.2. Commercial
- 6.1.3. Industrial
- 6.2. Market Analysis, Insights and Forecast - by Types
- 6.2.1. Type AC RCD
- 6.2.2. Type A RCD
- 6.2.3. Type B RCD
- 6.2.4. Type F RCD
- 6.2.5. Others
- 6.1. Market Analysis, Insights and Forecast - by Application
- 7. North America Earth Leakage and Residual Current Safety Devices Analysis, Insights and Forecast, 2020-2032
- 7.1. Market Analysis, Insights and Forecast - by Application
- 7.1.1. Home
- 7.1.2. Commercial
- 7.1.3. Industrial
- 7.2. Market Analysis, Insights and Forecast - by Types
- 7.2.1. Type AC RCD
- 7.2.2. Type A RCD
- 7.2.3. Type B RCD
- 7.2.4. Type F RCD
- 7.2.5. Others
- 7.1. Market Analysis, Insights and Forecast - by Application
- 8. South America Earth Leakage and Residual Current Safety Devices Analysis, Insights and Forecast, 2020-2032
- 8.1. Market Analysis, Insights and Forecast - by Application
- 8.1.1. Home
- 8.1.2. Commercial
- 8.1.3. Industrial
- 8.2. Market Analysis, Insights and Forecast - by Types
- 8.2.1. Type AC RCD
- 8.2.2. Type A RCD
- 8.2.3. Type B RCD
- 8.2.4. Type F RCD
- 8.2.5. Others
- 8.1. Market Analysis, Insights and Forecast - by Application
- 9. Europe Earth Leakage and Residual Current Safety Devices Analysis, Insights and Forecast, 2020-2032
- 9.1. Market Analysis, Insights and Forecast - by Application
- 9.1.1. Home
- 9.1.2. Commercial
- 9.1.3. Industrial
- 9.2. Market Analysis, Insights and Forecast - by Types
- 9.2.1. Type AC RCD
- 9.2.2. Type A RCD
- 9.2.3. Type B RCD
- 9.2.4. Type F RCD
- 9.2.5. Others
- 9.1. Market Analysis, Insights and Forecast - by Application
- 10. Middle East & Africa Earth Leakage and Residual Current Safety Devices Analysis, Insights and Forecast, 2020-2032
- 10.1. Market Analysis, Insights and Forecast - by Application
- 10.1.1. Home
- 10.1.2. Commercial
- 10.1.3. Industrial
- 10.2. Market Analysis, Insights and Forecast - by Types
- 10.2.1. Type AC RCD
- 10.2.2. Type A RCD
- 10.2.3. Type B RCD
- 10.2.4. Type F RCD
- 10.2.5. Others
- 10.1. Market Analysis, Insights and Forecast - by Application
- 11. Asia Pacific Earth Leakage and Residual Current Safety Devices Analysis, Insights and Forecast, 2020-2032
- 11.1. Market Analysis, Insights and Forecast - by Application
- 11.1.1. Home
- 11.1.2. Commercial
- 11.1.3. Industrial
- 11.2. Market Analysis, Insights and Forecast - by Types
- 11.2.1. Type AC RCD
- 11.2.2. Type A RCD
- 11.2.3. Type B RCD
- 11.2.4. Type F RCD
- 11.2.5. Others
- 11.1. Market Analysis, Insights and Forecast - by Application
- 12. Competitive Analysis
- 12.1. Company Profiles
- 12.1.1 Schneider Electric
- 12.1.1.1. Company Overview
- 12.1.1.2. Products
- 12.1.1.3. Company Financials
- 12.1.1.4. SWOT Analysis
- 12.1.2 SIEMENS
- 12.1.2.1. Company Overview
- 12.1.2.2. Products
- 12.1.2.3. Company Financials
- 12.1.2.4. SWOT Analysis
- 12.1.3 ABB
- 12.1.3.1. Company Overview
- 12.1.3.2. Products
- 12.1.3.3. Company Financials
- 12.1.3.4. SWOT Analysis
- 12.1.4 EATON
- 12.1.4.1. Company Overview
- 12.1.4.2. Products
- 12.1.4.3. Company Financials
- 12.1.4.4. SWOT Analysis
- 12.1.5 Chint Group
- 12.1.5.1. Company Overview
- 12.1.5.2. Products
- 12.1.5.3. Company Financials
- 12.1.5.4. SWOT Analysis
- 12.1.6 DELIXI ELECTRIC
- 12.1.6.1. Company Overview
- 12.1.6.2. Products
- 12.1.6.3. Company Financials
- 12.1.6.4. SWOT Analysis
- 12.1.7 Legrand
- 12.1.7.1. Company Overview
- 12.1.7.2. Products
- 12.1.7.3. Company Financials
- 12.1.7.4. SWOT Analysis
- 12.1.8 Rockwell Automation
- 12.1.8.1. Company Overview
- 12.1.8.2. Products
- 12.1.8.3. Company Financials
- 12.1.8.4. SWOT Analysis
- 12.1.9 BG Electrical
- 12.1.9.1. Company Overview
- 12.1.9.2. Products
- 12.1.9.3. Company Financials
- 12.1.9.4. SWOT Analysis
- 12.1.10 LOVATO Electric
- 12.1.10.1. Company Overview
- 12.1.10.2. Products
- 12.1.10.3. Company Financials
- 12.1.10.4. SWOT Analysis
- 12.1.11 Sassin International Electric
- 12.1.11.1. Company Overview
- 12.1.11.2. Products
- 12.1.11.3. Company Financials
- 12.1.11.4. SWOT Analysis
- 12.1.12 IMO Precision Controls
- 12.1.12.1. Company Overview
- 12.1.12.2. Products
- 12.1.12.3. Company Financials
- 12.1.12.4. SWOT Analysis
- 12.1.13 Makel
- 12.1.13.1. Company Overview
- 12.1.13.2. Products
- 12.1.13.3. Company Financials
- 12.1.13.4. SWOT Analysis
- 12.1.14 Doepke
- 12.1.14.1. Company Overview
- 12.1.14.2. Products
- 12.1.14.3. Company Financials
- 12.1.14.4. SWOT Analysis
- 12.1.15 HIMEL
- 12.1.15.1. Company Overview
- 12.1.15.2. Products
- 12.1.15.3. Company Financials
- 12.1.15.4. SWOT Analysis
- 12.1.16 GEYA Electrical
- 12.1.16.1. Company Overview
- 12.1.16.2. Products
- 12.1.16.3. Company Financials
- 12.1.16.4. SWOT Analysis
- 12.1.17 Protek Electronics
- 12.1.17.1. Company Overview
- 12.1.17.2. Products
- 12.1.17.3. Company Financials
- 12.1.17.4. SWOT Analysis
- 12.1.1 Schneider Electric
- 12.2. Market Entropy
- 12.2.1 Company's Key Areas Served
- 12.2.2 Recent Developments
- 12.3. Company Market Share Analysis 2025
- 12.3.1 Top 5 Companies Market Share Analysis
- 12.3.2 Top 3 Companies Market Share Analysis
- 12.4. List of Potential Customers
- 13. Research Methodology
List of Figures
- Figure 1: Global Earth Leakage and Residual Current Safety Devices Revenue Breakdown (million, %) by Region 2025 & 2033
- Figure 2: Global Earth Leakage and Residual Current Safety Devices Volume Breakdown (K, %) by Region 2025 & 2033
- Figure 3: North America Earth Leakage and Residual Current Safety Devices Revenue (million), by Application 2025 & 2033
- Figure 4: North America Earth Leakage and Residual Current Safety Devices Volume (K), by Application 2025 & 2033
- Figure 5: North America Earth Leakage and Residual Current Safety Devices Revenue Share (%), by Application 2025 & 2033
- Figure 6: North America Earth Leakage and Residual Current Safety Devices Volume Share (%), by Application 2025 & 2033
- Figure 7: North America Earth Leakage and Residual Current Safety Devices Revenue (million), by Types 2025 & 2033
- Figure 8: North America Earth Leakage and Residual Current Safety Devices Volume (K), by Types 2025 & 2033
- Figure 9: North America Earth Leakage and Residual Current Safety Devices Revenue Share (%), by Types 2025 & 2033
- Figure 10: North America Earth Leakage and Residual Current Safety Devices Volume Share (%), by Types 2025 & 2033
- Figure 11: North America Earth Leakage and Residual Current Safety Devices Revenue (million), by Country 2025 & 2033
- Figure 12: North America Earth Leakage and Residual Current Safety Devices Volume (K), by Country 2025 & 2033
- Figure 13: North America Earth Leakage and Residual Current Safety Devices Revenue Share (%), by Country 2025 & 2033
- Figure 14: North America Earth Leakage and Residual Current Safety Devices Volume Share (%), by Country 2025 & 2033
- Figure 15: South America Earth Leakage and Residual Current Safety Devices Revenue (million), by Application 2025 & 2033
- Figure 16: South America Earth Leakage and Residual Current Safety Devices Volume (K), by Application 2025 & 2033
- Figure 17: South America Earth Leakage and Residual Current Safety Devices Revenue Share (%), by Application 2025 & 2033
- Figure 18: South America Earth Leakage and Residual Current Safety Devices Volume Share (%), by Application 2025 & 2033
- Figure 19: South America Earth Leakage and Residual Current Safety Devices Revenue (million), by Types 2025 & 2033
- Figure 20: South America Earth Leakage and Residual Current Safety Devices Volume (K), by Types 2025 & 2033
- Figure 21: South America Earth Leakage and Residual Current Safety Devices Revenue Share (%), by Types 2025 & 2033
- Figure 22: South America Earth Leakage and Residual Current Safety Devices Volume Share (%), by Types 2025 & 2033
- Figure 23: South America Earth Leakage and Residual Current Safety Devices Revenue (million), by Country 2025 & 2033
- Figure 24: South America Earth Leakage and Residual Current Safety Devices Volume (K), by Country 2025 & 2033
- Figure 25: South America Earth Leakage and Residual Current Safety Devices Revenue Share (%), by Country 2025 & 2033
- Figure 26: South America Earth Leakage and Residual Current Safety Devices Volume Share (%), by Country 2025 & 2033
- Figure 27: Europe Earth Leakage and Residual Current Safety Devices Revenue (million), by Application 2025 & 2033
- Figure 28: Europe Earth Leakage and Residual Current Safety Devices Volume (K), by Application 2025 & 2033
- Figure 29: Europe Earth Leakage and Residual Current Safety Devices Revenue Share (%), by Application 2025 & 2033
- Figure 30: Europe Earth Leakage and Residual Current Safety Devices Volume Share (%), by Application 2025 & 2033
- Figure 31: Europe Earth Leakage and Residual Current Safety Devices Revenue (million), by Types 2025 & 2033
- Figure 32: Europe Earth Leakage and Residual Current Safety Devices Volume (K), by Types 2025 & 2033
- Figure 33: Europe Earth Leakage and Residual Current Safety Devices Revenue Share (%), by Types 2025 & 2033
- Figure 34: Europe Earth Leakage and Residual Current Safety Devices Volume Share (%), by Types 2025 & 2033
- Figure 35: Europe Earth Leakage and Residual Current Safety Devices Revenue (million), by Country 2025 & 2033
- Figure 36: Europe Earth Leakage and Residual Current Safety Devices Volume (K), by Country 2025 & 2033
- Figure 37: Europe Earth Leakage and Residual Current Safety Devices Revenue Share (%), by Country 2025 & 2033
- Figure 38: Europe Earth Leakage and Residual Current Safety Devices Volume Share (%), by Country 2025 & 2033
- Figure 39: Middle East & Africa Earth Leakage and Residual Current Safety Devices Revenue (million), by Application 2025 & 2033
- Figure 40: Middle East & Africa Earth Leakage and Residual Current Safety Devices Volume (K), by Application 2025 & 2033
- Figure 41: Middle East & Africa Earth Leakage and Residual Current Safety Devices Revenue Share (%), by Application 2025 & 2033
- Figure 42: Middle East & Africa Earth Leakage and Residual Current Safety Devices Volume Share (%), by Application 2025 & 2033
- Figure 43: Middle East & Africa Earth Leakage and Residual Current Safety Devices Revenue (million), by Types 2025 & 2033
- Figure 44: Middle East & Africa Earth Leakage and Residual Current Safety Devices Volume (K), by Types 2025 & 2033
- Figure 45: Middle East & Africa Earth Leakage and Residual Current Safety Devices Revenue Share (%), by Types 2025 & 2033
- Figure 46: Middle East & Africa Earth Leakage and Residual Current Safety Devices Volume Share (%), by Types 2025 & 2033
- Figure 47: Middle East & Africa Earth Leakage and Residual Current Safety Devices Revenue (million), by Country 2025 & 2033
- Figure 48: Middle East & Africa Earth Leakage and Residual Current Safety Devices Volume (K), by Country 2025 & 2033
- Figure 49: Middle East & Africa Earth Leakage and Residual Current Safety Devices Revenue Share (%), by Country 2025 & 2033
- Figure 50: Middle East & Africa Earth Leakage and Residual Current Safety Devices Volume Share (%), by Country 2025 & 2033
- Figure 51: Asia Pacific Earth Leakage and Residual Current Safety Devices Revenue (million), by Application 2025 & 2033
- Figure 52: Asia Pacific Earth Leakage and Residual Current Safety Devices Volume (K), by Application 2025 & 2033
- Figure 53: Asia Pacific Earth Leakage and Residual Current Safety Devices Revenue Share (%), by Application 2025 & 2033
- Figure 54: Asia Pacific Earth Leakage and Residual Current Safety Devices Volume Share (%), by Application 2025 & 2033
- Figure 55: Asia Pacific Earth Leakage and Residual Current Safety Devices Revenue (million), by Types 2025 & 2033
- Figure 56: Asia Pacific Earth Leakage and Residual Current Safety Devices Volume (K), by Types 2025 & 2033
- Figure 57: Asia Pacific Earth Leakage and Residual Current Safety Devices Revenue Share (%), by Types 2025 & 2033
- Figure 58: Asia Pacific Earth Leakage and Residual Current Safety Devices Volume Share (%), by Types 2025 & 2033
- Figure 59: Asia Pacific Earth Leakage and Residual Current Safety Devices Revenue (million), by Country 2025 & 2033
- Figure 60: Asia Pacific Earth Leakage and Residual Current Safety Devices Volume (K), by Country 2025 & 2033
- Figure 61: Asia Pacific Earth Leakage and Residual Current Safety Devices Revenue Share (%), by Country 2025 & 2033
- Figure 62: Asia Pacific Earth Leakage and Residual Current Safety Devices Volume Share (%), by Country 2025 & 2033
List of Tables
- Table 1: Global Earth Leakage and Residual Current Safety Devices Revenue million Forecast, by Application 2020 & 2033
- Table 2: Global Earth Leakage and Residual Current Safety Devices Volume K Forecast, by Application 2020 & 2033
- Table 3: Global Earth Leakage and Residual Current Safety Devices Revenue million Forecast, by Types 2020 & 2033
- Table 4: Global Earth Leakage and Residual Current Safety Devices Volume K Forecast, by Types 2020 & 2033
- Table 5: Global Earth Leakage and Residual Current Safety Devices Revenue million Forecast, by Region 2020 & 2033
- Table 6: Global Earth Leakage and Residual Current Safety Devices Volume K Forecast, by Region 2020 & 2033
- Table 7: Global Earth Leakage and Residual Current Safety Devices Revenue million Forecast, by Application 2020 & 2033
- Table 8: Global Earth Leakage and Residual Current Safety Devices Volume K Forecast, by Application 2020 & 2033
- Table 9: Global Earth Leakage and Residual Current Safety Devices Revenue million Forecast, by Types 2020 & 2033
- Table 10: Global Earth Leakage and Residual Current Safety Devices Volume K Forecast, by Types 2020 & 2033
- Table 11: Global Earth Leakage and Residual Current Safety Devices Revenue million Forecast, by Country 2020 & 2033
- Table 12: Global Earth Leakage and Residual Current Safety Devices Volume K Forecast, by Country 2020 & 2033
- Table 13: United States Earth Leakage and Residual Current Safety Devices Revenue (million) Forecast, by Application 2020 & 2033
- Table 14: United States Earth Leakage and Residual Current Safety Devices Volume (K) Forecast, by Application 2020 & 2033
- Table 15: Canada Earth Leakage and Residual Current Safety Devices Revenue (million) Forecast, by Application 2020 & 2033
- Table 16: Canada Earth Leakage and Residual Current Safety Devices Volume (K) Forecast, by Application 2020 & 2033
- Table 17: Mexico Earth Leakage and Residual Current Safety Devices Revenue (million) Forecast, by Application 2020 & 2033
- Table 18: Mexico Earth Leakage and Residual Current Safety Devices Volume (K) Forecast, by Application 2020 & 2033
- Table 19: Global Earth Leakage and Residual Current Safety Devices Revenue million Forecast, by Application 2020 & 2033
- Table 20: Global Earth Leakage and Residual Current Safety Devices Volume K Forecast, by Application 2020 & 2033
- Table 21: Global Earth Leakage and Residual Current Safety Devices Revenue million Forecast, by Types 2020 & 2033
- Table 22: Global Earth Leakage and Residual Current Safety Devices Volume K Forecast, by Types 2020 & 2033
- Table 23: Global Earth Leakage and Residual Current Safety Devices Revenue million Forecast, by Country 2020 & 2033
- Table 24: Global Earth Leakage and Residual Current Safety Devices Volume K Forecast, by Country 2020 & 2033
- Table 25: Brazil Earth Leakage and Residual Current Safety Devices Revenue (million) Forecast, by Application 2020 & 2033
- Table 26: Brazil Earth Leakage and Residual Current Safety Devices Volume (K) Forecast, by Application 2020 & 2033
- Table 27: Argentina Earth Leakage and Residual Current Safety Devices Revenue (million) Forecast, by Application 2020 & 2033
- Table 28: Argentina Earth Leakage and Residual Current Safety Devices Volume (K) Forecast, by Application 2020 & 2033
- Table 29: Rest of South America Earth Leakage and Residual Current Safety Devices Revenue (million) Forecast, by Application 2020 & 2033
- Table 30: Rest of South America Earth Leakage and Residual Current Safety Devices Volume (K) Forecast, by Application 2020 & 2033
- Table 31: Global Earth Leakage and Residual Current Safety Devices Revenue million Forecast, by Application 2020 & 2033
- Table 32: Global Earth Leakage and Residual Current Safety Devices Volume K Forecast, by Application 2020 & 2033
- Table 33: Global Earth Leakage and Residual Current Safety Devices Revenue million Forecast, by Types 2020 & 2033
- Table 34: Global Earth Leakage and Residual Current Safety Devices Volume K Forecast, by Types 2020 & 2033
- Table 35: Global Earth Leakage and Residual Current Safety Devices Revenue million Forecast, by Country 2020 & 2033
- Table 36: Global Earth Leakage and Residual Current Safety Devices Volume K Forecast, by Country 2020 & 2033
- Table 37: United Kingdom Earth Leakage and Residual Current Safety Devices Revenue (million) Forecast, by Application 2020 & 2033
- Table 38: United Kingdom Earth Leakage and Residual Current Safety Devices Volume (K) Forecast, by Application 2020 & 2033
- Table 39: Germany Earth Leakage and Residual Current Safety Devices Revenue (million) Forecast, by Application 2020 & 2033
- Table 40: Germany Earth Leakage and Residual Current Safety Devices Volume (K) Forecast, by Application 2020 & 2033
- Table 41: France Earth Leakage and Residual Current Safety Devices Revenue (million) Forecast, by Application 2020 & 2033
- Table 42: France Earth Leakage and Residual Current Safety Devices Volume (K) Forecast, by Application 2020 & 2033
- Table 43: Italy Earth Leakage and Residual Current Safety Devices Revenue (million) Forecast, by Application 2020 & 2033
- Table 44: Italy Earth Leakage and Residual Current Safety Devices Volume (K) Forecast, by Application 2020 & 2033
- Table 45: Spain Earth Leakage and Residual Current Safety Devices Revenue (million) Forecast, by Application 2020 & 2033
- Table 46: Spain Earth Leakage and Residual Current Safety Devices Volume (K) Forecast, by Application 2020 & 2033
- Table 47: Russia Earth Leakage and Residual Current Safety Devices Revenue (million) Forecast, by Application 2020 & 2033
- Table 48: Russia Earth Leakage and Residual Current Safety Devices Volume (K) Forecast, by Application 2020 & 2033
- Table 49: Benelux Earth Leakage and Residual Current Safety Devices Revenue (million) Forecast, by Application 2020 & 2033
- Table 50: Benelux Earth Leakage and Residual Current Safety Devices Volume (K) Forecast, by Application 2020 & 2033
- Table 51: Nordics Earth Leakage and Residual Current Safety Devices Revenue (million) Forecast, by Application 2020 & 2033
- Table 52: Nordics Earth Leakage and Residual Current Safety Devices Volume (K) Forecast, by Application 2020 & 2033
- Table 53: Rest of Europe Earth Leakage and Residual Current Safety Devices Revenue (million) Forecast, by Application 2020 & 2033
- Table 54: Rest of Europe Earth Leakage and Residual Current Safety Devices Volume (K) Forecast, by Application 2020 & 2033
- Table 55: Global Earth Leakage and Residual Current Safety Devices Revenue million Forecast, by Application 2020 & 2033
- Table 56: Global Earth Leakage and Residual Current Safety Devices Volume K Forecast, by Application 2020 & 2033
- Table 57: Global Earth Leakage and Residual Current Safety Devices Revenue million Forecast, by Types 2020 & 2033
- Table 58: Global Earth Leakage and Residual Current Safety Devices Volume K Forecast, by Types 2020 & 2033
- Table 59: Global Earth Leakage and Residual Current Safety Devices Revenue million Forecast, by Country 2020 & 2033
- Table 60: Global Earth Leakage and Residual Current Safety Devices Volume K Forecast, by Country 2020 & 2033
- Table 61: Turkey Earth Leakage and Residual Current Safety Devices Revenue (million) Forecast, by Application 2020 & 2033
- Table 62: Turkey Earth Leakage and Residual Current Safety Devices Volume (K) Forecast, by Application 2020 & 2033
- Table 63: Israel Earth Leakage and Residual Current Safety Devices Revenue (million) Forecast, by Application 2020 & 2033
- Table 64: Israel Earth Leakage and Residual Current Safety Devices Volume (K) Forecast, by Application 2020 & 2033
- Table 65: GCC Earth Leakage and Residual Current Safety Devices Revenue (million) Forecast, by Application 2020 & 2033
- Table 66: GCC Earth Leakage and Residual Current Safety Devices Volume (K) Forecast, by Application 2020 & 2033
- Table 67: North Africa Earth Leakage and Residual Current Safety Devices Revenue (million) Forecast, by Application 2020 & 2033
- Table 68: North Africa Earth Leakage and Residual Current Safety Devices Volume (K) Forecast, by Application 2020 & 2033
- Table 69: South Africa Earth Leakage and Residual Current Safety Devices Revenue (million) Forecast, by Application 2020 & 2033
- Table 70: South Africa Earth Leakage and Residual Current Safety Devices Volume (K) Forecast, by Application 2020 & 2033
- Table 71: Rest of Middle East & Africa Earth Leakage and Residual Current Safety Devices Revenue (million) Forecast, by Application 2020 & 2033
- Table 72: Rest of Middle East & Africa Earth Leakage and Residual Current Safety Devices Volume (K) Forecast, by Application 2020 & 2033
- Table 73: Global Earth Leakage and Residual Current Safety Devices Revenue million Forecast, by Application 2020 & 2033
- Table 74: Global Earth Leakage and Residual Current Safety Devices Volume K Forecast, by Application 2020 & 2033
- Table 75: Global Earth Leakage and Residual Current Safety Devices Revenue million Forecast, by Types 2020 & 2033
- Table 76: Global Earth Leakage and Residual Current Safety Devices Volume K Forecast, by Types 2020 & 2033
- Table 77: Global Earth Leakage and Residual Current Safety Devices Revenue million Forecast, by Country 2020 & 2033
- Table 78: Global Earth Leakage and Residual Current Safety Devices Volume K Forecast, by Country 2020 & 2033
- Table 79: China Earth Leakage and Residual Current Safety Devices Revenue (million) Forecast, by Application 2020 & 2033
- Table 80: China Earth Leakage and Residual Current Safety Devices Volume (K) Forecast, by Application 2020 & 2033
- Table 81: India Earth Leakage and Residual Current Safety Devices Revenue (million) Forecast, by Application 2020 & 2033
- Table 82: India Earth Leakage and Residual Current Safety Devices Volume (K) Forecast, by Application 2020 & 2033
- Table 83: Japan Earth Leakage and Residual Current Safety Devices Revenue (million) Forecast, by Application 2020 & 2033
- Table 84: Japan Earth Leakage and Residual Current Safety Devices Volume (K) Forecast, by Application 2020 & 2033
- Table 85: South Korea Earth Leakage and Residual Current Safety Devices Revenue (million) Forecast, by Application 2020 & 2033
- Table 86: South Korea Earth Leakage and Residual Current Safety Devices Volume (K) Forecast, by Application 2020 & 2033
- Table 87: ASEAN Earth Leakage and Residual Current Safety Devices Revenue (million) Forecast, by Application 2020 & 2033
- Table 88: ASEAN Earth Leakage and Residual Current Safety Devices Volume (K) Forecast, by Application 2020 & 2033
- Table 89: Oceania Earth Leakage and Residual Current Safety Devices Revenue (million) Forecast, by Application 2020 & 2033
- Table 90: Oceania Earth Leakage and Residual Current Safety Devices Volume (K) Forecast, by Application 2020 & 2033
- Table 91: Rest of Asia Pacific Earth Leakage and Residual Current Safety Devices Revenue (million) Forecast, by Application 2020 & 2033
- Table 92: Rest of Asia Pacific Earth Leakage and Residual Current Safety Devices Volume (K) Forecast, by Application 2020 & 2033
Frequently Asked Questions
1. What is the projected Compound Annual Growth Rate (CAGR) of the Earth Leakage and Residual Current Safety Devices?
The projected CAGR is approximately 5.1%.
2. Which companies are prominent players in the Earth Leakage and Residual Current Safety Devices?
Key companies in the market include Schneider Electric, SIEMENS, ABB, EATON, Chint Group, DELIXI ELECTRIC, Legrand, Rockwell Automation, BG Electrical, LOVATO Electric, Sassin International Electric, IMO Precision Controls, Makel, Doepke, HIMEL, GEYA Electrical, Protek Electronics.
3. What are the main segments of the Earth Leakage and Residual Current Safety Devices?
The market segments include Application, Types.
4. Can you provide details about the market size?
The market size is estimated to be USD 3362 million as of 2022.
5. What are some drivers contributing to market growth?
N/A
6. What are the notable trends driving market growth?
N/A
7. Are there any restraints impacting market growth?
N/A
8. Can you provide examples of recent developments in the market?
N/A
9. What pricing options are available for accessing the report?
Pricing options include single-user, multi-user, and enterprise licenses priced at USD 4350.00, USD 6525.00, and USD 8700.00 respectively.
10. Is the market size provided in terms of value or volume?
The market size is provided in terms of value, measured in million and volume, measured in K.
11. Are there any specific market keywords associated with the report?
Yes, the market keyword associated with the report is "Earth Leakage and Residual Current Safety Devices," which aids in identifying and referencing the specific market segment covered.
12. How do I determine which pricing option suits my needs best?
The pricing options vary based on user requirements and access needs. Individual users may opt for single-user licenses, while businesses requiring broader access may choose multi-user or enterprise licenses for cost-effective access to the report.
13. Are there any additional resources or data provided in the Earth Leakage and Residual Current Safety Devices report?
While the report offers comprehensive insights, it's advisable to review the specific contents or supplementary materials provided to ascertain if additional resources or data are available.
14. How can I stay updated on further developments or reports in the Earth Leakage and Residual Current Safety Devices?
To stay informed about further developments, trends, and reports in the Earth Leakage and Residual Current Safety Devices, consider subscribing to industry newsletters, following relevant companies and organizations, or regularly checking reputable industry news sources and publications.
Methodology
Step 1 - Identification of Relevant Samples Size from Population Database


Step 2 - Approaches for Defining Global Market Size (Value, Volume* & Price*)

Note*: In applicable scenarios
Step 3 - Data Sources
Primary Research
- Web Analytics
- Survey Reports
- Research Institute
- Latest Research Reports
- Opinion Leaders
Secondary Research
- Annual Reports
- White Paper
- Latest Press Release
- Industry Association
- Paid Database
- Investor Presentations

Step 4 - Data Triangulation
Involves using different sources of information in order to increase the validity of a study
These sources are likely to be stakeholders in a program - participants, other researchers, program staff, other community members, and so on.
Then we put all data in single framework & apply various statistical tools to find out the dynamic on the market.
During the analysis stage, feedback from the stakeholder groups would be compared to determine areas of agreement as well as areas of divergence

