
Key Insights
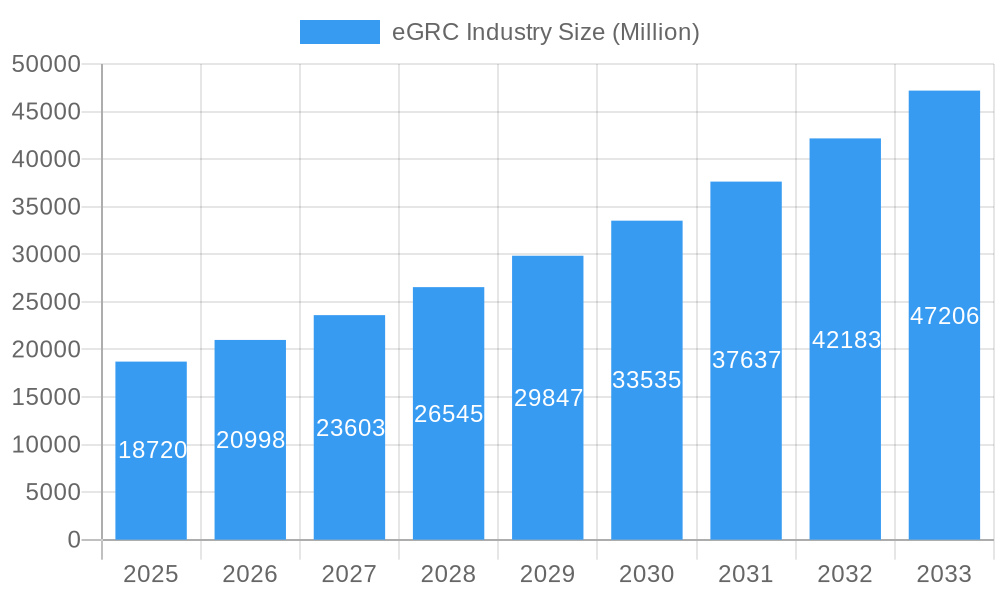
The eGRC (Enterprise Governance, Risk, and Compliance) market is poised for substantial growth, projected to reach a market size of $18.72 billion in 2025 with a robust Compound Annual Growth Rate (CAGR) of 12.38%. This expansion is fueled by an escalating need for organizations to navigate complex regulatory landscapes, mitigate burgeoning risks, and maintain strong corporate governance. The increasing prevalence of cyber threats, data privacy regulations like GDPR and CCPA, and the growing emphasis on ethical business practices are compelling enterprises across all sectors to invest in integrated eGRC solutions. The software segment is expected to lead the market, providing advanced analytical capabilities and automation tools. However, the services segment, encompassing consulting, implementation, and managed services, will also witness significant traction as businesses seek expert guidance to effectively deploy and leverage eGRC platforms.
eGRC Industry Market Size (In Billion)

The market is segmented by enterprise size, with both Small and Medium Enterprises (SMEs) and Large Enterprises actively adopting eGRC solutions. SMEs, often facing resource constraints and a growing regulatory burden, are increasingly recognizing the value of scalable eGRC software, while large enterprises are investing in comprehensive, integrated platforms to manage their complex global operations and diverse risk portfolios. Key end-user industries driving this demand include BFSI, which faces stringent financial regulations, and Healthcare, grappling with patient data privacy and compliance. The Manufacturing and IT & Telecom sectors are also significant contributors, driven by operational efficiency, supply chain risks, and evolving technological landscapes. Geographically, North America and Europe are currently leading markets due to their mature regulatory environments and high adoption rates of advanced technologies. However, the Asia Pacific region is anticipated to exhibit the fastest growth, propelled by rapid digital transformation, increasing regulatory awareness, and a burgeoning number of enterprises seeking to establish robust compliance frameworks.
eGRC Industry Company Market Share
eGRC Industry Market Concentration & Innovation
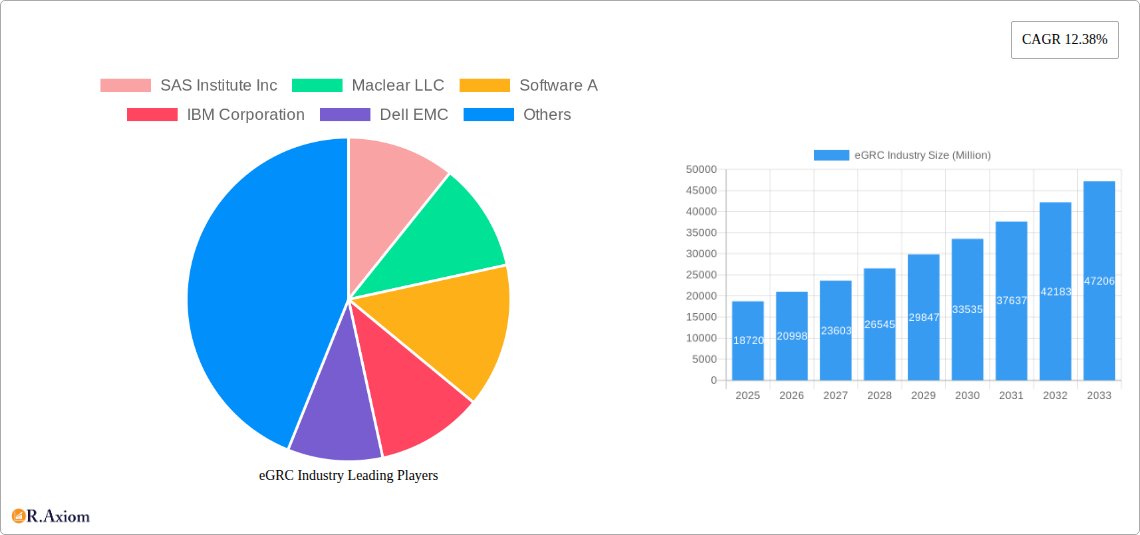
The eGRC (enterprise Governance, Risk, and Compliance) industry is characterized by a moderate level of market concentration, with a mix of established giants and emerging specialized players. The market share for leading companies like IBM Corporation and SAP SE is estimated to be in the range of 15-20% each, reflecting their extensive product portfolios and global reach. M&A activities are a significant driver of consolidation and innovation, with deal values often exceeding $500 million for strategic acquisitions. Innovation in eGRC is primarily driven by the increasing complexity of regulatory landscapes, the growing threat of cyber risks, and the demand for integrated, automated GRC solutions. Key innovation drivers include artificial intelligence (AI) and machine learning (ML) for predictive risk analytics, blockchain for enhanced data integrity, and cloud-based solutions for scalability and accessibility.
- Regulatory Frameworks: Evolving regulations such as GDPR, CCPA, and industry-specific mandates (e.g., HIPAA in healthcare, SOX in finance) are compelling organizations to adopt robust eGRC solutions.
- Product Substitutes: While direct substitutes are limited, manual processes and fragmented point solutions can act as indirect competition, highlighting the need for comprehensive eGRC platforms.
- End-User Trends: A growing emphasis on proactive risk management, data privacy, and ethical business practices is fueling demand for advanced eGRC capabilities.
- M&A Activities: Recent acquisitions in the eGRC space, valued in the hundreds of millions, indicate a trend towards consolidating capabilities and expanding market reach.
eGRC Industry Trends & Insights
The eGRC industry is experiencing robust growth, projected to achieve a Compound Annual Growth Rate (CAGR) of approximately 12-15% over the forecast period (2025-2033). This surge is primarily attributed to the escalating complexity of global regulations, the pervasive threat of cyberattacks, and the increasing recognition of the strategic importance of integrated risk management. As businesses operate in a more interconnected and data-intensive environment, the need to maintain compliance, mitigate risks, and ensure robust governance has become paramount. Technological disruptions are significantly reshaping the eGRC landscape. The integration of AI and ML is enabling predictive risk analytics, automating control testing, and providing deeper insights into potential vulnerabilities. Cloud-based eGRC solutions are gaining traction due to their scalability, flexibility, and cost-effectiveness, allowing organizations of all sizes to access advanced GRC capabilities. Furthermore, the growing emphasis on data privacy and security, driven by regulations like GDPR and CCPA, is a major catalyst for eGRC adoption. Consumers and stakeholders are increasingly demanding transparency and accountability from organizations regarding how their data is handled and how risks are managed. This shift in consumer preferences is pushing companies to invest in comprehensive GRC strategies. Competitive dynamics within the eGRC market are intensifying, with established players continuously innovating and new entrants focusing on niche solutions. The market penetration of eGRC solutions is steadily increasing across various end-user industries, driven by a combination of regulatory mandates, risk mitigation imperatives, and the pursuit of operational efficiency. The trend towards digital transformation across all sectors further necessitates robust eGRC frameworks to navigate the associated risks and ensure compliance in the evolving digital ecosystem.
Dominant Markets & Segments in eGRC Industry
The BFSI (Banking, Financial Services, and Insurance) sector stands out as the dominant end-user industry within the eGRC market, driven by stringent regulatory requirements and the high-stakes nature of financial transactions. The market size within BFSI is estimated to be in the billions of dollars. Within this sector, Large Enterprises represent the largest segment for eGRC solutions, accounting for an estimated 60-65% of the total market share. These organizations face complex compliance obligations and a higher volume of risks, necessitating sophisticated and comprehensive GRC platforms.
Dominant End-User Industry: BFSI
- Key Drivers: Stringent regulatory environments (e.g., Basel III, Dodd-Frank), high susceptibility to financial crime and cyber threats, increasing demand for operational resilience, and evolving customer expectations for data security and privacy.
- Market Size: Estimated to be in the tens of billions of dollars globally.
- Dominance Analysis: Financial institutions are mandated to adhere to a vast array of regulations, making eGRC solutions indispensable for survival and growth. The constant threat of sophisticated cyberattacks and the need to manage counterparty risk further solidify BFSI's position as the leading adopter.
Dominant Enterprise Size: Large Enterprise
- Key Drivers: Complex organizational structures, extensive compliance requirements across multiple jurisdictions, higher risk appetites, significant investment capacity, and the need for integrated GRC for global operations.
- Market Share: Estimated to constitute 60-65% of the overall eGRC market.
- Dominance Analysis: Large enterprises often operate in highly regulated industries and manage a broad spectrum of risks. Their global presence necessitates unified GRC strategies to ensure consistent compliance and risk management across diverse business units and geographical locations.
Dominant Segment Type: Software
- Key Drivers: Increasing demand for automation, scalability, and integration of GRC processes. Cloud-based software solutions offer flexibility and cost-efficiency.
- Market Share: Estimated to capture a significant portion, exceeding 70% of the eGRC market.
- Dominance Analysis: Software solutions form the backbone of modern eGRC adoption, providing the tools to manage policies, risks, controls, audits, and compliance workflows. The continuous evolution of software capabilities, including AI and ML integration, drives its dominance.
eGRC Industry Product Developments
Product developments in the eGRC industry are significantly focused on enhancing automation, intelligence, and integration. Companies are leveraging AI and ML to provide predictive analytics, streamline control testing, and identify emerging risks proactively. Cloud-native solutions are gaining prominence, offering enhanced scalability, accessibility, and faster deployment. The competitive advantage lies in the ability of these platforms to offer a holistic view of risk and compliance across the enterprise, reducing manual efforts and improving decision-making. Key technological trends include the adoption of natural language processing (NLP) for policy analysis and the integration of blockchain for immutable audit trails.
eGRC Industry Report Scope & Segmentation Analysis
This report provides a comprehensive analysis of the eGRC industry, covering key segments to offer deep insights into market dynamics and growth trajectories. The segmentation includes Type (Software, Services), Size of the Enterprise (Small and Medium Enterprise, Large Enterprise), and End-User Industry (BFSI, Healthcare, Manufacturing, IT and Telecom, Other End-User Vertical).
- Type: The Software segment is projected to dominate, driven by the increasing demand for automated and integrated GRC platforms. Services, while important for implementation and consulting, will see steady growth as organizations seek expertise in navigating complex GRC landscapes.
- Size of the Enterprise: Large Enterprises will continue to represent the largest market share due to their extensive compliance needs and investment capabilities. However, Small and Medium Enterprises (SMEs) are increasingly adopting eGRC solutions, driven by growing regulatory pressures and the availability of scalable, cloud-based offerings, indicating significant growth potential.
- End-User Industry: The BFSI sector is expected to maintain its leadership, followed by Healthcare and IT and Telecom, as these industries face evolving regulatory environments and significant data security risks. Manufacturing and Other End-User Verticals are also expected to exhibit robust growth.
Key Drivers of eGRC Industry Growth
The eGRC industry's growth is propelled by a confluence of critical factors.
- Regulatory Intensification: An ever-expanding web of global and industry-specific regulations, such as data privacy laws (GDPR, CCPA) and financial compliance mandates, compels organizations to invest in robust eGRC solutions.
- Escalating Cyber Threats: The increasing sophistication and frequency of cyberattacks necessitate comprehensive risk management strategies, including strong governance and compliance frameworks to protect sensitive data and ensure business continuity.
- Digital Transformation: As businesses embrace digital technologies, they encounter new risks. eGRC solutions are crucial for managing these evolving digital risks and ensuring compliance in a connected world.
- Data Privacy Imperatives: Growing public and regulatory concern over data privacy fuels demand for solutions that ensure secure data handling and compliance with privacy regulations.
Challenges in the eGRC Industry Sector
Despite its robust growth, the eGRC industry faces several hurdles.
- Complexity of Implementation: Implementing comprehensive eGRC solutions can be complex and time-consuming, requiring significant resource allocation and integration with existing systems.
- Cost of Adoption: For some Small and Medium Enterprises, the initial investment in advanced eGRC software and services can be a significant barrier.
- Talent Shortage: A scarcity of skilled professionals with expertise in both GRC principles and technology can impede the effective deployment and utilization of eGRC solutions.
- Resistance to Change: Overcoming organizational inertia and gaining buy-in from all stakeholders for a holistic GRC approach can be challenging.
Emerging Opportunities in eGRC Industry
The eGRC industry is ripe with emerging opportunities, driven by technological advancements and evolving business needs.
- AI and Machine Learning Integration: The expanded use of AI and ML in eGRC platforms offers significant opportunities for predictive analytics, automated risk assessments, and enhanced compliance monitoring, leading to more proactive risk management.
- Focus on ESG (Environmental, Social, and Governance): Growing investor and consumer pressure for sustainable and ethical business practices is creating a demand for eGRC solutions that can track and report on ESG metrics.
- Cloud-Native eGRC: The continued migration to cloud-based solutions presents opportunities for vendors offering scalable, flexible, and cost-effective eGRC platforms tailored for diverse business needs.
- Rise of SMEs: As regulatory scrutiny increases, SMEs are becoming more aware of the need for eGRC, creating a substantial opportunity for vendors offering tailored and affordable solutions.
Leading Players in the eGRC Industry Market
- SAS Institute Inc
- Maclear LLC
- Software A
- IBM Corporation
- Dell EMC
- MetricStream Inc
- Wolters Kluwer
- Oracle Corporation
- Future Shield Inc
- SAP SE
Key Developments in eGRC Industry Industry
- October 2023: Pathlock, a leading provider of application governance, risk, and compliance (GRC), launched an updated release of its Application Access Governance (AAG) product, integrated within its Pathlock Cloud platform. This advancement aims to automate controls testing and enforcement for various business applications and Enterprise Resource Planning (ERP) systems, significantly reducing manual processes associated with application access risks across critical business systems.
- June 2023: Federal bank regulatory agencies released final joint guidance designed to help banking organizations manage the risks associated with third-party relationships, particularly those involving financial technology (FinTech) companies. The guidance includes illustrative examples to assist banking organizations, especially community banks, in aligning their risk management practices with the nature and risk profile of their third-party relationships.
Strategic Outlook for eGRC Industry Market
The strategic outlook for the eGRC industry is exceptionally positive, driven by sustained demand for robust governance, risk mitigation, and compliance management. The ongoing evolution of regulatory landscapes worldwide, coupled with the escalating sophistication of cyber threats, ensures a continuous need for advanced eGRC solutions. The strategic imperative for businesses to achieve operational resilience, maintain data integrity, and foster stakeholder trust will further fuel market expansion. Key growth catalysts include the widespread adoption of AI and ML for predictive risk analytics, the increasing focus on ESG compliance, and the continued shift towards cloud-based eGRC platforms that offer scalability and agility. Opportunities for market players lie in developing integrated solutions that address the interconnected nature of modern risks and compliance challenges, catering to the specific needs of various industry verticals and enterprise sizes, and providing value-added services that support effective implementation and ongoing optimization of eGRC strategies.
eGRC Industry Segmentation
-
1. Type
- 1.1. Software
- 1.2. Services
-
2. Size of the Enterprise
- 2.1. Small and Medium Enterprise
- 2.2. Large Enterprise
-
3. End-User Industry
- 3.1. BFSI
- 3.2. Healthcare
- 3.3. Manufacturing
- 3.4. IT and Telecom
- 3.5. Other End-User Vertical
eGRC Industry Segmentation By Geography
- 1. North America
- 2. Europe
- 3. Asia Pacific
- 4. Latin America
- 5. Middle East and Africa
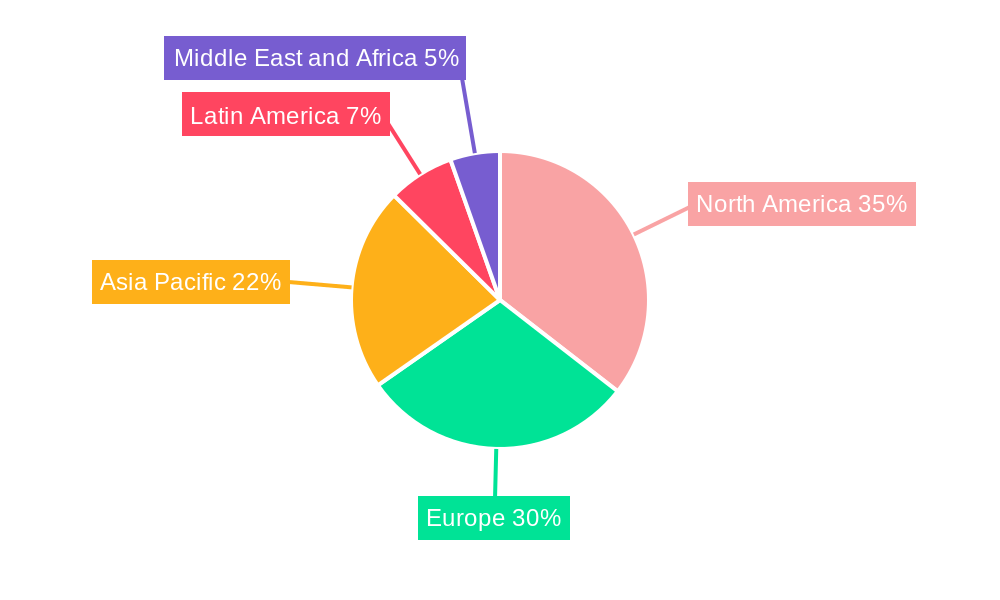
eGRC Industry Regional Market Share
Geographic Coverage of eGRC Industry
eGRC Industry REPORT HIGHLIGHTS
| Aspects | Details |
|---|---|
| Study Period | 2020-2034 |
| Base Year | 2025 |
| Estimated Year | 2026 |
| Forecast Period | 2026-2034 |
| Historical Period | 2020-2025 |
| Growth Rate | CAGR of 12.38% from 2020-2034 |
| Segmentation |
|
Table of Contents
- 1. Introduction
- 1.1. Research Scope
- 1.2. Market Segmentation
- 1.3. Research Methodology
- 1.4. Definitions and Assumptions
- 2. Executive Summary
- 2.1. Introduction
- 3. Market Dynamics
- 3.1. Introduction
- 3.2. Market Drivers
- 3.2.1. Stringent Government Regulations and Mandates; Cyber Security Threat Owing to Digitalization
- 3.3. Market Restrains
- 3.3.1. Lack of Awareness
- 3.4. Market Trends
- 3.4.1. Demand from BFSI segment is expected to Witness Significant Growth
- 4. Market Factor Analysis
- 4.1. Porters Five Forces
- 4.2. Supply/Value Chain
- 4.3. PESTEL analysis
- 4.4. Market Entropy
- 4.5. Patent/Trademark Analysis
- 5. Global eGRC Industry Analysis, Insights and Forecast, 2020-2032
- 5.1. Market Analysis, Insights and Forecast - by Type
- 5.1.1. Software
- 5.1.2. Services
- 5.2. Market Analysis, Insights and Forecast - by Size of the Enterprise
- 5.2.1. Small and Medium Enterprise
- 5.2.2. Large Enterprise
- 5.3. Market Analysis, Insights and Forecast - by End-User Industry
- 5.3.1. BFSI
- 5.3.2. Healthcare
- 5.3.3. Manufacturing
- 5.3.4. IT and Telecom
- 5.3.5. Other End-User Vertical
- 5.4. Market Analysis, Insights and Forecast - by Region
- 5.4.1. North America
- 5.4.2. Europe
- 5.4.3. Asia Pacific
- 5.4.4. Latin America
- 5.4.5. Middle East and Africa
- 5.1. Market Analysis, Insights and Forecast - by Type
- 6. North America eGRC Industry Analysis, Insights and Forecast, 2020-2032
- 6.1. Market Analysis, Insights and Forecast - by Type
- 6.1.1. Software
- 6.1.2. Services
- 6.2. Market Analysis, Insights and Forecast - by Size of the Enterprise
- 6.2.1. Small and Medium Enterprise
- 6.2.2. Large Enterprise
- 6.3. Market Analysis, Insights and Forecast - by End-User Industry
- 6.3.1. BFSI
- 6.3.2. Healthcare
- 6.3.3. Manufacturing
- 6.3.4. IT and Telecom
- 6.3.5. Other End-User Vertical
- 6.1. Market Analysis, Insights and Forecast - by Type
- 7. Europe eGRC Industry Analysis, Insights and Forecast, 2020-2032
- 7.1. Market Analysis, Insights and Forecast - by Type
- 7.1.1. Software
- 7.1.2. Services
- 7.2. Market Analysis, Insights and Forecast - by Size of the Enterprise
- 7.2.1. Small and Medium Enterprise
- 7.2.2. Large Enterprise
- 7.3. Market Analysis, Insights and Forecast - by End-User Industry
- 7.3.1. BFSI
- 7.3.2. Healthcare
- 7.3.3. Manufacturing
- 7.3.4. IT and Telecom
- 7.3.5. Other End-User Vertical
- 7.1. Market Analysis, Insights and Forecast - by Type
- 8. Asia Pacific eGRC Industry Analysis, Insights and Forecast, 2020-2032
- 8.1. Market Analysis, Insights and Forecast - by Type
- 8.1.1. Software
- 8.1.2. Services
- 8.2. Market Analysis, Insights and Forecast - by Size of the Enterprise
- 8.2.1. Small and Medium Enterprise
- 8.2.2. Large Enterprise
- 8.3. Market Analysis, Insights and Forecast - by End-User Industry
- 8.3.1. BFSI
- 8.3.2. Healthcare
- 8.3.3. Manufacturing
- 8.3.4. IT and Telecom
- 8.3.5. Other End-User Vertical
- 8.1. Market Analysis, Insights and Forecast - by Type
- 9. Latin America eGRC Industry Analysis, Insights and Forecast, 2020-2032
- 9.1. Market Analysis, Insights and Forecast - by Type
- 9.1.1. Software
- 9.1.2. Services
- 9.2. Market Analysis, Insights and Forecast - by Size of the Enterprise
- 9.2.1. Small and Medium Enterprise
- 9.2.2. Large Enterprise
- 9.3. Market Analysis, Insights and Forecast - by End-User Industry
- 9.3.1. BFSI
- 9.3.2. Healthcare
- 9.3.3. Manufacturing
- 9.3.4. IT and Telecom
- 9.3.5. Other End-User Vertical
- 9.1. Market Analysis, Insights and Forecast - by Type
- 10. Middle East and Africa eGRC Industry Analysis, Insights and Forecast, 2020-2032
- 10.1. Market Analysis, Insights and Forecast - by Type
- 10.1.1. Software
- 10.1.2. Services
- 10.2. Market Analysis, Insights and Forecast - by Size of the Enterprise
- 10.2.1. Small and Medium Enterprise
- 10.2.2. Large Enterprise
- 10.3. Market Analysis, Insights and Forecast - by End-User Industry
- 10.3.1. BFSI
- 10.3.2. Healthcare
- 10.3.3. Manufacturing
- 10.3.4. IT and Telecom
- 10.3.5. Other End-User Vertical
- 10.1. Market Analysis, Insights and Forecast - by Type
- 11. Competitive Analysis
- 11.1. Global Market Share Analysis 2025
- 11.2. Company Profiles
- 11.2.1 SAS Institute Inc
- 11.2.1.1. Overview
- 11.2.1.2. Products
- 11.2.1.3. SWOT Analysis
- 11.2.1.4. Recent Developments
- 11.2.1.5. Financials (Based on Availability)
- 11.2.2 Maclear LLC
- 11.2.2.1. Overview
- 11.2.2.2. Products
- 11.2.2.3. SWOT Analysis
- 11.2.2.4. Recent Developments
- 11.2.2.5. Financials (Based on Availability)
- 11.2.3 Software A
- 11.2.3.1. Overview
- 11.2.3.2. Products
- 11.2.3.3. SWOT Analysis
- 11.2.3.4. Recent Developments
- 11.2.3.5. Financials (Based on Availability)
- 11.2.4 IBM Corporation
- 11.2.4.1. Overview
- 11.2.4.2. Products
- 11.2.4.3. SWOT Analysis
- 11.2.4.4. Recent Developments
- 11.2.4.5. Financials (Based on Availability)
- 11.2.5 Dell EMC
- 11.2.5.1. Overview
- 11.2.5.2. Products
- 11.2.5.3. SWOT Analysis
- 11.2.5.4. Recent Developments
- 11.2.5.5. Financials (Based on Availability)
- 11.2.6 MetricStream Inc
- 11.2.6.1. Overview
- 11.2.6.2. Products
- 11.2.6.3. SWOT Analysis
- 11.2.6.4. Recent Developments
- 11.2.6.5. Financials (Based on Availability)
- 11.2.7 Wolters Kluwer
- 11.2.7.1. Overview
- 11.2.7.2. Products
- 11.2.7.3. SWOT Analysis
- 11.2.7.4. Recent Developments
- 11.2.7.5. Financials (Based on Availability)
- 11.2.8 Oracle Corporation
- 11.2.8.1. Overview
- 11.2.8.2. Products
- 11.2.8.3. SWOT Analysis
- 11.2.8.4. Recent Developments
- 11.2.8.5. Financials (Based on Availability)
- 11.2.9 Future Shield Inc
- 11.2.9.1. Overview
- 11.2.9.2. Products
- 11.2.9.3. SWOT Analysis
- 11.2.9.4. Recent Developments
- 11.2.9.5. Financials (Based on Availability)
- 11.2.10 SAP SE
- 11.2.10.1. Overview
- 11.2.10.2. Products
- 11.2.10.3. SWOT Analysis
- 11.2.10.4. Recent Developments
- 11.2.10.5. Financials (Based on Availability)
- 11.2.1 SAS Institute Inc
List of Figures
- Figure 1: Global eGRC Industry Revenue Breakdown (Million, %) by Region 2025 & 2033
- Figure 2: North America eGRC Industry Revenue (Million), by Type 2025 & 2033
- Figure 3: North America eGRC Industry Revenue Share (%), by Type 2025 & 2033
- Figure 4: North America eGRC Industry Revenue (Million), by Size of the Enterprise 2025 & 2033
- Figure 5: North America eGRC Industry Revenue Share (%), by Size of the Enterprise 2025 & 2033
- Figure 6: North America eGRC Industry Revenue (Million), by End-User Industry 2025 & 2033
- Figure 7: North America eGRC Industry Revenue Share (%), by End-User Industry 2025 & 2033
- Figure 8: North America eGRC Industry Revenue (Million), by Country 2025 & 2033
- Figure 9: North America eGRC Industry Revenue Share (%), by Country 2025 & 2033
- Figure 10: Europe eGRC Industry Revenue (Million), by Type 2025 & 2033
- Figure 11: Europe eGRC Industry Revenue Share (%), by Type 2025 & 2033
- Figure 12: Europe eGRC Industry Revenue (Million), by Size of the Enterprise 2025 & 2033
- Figure 13: Europe eGRC Industry Revenue Share (%), by Size of the Enterprise 2025 & 2033
- Figure 14: Europe eGRC Industry Revenue (Million), by End-User Industry 2025 & 2033
- Figure 15: Europe eGRC Industry Revenue Share (%), by End-User Industry 2025 & 2033
- Figure 16: Europe eGRC Industry Revenue (Million), by Country 2025 & 2033
- Figure 17: Europe eGRC Industry Revenue Share (%), by Country 2025 & 2033
- Figure 18: Asia Pacific eGRC Industry Revenue (Million), by Type 2025 & 2033
- Figure 19: Asia Pacific eGRC Industry Revenue Share (%), by Type 2025 & 2033
- Figure 20: Asia Pacific eGRC Industry Revenue (Million), by Size of the Enterprise 2025 & 2033
- Figure 21: Asia Pacific eGRC Industry Revenue Share (%), by Size of the Enterprise 2025 & 2033
- Figure 22: Asia Pacific eGRC Industry Revenue (Million), by End-User Industry 2025 & 2033
- Figure 23: Asia Pacific eGRC Industry Revenue Share (%), by End-User Industry 2025 & 2033
- Figure 24: Asia Pacific eGRC Industry Revenue (Million), by Country 2025 & 2033
- Figure 25: Asia Pacific eGRC Industry Revenue Share (%), by Country 2025 & 2033
- Figure 26: Latin America eGRC Industry Revenue (Million), by Type 2025 & 2033
- Figure 27: Latin America eGRC Industry Revenue Share (%), by Type 2025 & 2033
- Figure 28: Latin America eGRC Industry Revenue (Million), by Size of the Enterprise 2025 & 2033
- Figure 29: Latin America eGRC Industry Revenue Share (%), by Size of the Enterprise 2025 & 2033
- Figure 30: Latin America eGRC Industry Revenue (Million), by End-User Industry 2025 & 2033
- Figure 31: Latin America eGRC Industry Revenue Share (%), by End-User Industry 2025 & 2033
- Figure 32: Latin America eGRC Industry Revenue (Million), by Country 2025 & 2033
- Figure 33: Latin America eGRC Industry Revenue Share (%), by Country 2025 & 2033
- Figure 34: Middle East and Africa eGRC Industry Revenue (Million), by Type 2025 & 2033
- Figure 35: Middle East and Africa eGRC Industry Revenue Share (%), by Type 2025 & 2033
- Figure 36: Middle East and Africa eGRC Industry Revenue (Million), by Size of the Enterprise 2025 & 2033
- Figure 37: Middle East and Africa eGRC Industry Revenue Share (%), by Size of the Enterprise 2025 & 2033
- Figure 38: Middle East and Africa eGRC Industry Revenue (Million), by End-User Industry 2025 & 2033
- Figure 39: Middle East and Africa eGRC Industry Revenue Share (%), by End-User Industry 2025 & 2033
- Figure 40: Middle East and Africa eGRC Industry Revenue (Million), by Country 2025 & 2033
- Figure 41: Middle East and Africa eGRC Industry Revenue Share (%), by Country 2025 & 2033
List of Tables
- Table 1: Global eGRC Industry Revenue Million Forecast, by Type 2020 & 2033
- Table 2: Global eGRC Industry Revenue Million Forecast, by Size of the Enterprise 2020 & 2033
- Table 3: Global eGRC Industry Revenue Million Forecast, by End-User Industry 2020 & 2033
- Table 4: Global eGRC Industry Revenue Million Forecast, by Region 2020 & 2033
- Table 5: Global eGRC Industry Revenue Million Forecast, by Type 2020 & 2033
- Table 6: Global eGRC Industry Revenue Million Forecast, by Size of the Enterprise 2020 & 2033
- Table 7: Global eGRC Industry Revenue Million Forecast, by End-User Industry 2020 & 2033
- Table 8: Global eGRC Industry Revenue Million Forecast, by Country 2020 & 2033
- Table 9: Global eGRC Industry Revenue Million Forecast, by Type 2020 & 2033
- Table 10: Global eGRC Industry Revenue Million Forecast, by Size of the Enterprise 2020 & 2033
- Table 11: Global eGRC Industry Revenue Million Forecast, by End-User Industry 2020 & 2033
- Table 12: Global eGRC Industry Revenue Million Forecast, by Country 2020 & 2033
- Table 13: Global eGRC Industry Revenue Million Forecast, by Type 2020 & 2033
- Table 14: Global eGRC Industry Revenue Million Forecast, by Size of the Enterprise 2020 & 2033
- Table 15: Global eGRC Industry Revenue Million Forecast, by End-User Industry 2020 & 2033
- Table 16: Global eGRC Industry Revenue Million Forecast, by Country 2020 & 2033
- Table 17: Global eGRC Industry Revenue Million Forecast, by Type 2020 & 2033
- Table 18: Global eGRC Industry Revenue Million Forecast, by Size of the Enterprise 2020 & 2033
- Table 19: Global eGRC Industry Revenue Million Forecast, by End-User Industry 2020 & 2033
- Table 20: Global eGRC Industry Revenue Million Forecast, by Country 2020 & 2033
- Table 21: Global eGRC Industry Revenue Million Forecast, by Type 2020 & 2033
- Table 22: Global eGRC Industry Revenue Million Forecast, by Size of the Enterprise 2020 & 2033
- Table 23: Global eGRC Industry Revenue Million Forecast, by End-User Industry 2020 & 2033
- Table 24: Global eGRC Industry Revenue Million Forecast, by Country 2020 & 2033
Frequently Asked Questions
1. What is the projected Compound Annual Growth Rate (CAGR) of the eGRC Industry?
The projected CAGR is approximately 12.38%.
2. Which companies are prominent players in the eGRC Industry?
Key companies in the market include SAS Institute Inc, Maclear LLC, Software A, IBM Corporation, Dell EMC, MetricStream Inc, Wolters Kluwer, Oracle Corporation, Future Shield Inc, SAP SE.
3. What are the main segments of the eGRC Industry?
The market segments include Type, Size of the Enterprise, End-User Industry.
4. Can you provide details about the market size?
The market size is estimated to be USD 18.72 Million as of 2022.
5. What are some drivers contributing to market growth?
Stringent Government Regulations and Mandates; Cyber Security Threat Owing to Digitalization.
6. What are the notable trends driving market growth?
Demand from BFSI segment is expected to Witness Significant Growth.
7. Are there any restraints impacting market growth?
Lack of Awareness.
8. Can you provide examples of recent developments in the market?
October 2023 - Pathlock, the provider of application governance, risk, and compliance (GRC), launched a new release of its Application Access Governance (AAG) product within the company's risk and compliance platform, Pathlock Cloud. It is mainly a risk and compliance management platform that automates the controls testing and enforcement for various business applications and enterprise resource planning (ERP). ThePathlock AAG also automates the broad majority of manual processes needed to minimize the risks associated with application access throughout critical business systems.
9. What pricing options are available for accessing the report?
Pricing options include single-user, multi-user, and enterprise licenses priced at USD 4750, USD 5250, and USD 8750 respectively.
10. Is the market size provided in terms of value or volume?
The market size is provided in terms of value, measured in Million.
11. Are there any specific market keywords associated with the report?
Yes, the market keyword associated with the report is "eGRC Industry," which aids in identifying and referencing the specific market segment covered.
12. How do I determine which pricing option suits my needs best?
The pricing options vary based on user requirements and access needs. Individual users may opt for single-user licenses, while businesses requiring broader access may choose multi-user or enterprise licenses for cost-effective access to the report.
13. Are there any additional resources or data provided in the eGRC Industry report?
While the report offers comprehensive insights, it's advisable to review the specific contents or supplementary materials provided to ascertain if additional resources or data are available.
14. How can I stay updated on further developments or reports in the eGRC Industry?
To stay informed about further developments, trends, and reports in the eGRC Industry, consider subscribing to industry newsletters, following relevant companies and organizations, or regularly checking reputable industry news sources and publications.
Methodology
Step 1 - Identification of Relevant Samples Size from Population Database


Step 2 - Approaches for Defining Global Market Size (Value, Volume* & Price*)

Note*: In applicable scenarios
Step 3 - Data Sources
Primary Research
- Web Analytics
- Survey Reports
- Research Institute
- Latest Research Reports
- Opinion Leaders
Secondary Research
- Annual Reports
- White Paper
- Latest Press Release
- Industry Association
- Paid Database
- Investor Presentations

Step 4 - Data Triangulation
Involves using different sources of information in order to increase the validity of a study
These sources are likely to be stakeholders in a program - participants, other researchers, program staff, other community members, and so on.
Then we put all data in single framework & apply various statistical tools to find out the dynamic on the market.
During the analysis stage, feedback from the stakeholder groups would be compared to determine areas of agreement as well as areas of divergence

