

Key Insights
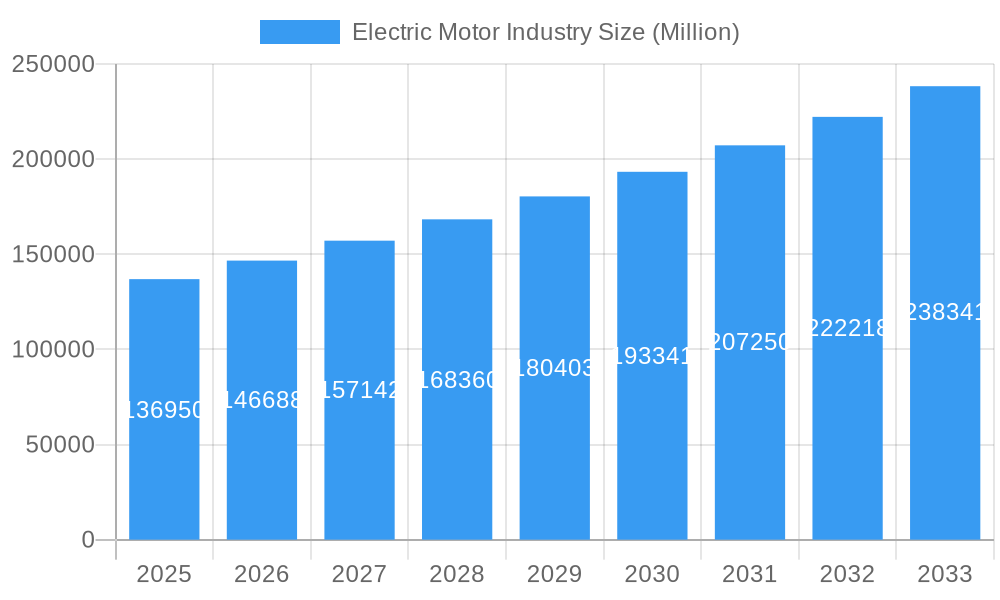
The global electric motor market, valued at $136.95 billion in 2025, is experiencing robust growth, projected to expand at a Compound Annual Growth Rate (CAGR) of 6.97% from 2025 to 2033. This growth is fueled by several key drivers. The increasing adoption of electric vehicles (EVs) across the globe significantly boosts demand for high-efficiency electric motors. Furthermore, the expanding industrial automation sector, particularly in manufacturing and logistics, necessitates a larger number of electric motors for robotic systems and automated machinery. Government regulations promoting energy efficiency and reducing carbon emissions are also driving market expansion, incentivizing the adoption of more energy-efficient electric motor technologies. The shift towards renewable energy sources, such as wind and solar power, further increases demand for reliable and durable electric motors in power generation and distribution. Market segmentation reveals significant opportunities in the AC motor type, driven by its cost-effectiveness and wide applicability across various voltage ranges and applications. The industrial and automotive sectors are key application areas showing high growth potential.
Electric Motor Industry Market Size (In Billion)
Significant regional variations exist within the market. North America and Europe, while mature markets, continue to show steady growth driven by technological advancements and stringent environmental regulations. However, the Asia-Pacific region, particularly China and India, exhibits the most significant growth potential due to rapid industrialization, urbanization, and a burgeoning automotive industry. While challenges exist, such as the high initial cost of premium, high-efficiency motors and the need for improved energy infrastructure in some developing regions, the overall market outlook remains positive. Continued technological innovation, focusing on increased efficiency, reduced size, and improved durability, will further propel market expansion over the forecast period. The competitive landscape is characterized by both established players and emerging companies, leading to continuous innovation and price competition which benefits consumers and drives further adoption.
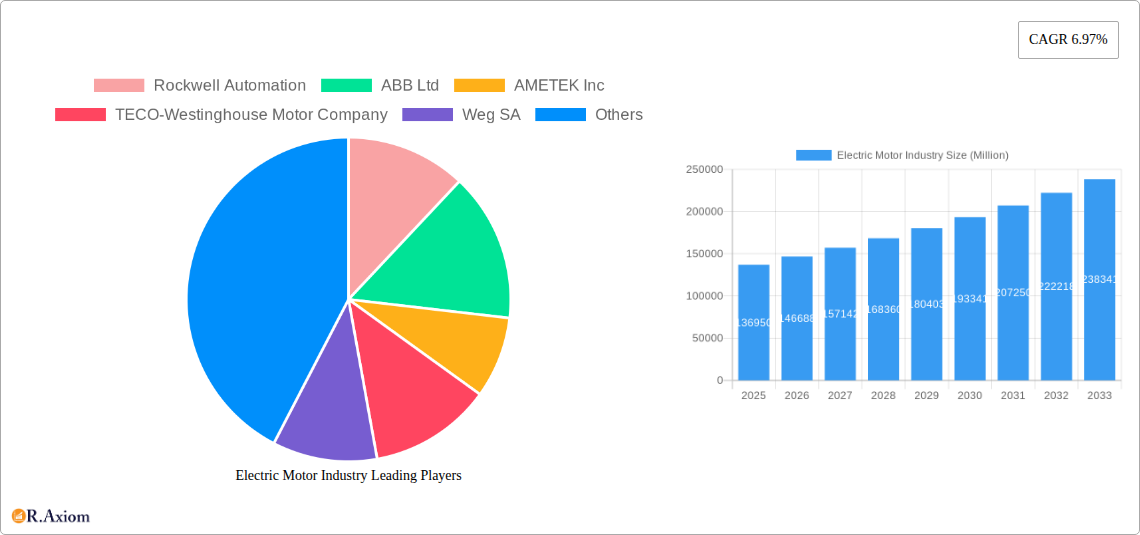
Electric Motor Industry Company Market Share
Electric Motor Industry: A Comprehensive Market Report (2019-2033)
This comprehensive report provides an in-depth analysis of the global electric motor industry, covering market size, segmentation, growth drivers, challenges, and key players. The study period spans from 2019 to 2033, with 2025 serving as the base and estimated year. The forecast period is 2025-2033, and the historical period encompasses 2019-2024. This report is invaluable for industry stakeholders, investors, and anyone seeking a detailed understanding of this dynamic market.
Electric Motor Industry Market Concentration & Innovation
The electric motor industry is characterized by a moderately concentrated market with a few dominant players holding significant market share. Rockwell Automation, ABB Ltd, and Siemens AG consistently rank among the top players globally, commanding a combined market share of approximately xx%. However, the market also features several regional and specialized players, leading to a competitive landscape. Innovation is a key driver, with companies investing heavily in research and development of energy-efficient, high-performance motors. This is fueled by stringent environmental regulations promoting energy efficiency and the growing demand for electric vehicles. The increasing adoption of Industry 4.0 technologies also plays a critical role, driving the need for smart motors with advanced control systems and data analytics capabilities.
Product substitution, primarily from alternative power sources like hydraulics and pneumatics in certain applications, poses a limited threat. However, the overall trend is towards electrification, which favors electric motors. The automotive industry's shift towards electric vehicles is a major end-user trend significantly impacting market growth. Recent mergers and acquisitions (M&A) activity, while not reaching record levels, illustrates ongoing consolidation within the industry. Notable M&A deals in the last five years involved transactions with values totaling approximately USD xx Million, further shaping the competitive landscape.
- Market Concentration: High (xx% controlled by top 3 players)
- Innovation Drivers: Energy efficiency regulations, EV adoption, Industry 4.0
- M&A Activity: USD xx Million in deals over the last five years.
Electric Motor Industry Industry Trends & Insights
The electric motor industry is experiencing robust growth, driven by the surging demand from the automotive, industrial, and renewable energy sectors. The global market is projected to witness a CAGR of xx% during the forecast period (2025-2033), reaching a market value of USD xx Million by 2033. This growth is fueled by several factors, including increasing industrial automation, the rising adoption of electric vehicles, and the expansion of renewable energy infrastructure. Technological disruptions, such as the development of high-efficiency permanent magnet motors and advanced control technologies, are also contributing to this growth. Consumer preferences are shifting towards energy-efficient and reliable products, which is driving innovation and increasing the market for premium electric motors. Competitive dynamics are intense, with companies focusing on product differentiation, technological advancements, and strategic partnerships to gain a competitive edge. The market penetration of high-efficiency motors is steadily increasing, driven by government incentives and stricter energy efficiency standards.
Dominant Markets & Segments in Electric Motor Industry
The industrial segment currently dominates the electric motor market, driven by strong demand from manufacturing, process industries, and infrastructure development. Within motor types, AC motors hold a significant market share due to their cost-effectiveness and wide applicability. The “Less than 1 kV” voltage segment dominates the market due to the vast number of low-power applications. Geographically, Asia-Pacific is the leading region due to rapid industrialization, a large automotive market and supportive government policies.
- Leading Region: Asia-Pacific (High industrial growth, EV adoption, large manufacturing base)
- Leading Motor Type: AC Motors (Cost-effectiveness, wide applicability)
- Leading Voltage Segment: Less than 1 kV (High demand from low-power applications)
- Leading Application Segment: Industrial (High demand from manufacturing and infrastructure)
Dominance Analysis: The dominance of Asia-Pacific stems from the robust growth of manufacturing, construction, and the automotive industry. The preference for AC motors is due to their mature technology, reliability, and affordability. The high penetration of low voltage motors reflects the vast demand for small to medium power applications across all segments. The industrial sector’s leading role highlights the extensive use of electric motors in various industrial processes and automation systems.
Electric Motor Industry Product Developments
Recent product innovations focus on improving energy efficiency, enhancing power density, and incorporating smart features like predictive maintenance capabilities. The development of permanent magnet motors and highly efficient brushless DC motors caters to the growing demand for energy savings and optimized performance. The integration of sensors, connectivity, and advanced control systems is enhancing the functionality and longevity of electric motors. These developments cater to the market's increasing preference for high-performance, reliable, and energy-efficient motors across various applications, particularly in the electric vehicle sector.
Report Scope & Segmentation Analysis
This report segments the electric motor market based on motor type (AC, DC), voltage (Less than 1 kV, Between 1 kV-6 kV, Higher than 6 kV), and application (Residential, Commercial, Automotive, Industrial). Growth projections vary across segments, with the automotive and industrial sectors exhibiting the highest growth rates due to the adoption of electric vehicles and industrial automation. Market size estimations are provided for each segment, along with a competitive analysis identifying key players in each sub-segment. The analysis considers the unique dynamics and challenges within each segment, such as the need for high power density in automotive applications and the focus on energy efficiency in industrial settings.
Key Drivers of Electric Motor Industry Growth
The electric motor industry's growth is propelled by several key factors: increasing automation across various industries, the booming electric vehicle (EV) market, renewable energy integration demands, and stringent government regulations promoting energy efficiency. Technological advancements resulting in more efficient and powerful motors, as well as falling raw material costs, also contribute to this growth. The widespread adoption of smart grids and the development of smart motor technologies are further fueling market expansion.
Challenges in the Electric Motor Industry Sector
The industry faces challenges like supply chain disruptions affecting raw material availability and escalating costs. Fluctuating commodity prices for essential materials like rare earth magnets significantly impact profitability. Furthermore, stringent environmental regulations and growing emphasis on sustainable manufacturing practices increase operational costs. Intense competition from established and emerging players also poses a significant challenge. These factors can potentially restrain market growth if not addressed effectively. The quantifiable impact of these challenges is an estimated xx% reduction in market growth for the period of xx.
Emerging Opportunities in Electric Motor Industry
Emerging opportunities lie in the expanding EV market, the increasing demand for energy-efficient motors in industrial applications, and the development of smart motors with advanced control systems. The growing popularity of renewable energy sources is creating new avenues for electric motors, particularly in wind and solar power generation. The integration of artificial intelligence (AI) and machine learning (ML) in motor design and control presents a significant opportunity for innovation. Lastly, the exploration of new materials and technologies to enhance efficiency and reduce reliance on rare-earth elements offers lucrative prospects.
Leading Players in the Electric Motor Industry Market
- Rockwell Automation
- ABB Ltd
- AMETEK Inc
- TECO-Westinghouse Motor Company
- Weg SA
- Toshiba Corp
- Nidec Corporation
- Johnson Electric Holdings Limited
- Siemens AG
- Hitachi Ltd
- Robert Bosch GmbH
- Regal Rexnord Corporation
Key Developments in Electric Motor Industry Industry
- November 2022: Nidec Corporation announced a USD 715 Million investment in Mexico to manufacture electric motors and e-axle drives for electric vehicles, with an anticipated annual production capacity of 1 Million units. This significantly boosts their EV motor production capacity and strengthens their position in the rapidly growing EV market.
- February 2023: Flash, an electronic component maker, partnered with Slovenia-based GEM motors to develop electric motors for various electric vehicle segments (1 kW to 15 kW). This collaboration expands the availability of hub motors for electric vehicles.
Strategic Outlook for Electric Motor Industry Market
The electric motor industry is poised for sustained growth, driven by the continued adoption of electric vehicles, the expansion of industrial automation, and the growth of renewable energy sectors. Opportunities abound in developing high-efficiency motors, integrating advanced control systems, and exploring new materials. Companies focusing on innovation, sustainability, and strategic partnerships are well-positioned to capitalize on the significant market potential. The future outlook remains positive, with steady growth expected throughout the forecast period, particularly in emerging economies.
Electric Motor Industry Segmentation
-
1. Motor Type
- 1.1. AC
- 1.2. DC
-
2. Voltage
- 2.1. Less than 1 kV
- 2.2. Between 1kV-6kV
- 2.3. Higher than 6 kV
-
3. Application
- 3.1. Residential
- 3.2. Commercial
- 3.3. Automotive
- 3.4. Industrial
Electric Motor Industry Segmentation By Geography
-
1. North America
- 1.1. United States
- 1.2. Canada
- 1.3. Rest of North America
-
2. Europe
- 2.1. Germany
- 2.2. France
- 2.3. United Kingdom
- 2.4. Rest of Europe
-
3. Asia Pacific
- 3.1. China
- 3.2. India
- 3.3. Japan
- 3.4. South Korea
- 3.5. Rest of Asia Pacific
-
4. South America
- 4.1. Brazil
- 4.2. Argentina
- 4.3. Rest of South America
-
5. Middle East and Africa
- 5.1. Saudi Arabia
- 5.2. United Arab Emirates
- 5.3. South Africa
- 5.4. Rest of Middle East and Africa
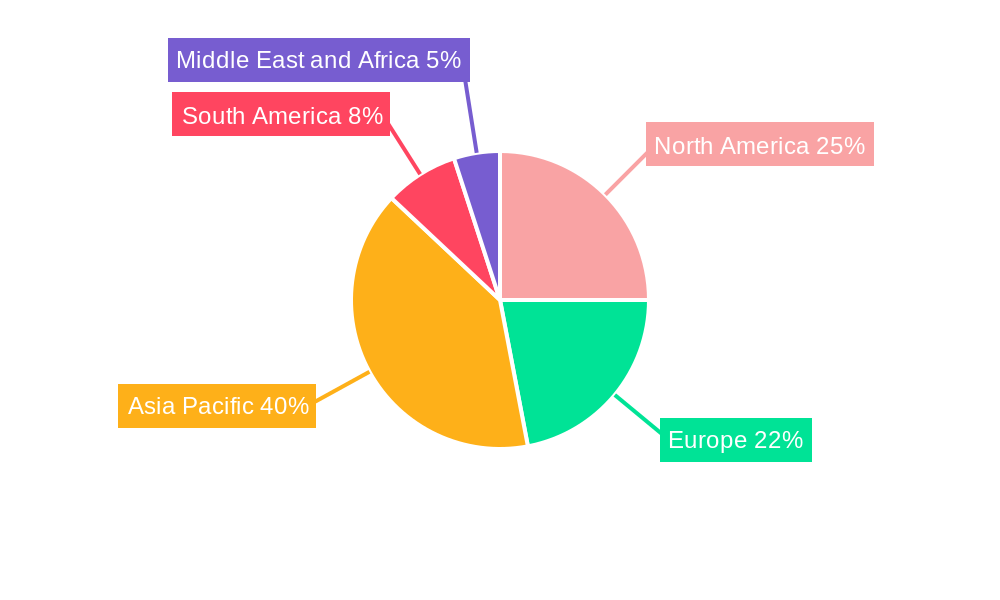
Electric Motor Industry Regional Market Share
Geographic Coverage of Electric Motor Industry
Electric Motor Industry REPORT HIGHLIGHTS
| Aspects | Details |
|---|---|
| Study Period | 2020-2034 |
| Base Year | 2025 |
| Estimated Year | 2026 |
| Forecast Period | 2026-2034 |
| Historical Period | 2020-2025 |
| Growth Rate | CAGR of 6.97% from 2020-2034 |
| Segmentation |
|
Table of Contents
- 1. Introduction
- 1.1. Research Scope
- 1.2. Market Segmentation
- 1.3. Research Objective
- 1.4. Definitions and Assumptions
- 2. Executive Summary
- 2.1. Market Snapshot
- 3. Market Dynamics
- 3.1. Market Drivers
- 3.2. Market Restrains
- 3.3. Market Trends
- 3.4. Market Opportunities
- 4. Market Factor Analysis
- 4.1. Porters Five Forces
- 4.1.1. Bargaining Power of Suppliers
- 4.1.2. Bargaining Power of Buyers
- 4.1.3. Threat of New Entrants
- 4.1.4. Threat of Substitutes
- 4.1.5. Competitive Rivalry
- 4.2. PESTEL analysis
- 4.3. BCG Analysis
- 4.3.1. Stars (High Growth, High Market Share)
- 4.3.2. Cash Cows (Low Growth, High Market Share)
- 4.3.3. Question Mark (High Growth, Low Market Share)
- 4.3.4. Dogs (Low Growth, Low Market Share)
- 4.4. Ansoff Matrix Analysis
- 4.5. Supply Chain Analysis
- 4.6. Regulatory Landscape
- 4.7. Current Market Potential and Opportunity Assessment (TAM–SAM–SOM Framework)
- 4.8. RAX Analyst Note
- 4.1. Porters Five Forces
- 5. Market Analysis, Insights and Forecast 2021-2033
- 5.1. Market Analysis, Insights and Forecast - by Motor Type
- 5.1.1. AC
- 5.1.2. DC
- 5.2. Market Analysis, Insights and Forecast - by Voltage
- 5.2.1. Less than 1 kV
- 5.2.2. Between 1kV-6kV
- 5.2.3. Higher than 6 kV
- 5.3. Market Analysis, Insights and Forecast - by Application
- 5.3.1. Residential
- 5.3.2. Commercial
- 5.3.3. Automotive
- 5.3.4. Industrial
- 5.4. Market Analysis, Insights and Forecast - by Region
- 5.4.1. North America
- 5.4.2. Europe
- 5.4.3. Asia Pacific
- 5.4.4. South America
- 5.4.5. Middle East and Africa
- 5.1. Market Analysis, Insights and Forecast - by Motor Type
- 6. Global Electric Motor Industry Analysis, Insights and Forecast, 2021-2033
- 6.1. Market Analysis, Insights and Forecast - by Motor Type
- 6.1.1. AC
- 6.1.2. DC
- 6.2. Market Analysis, Insights and Forecast - by Voltage
- 6.2.1. Less than 1 kV
- 6.2.2. Between 1kV-6kV
- 6.2.3. Higher than 6 kV
- 6.3. Market Analysis, Insights and Forecast - by Application
- 6.3.1. Residential
- 6.3.2. Commercial
- 6.3.3. Automotive
- 6.3.4. Industrial
- 6.1. Market Analysis, Insights and Forecast - by Motor Type
- 7. North America Electric Motor Industry Analysis, Insights and Forecast, 2020-2032
- 7.1. Market Analysis, Insights and Forecast - by Motor Type
- 7.1.1. AC
- 7.1.2. DC
- 7.2. Market Analysis, Insights and Forecast - by Voltage
- 7.2.1. Less than 1 kV
- 7.2.2. Between 1kV-6kV
- 7.2.3. Higher than 6 kV
- 7.3. Market Analysis, Insights and Forecast - by Application
- 7.3.1. Residential
- 7.3.2. Commercial
- 7.3.3. Automotive
- 7.3.4. Industrial
- 7.1. Market Analysis, Insights and Forecast - by Motor Type
- 8. Europe Electric Motor Industry Analysis, Insights and Forecast, 2020-2032
- 8.1. Market Analysis, Insights and Forecast - by Motor Type
- 8.1.1. AC
- 8.1.2. DC
- 8.2. Market Analysis, Insights and Forecast - by Voltage
- 8.2.1. Less than 1 kV
- 8.2.2. Between 1kV-6kV
- 8.2.3. Higher than 6 kV
- 8.3. Market Analysis, Insights and Forecast - by Application
- 8.3.1. Residential
- 8.3.2. Commercial
- 8.3.3. Automotive
- 8.3.4. Industrial
- 8.1. Market Analysis, Insights and Forecast - by Motor Type
- 9. Asia Pacific Electric Motor Industry Analysis, Insights and Forecast, 2020-2032
- 9.1. Market Analysis, Insights and Forecast - by Motor Type
- 9.1.1. AC
- 9.1.2. DC
- 9.2. Market Analysis, Insights and Forecast - by Voltage
- 9.2.1. Less than 1 kV
- 9.2.2. Between 1kV-6kV
- 9.2.3. Higher than 6 kV
- 9.3. Market Analysis, Insights and Forecast - by Application
- 9.3.1. Residential
- 9.3.2. Commercial
- 9.3.3. Automotive
- 9.3.4. Industrial
- 9.1. Market Analysis, Insights and Forecast - by Motor Type
- 10. South America Electric Motor Industry Analysis, Insights and Forecast, 2020-2032
- 10.1. Market Analysis, Insights and Forecast - by Motor Type
- 10.1.1. AC
- 10.1.2. DC
- 10.2. Market Analysis, Insights and Forecast - by Voltage
- 10.2.1. Less than 1 kV
- 10.2.2. Between 1kV-6kV
- 10.2.3. Higher than 6 kV
- 10.3. Market Analysis, Insights and Forecast - by Application
- 10.3.1. Residential
- 10.3.2. Commercial
- 10.3.3. Automotive
- 10.3.4. Industrial
- 10.1. Market Analysis, Insights and Forecast - by Motor Type
- 11. Middle East and Africa Electric Motor Industry Analysis, Insights and Forecast, 2020-2032
- 11.1. Market Analysis, Insights and Forecast - by Motor Type
- 11.1.1. AC
- 11.1.2. DC
- 11.2. Market Analysis, Insights and Forecast - by Voltage
- 11.2.1. Less than 1 kV
- 11.2.2. Between 1kV-6kV
- 11.2.3. Higher than 6 kV
- 11.3. Market Analysis, Insights and Forecast - by Application
- 11.3.1. Residential
- 11.3.2. Commercial
- 11.3.3. Automotive
- 11.3.4. Industrial
- 11.1. Market Analysis, Insights and Forecast - by Motor Type
- 12. Competitive Analysis
- 12.1. Company Profiles
- 12.1.1 Rockwell Automation
- 12.1.1.1. Company Overview
- 12.1.1.2. Products
- 12.1.1.3. Company Financials
- 12.1.1.4. SWOT Analysis
- 12.1.2 ABB Ltd
- 12.1.2.1. Company Overview
- 12.1.2.2. Products
- 12.1.2.3. Company Financials
- 12.1.2.4. SWOT Analysis
- 12.1.3 AMETEK Inc
- 12.1.3.1. Company Overview
- 12.1.3.2. Products
- 12.1.3.3. Company Financials
- 12.1.3.4. SWOT Analysis
- 12.1.4 TECO-Westinghouse Motor Company
- 12.1.4.1. Company Overview
- 12.1.4.2. Products
- 12.1.4.3. Company Financials
- 12.1.4.4. SWOT Analysis
- 12.1.5 Weg SA
- 12.1.5.1. Company Overview
- 12.1.5.2. Products
- 12.1.5.3. Company Financials
- 12.1.5.4. SWOT Analysis
- 12.1.6 Toshiba Corp
- 12.1.6.1. Company Overview
- 12.1.6.2. Products
- 12.1.6.3. Company Financials
- 12.1.6.4. SWOT Analysis
- 12.1.7 Nidec Corporation
- 12.1.7.1. Company Overview
- 12.1.7.2. Products
- 12.1.7.3. Company Financials
- 12.1.7.4. SWOT Analysis
- 12.1.8 Johnson Electric Holdings Limited
- 12.1.8.1. Company Overview
- 12.1.8.2. Products
- 12.1.8.3. Company Financials
- 12.1.8.4. SWOT Analysis
- 12.1.9 Siemens AG
- 12.1.9.1. Company Overview
- 12.1.9.2. Products
- 12.1.9.3. Company Financials
- 12.1.9.4. SWOT Analysis
- 12.1.10 Hitachi Ltd
- 12.1.10.1. Company Overview
- 12.1.10.2. Products
- 12.1.10.3. Company Financials
- 12.1.10.4. SWOT Analysis
- 12.1.11 Robert Bosch GmbH
- 12.1.11.1. Company Overview
- 12.1.11.2. Products
- 12.1.11.3. Company Financials
- 12.1.11.4. SWOT Analysis
- 12.1.12 Regal Rexnord Corporation
- 12.1.12.1. Company Overview
- 12.1.12.2. Products
- 12.1.12.3. Company Financials
- 12.1.12.4. SWOT Analysis
- 12.1.1 Rockwell Automation
- 12.2. Market Entropy
- 12.2.1 Company's Key Areas Served
- 12.2.2 Recent Developments
- 12.3. Company Market Share Analysis 2025
- 12.3.1 Top 5 Companies Market Share Analysis
- 12.3.2 Top 3 Companies Market Share Analysis
- 12.4. List of Potential Customers
- 13. Research Methodology
List of Figures
- Figure 1: Global Electric Motor Industry Revenue Breakdown (Million, %) by Region 2025 & 2033
- Figure 2: North America Electric Motor Industry Revenue (Million), by Motor Type 2025 & 2033
- Figure 3: North America Electric Motor Industry Revenue Share (%), by Motor Type 2025 & 2033
- Figure 4: North America Electric Motor Industry Revenue (Million), by Voltage 2025 & 2033
- Figure 5: North America Electric Motor Industry Revenue Share (%), by Voltage 2025 & 2033
- Figure 6: North America Electric Motor Industry Revenue (Million), by Application 2025 & 2033
- Figure 7: North America Electric Motor Industry Revenue Share (%), by Application 2025 & 2033
- Figure 8: North America Electric Motor Industry Revenue (Million), by Country 2025 & 2033
- Figure 9: North America Electric Motor Industry Revenue Share (%), by Country 2025 & 2033
- Figure 10: Europe Electric Motor Industry Revenue (Million), by Motor Type 2025 & 2033
- Figure 11: Europe Electric Motor Industry Revenue Share (%), by Motor Type 2025 & 2033
- Figure 12: Europe Electric Motor Industry Revenue (Million), by Voltage 2025 & 2033
- Figure 13: Europe Electric Motor Industry Revenue Share (%), by Voltage 2025 & 2033
- Figure 14: Europe Electric Motor Industry Revenue (Million), by Application 2025 & 2033
- Figure 15: Europe Electric Motor Industry Revenue Share (%), by Application 2025 & 2033
- Figure 16: Europe Electric Motor Industry Revenue (Million), by Country 2025 & 2033
- Figure 17: Europe Electric Motor Industry Revenue Share (%), by Country 2025 & 2033
- Figure 18: Asia Pacific Electric Motor Industry Revenue (Million), by Motor Type 2025 & 2033
- Figure 19: Asia Pacific Electric Motor Industry Revenue Share (%), by Motor Type 2025 & 2033
- Figure 20: Asia Pacific Electric Motor Industry Revenue (Million), by Voltage 2025 & 2033
- Figure 21: Asia Pacific Electric Motor Industry Revenue Share (%), by Voltage 2025 & 2033
- Figure 22: Asia Pacific Electric Motor Industry Revenue (Million), by Application 2025 & 2033
- Figure 23: Asia Pacific Electric Motor Industry Revenue Share (%), by Application 2025 & 2033
- Figure 24: Asia Pacific Electric Motor Industry Revenue (Million), by Country 2025 & 2033
- Figure 25: Asia Pacific Electric Motor Industry Revenue Share (%), by Country 2025 & 2033
- Figure 26: South America Electric Motor Industry Revenue (Million), by Motor Type 2025 & 2033
- Figure 27: South America Electric Motor Industry Revenue Share (%), by Motor Type 2025 & 2033
- Figure 28: South America Electric Motor Industry Revenue (Million), by Voltage 2025 & 2033
- Figure 29: South America Electric Motor Industry Revenue Share (%), by Voltage 2025 & 2033
- Figure 30: South America Electric Motor Industry Revenue (Million), by Application 2025 & 2033
- Figure 31: South America Electric Motor Industry Revenue Share (%), by Application 2025 & 2033
- Figure 32: South America Electric Motor Industry Revenue (Million), by Country 2025 & 2033
- Figure 33: South America Electric Motor Industry Revenue Share (%), by Country 2025 & 2033
- Figure 34: Middle East and Africa Electric Motor Industry Revenue (Million), by Motor Type 2025 & 2033
- Figure 35: Middle East and Africa Electric Motor Industry Revenue Share (%), by Motor Type 2025 & 2033
- Figure 36: Middle East and Africa Electric Motor Industry Revenue (Million), by Voltage 2025 & 2033
- Figure 37: Middle East and Africa Electric Motor Industry Revenue Share (%), by Voltage 2025 & 2033
- Figure 38: Middle East and Africa Electric Motor Industry Revenue (Million), by Application 2025 & 2033
- Figure 39: Middle East and Africa Electric Motor Industry Revenue Share (%), by Application 2025 & 2033
- Figure 40: Middle East and Africa Electric Motor Industry Revenue (Million), by Country 2025 & 2033
- Figure 41: Middle East and Africa Electric Motor Industry Revenue Share (%), by Country 2025 & 2033
List of Tables
- Table 1: Global Electric Motor Industry Revenue Million Forecast, by Motor Type 2020 & 2033
- Table 2: Global Electric Motor Industry Revenue Million Forecast, by Voltage 2020 & 2033
- Table 3: Global Electric Motor Industry Revenue Million Forecast, by Application 2020 & 2033
- Table 4: Global Electric Motor Industry Revenue Million Forecast, by Region 2020 & 2033
- Table 5: Global Electric Motor Industry Revenue Million Forecast, by Motor Type 2020 & 2033
- Table 6: Global Electric Motor Industry Revenue Million Forecast, by Voltage 2020 & 2033
- Table 7: Global Electric Motor Industry Revenue Million Forecast, by Application 2020 & 2033
- Table 8: Global Electric Motor Industry Revenue Million Forecast, by Country 2020 & 2033
- Table 9: United States Electric Motor Industry Revenue (Million) Forecast, by Application 2020 & 2033
- Table 10: Canada Electric Motor Industry Revenue (Million) Forecast, by Application 2020 & 2033
- Table 11: Rest of North America Electric Motor Industry Revenue (Million) Forecast, by Application 2020 & 2033
- Table 12: Global Electric Motor Industry Revenue Million Forecast, by Motor Type 2020 & 2033
- Table 13: Global Electric Motor Industry Revenue Million Forecast, by Voltage 2020 & 2033
- Table 14: Global Electric Motor Industry Revenue Million Forecast, by Application 2020 & 2033
- Table 15: Global Electric Motor Industry Revenue Million Forecast, by Country 2020 & 2033
- Table 16: Germany Electric Motor Industry Revenue (Million) Forecast, by Application 2020 & 2033
- Table 17: France Electric Motor Industry Revenue (Million) Forecast, by Application 2020 & 2033
- Table 18: United Kingdom Electric Motor Industry Revenue (Million) Forecast, by Application 2020 & 2033
- Table 19: Rest of Europe Electric Motor Industry Revenue (Million) Forecast, by Application 2020 & 2033
- Table 20: Global Electric Motor Industry Revenue Million Forecast, by Motor Type 2020 & 2033
- Table 21: Global Electric Motor Industry Revenue Million Forecast, by Voltage 2020 & 2033
- Table 22: Global Electric Motor Industry Revenue Million Forecast, by Application 2020 & 2033
- Table 23: Global Electric Motor Industry Revenue Million Forecast, by Country 2020 & 2033
- Table 24: China Electric Motor Industry Revenue (Million) Forecast, by Application 2020 & 2033
- Table 25: India Electric Motor Industry Revenue (Million) Forecast, by Application 2020 & 2033
- Table 26: Japan Electric Motor Industry Revenue (Million) Forecast, by Application 2020 & 2033
- Table 27: South Korea Electric Motor Industry Revenue (Million) Forecast, by Application 2020 & 2033
- Table 28: Rest of Asia Pacific Electric Motor Industry Revenue (Million) Forecast, by Application 2020 & 2033
- Table 29: Global Electric Motor Industry Revenue Million Forecast, by Motor Type 2020 & 2033
- Table 30: Global Electric Motor Industry Revenue Million Forecast, by Voltage 2020 & 2033
- Table 31: Global Electric Motor Industry Revenue Million Forecast, by Application 2020 & 2033
- Table 32: Global Electric Motor Industry Revenue Million Forecast, by Country 2020 & 2033
- Table 33: Brazil Electric Motor Industry Revenue (Million) Forecast, by Application 2020 & 2033
- Table 34: Argentina Electric Motor Industry Revenue (Million) Forecast, by Application 2020 & 2033
- Table 35: Rest of South America Electric Motor Industry Revenue (Million) Forecast, by Application 2020 & 2033
- Table 36: Global Electric Motor Industry Revenue Million Forecast, by Motor Type 2020 & 2033
- Table 37: Global Electric Motor Industry Revenue Million Forecast, by Voltage 2020 & 2033
- Table 38: Global Electric Motor Industry Revenue Million Forecast, by Application 2020 & 2033
- Table 39: Global Electric Motor Industry Revenue Million Forecast, by Country 2020 & 2033
- Table 40: Saudi Arabia Electric Motor Industry Revenue (Million) Forecast, by Application 2020 & 2033
- Table 41: United Arab Emirates Electric Motor Industry Revenue (Million) Forecast, by Application 2020 & 2033
- Table 42: South Africa Electric Motor Industry Revenue (Million) Forecast, by Application 2020 & 2033
- Table 43: Rest of Middle East and Africa Electric Motor Industry Revenue (Million) Forecast, by Application 2020 & 2033
Frequently Asked Questions
1. What is the projected Compound Annual Growth Rate (CAGR) of the Electric Motor Industry?
The projected CAGR is approximately 6.97%.
2. Which companies are prominent players in the Electric Motor Industry?
Key companies in the market include Rockwell Automation, ABB Ltd, AMETEK Inc, TECO-Westinghouse Motor Company, Weg SA, Toshiba Corp, Nidec Corporation, Johnson Electric Holdings Limited, Siemens AG, Hitachi Ltd, Robert Bosch GmbH, Regal Rexnord Corporation.
3. What are the main segments of the Electric Motor Industry?
The market segments include Motor Type, Voltage, Application.
4. Can you provide details about the market size?
The market size is estimated to be USD 136.95 Million as of 2022.
5. What are some drivers contributing to market growth?
4Increasing Residential Usage of the Electric Motor. Rising Adoption of Electric Vehicles.
6. What are the notable trends driving market growth?
Automotive Segment to Witness Growth.
7. Are there any restraints impacting market growth?
Fluctuating Prices of Raw Materials.
8. Can you provide examples of recent developments in the market?
February 2023: Electronic component maker Flash announced a technical collaboration with Slovenia-based GEM motors to develop electric motors. Under the partnership, both brands will manufacture hub motors for various electric vehicle segments in the range of 1 kW to 15 kW.
9. What pricing options are available for accessing the report?
Pricing options include single-user, multi-user, and enterprise licenses priced at USD 4750, USD 5250, and USD 8750 respectively.
10. Is the market size provided in terms of value or volume?
The market size is provided in terms of value, measured in Million.
11. Are there any specific market keywords associated with the report?
Yes, the market keyword associated with the report is "Electric Motor Industry," which aids in identifying and referencing the specific market segment covered.
12. How do I determine which pricing option suits my needs best?
The pricing options vary based on user requirements and access needs. Individual users may opt for single-user licenses, while businesses requiring broader access may choose multi-user or enterprise licenses for cost-effective access to the report.
13. Are there any additional resources or data provided in the Electric Motor Industry report?
While the report offers comprehensive insights, it's advisable to review the specific contents or supplementary materials provided to ascertain if additional resources or data are available.
14. How can I stay updated on further developments or reports in the Electric Motor Industry?
To stay informed about further developments, trends, and reports in the Electric Motor Industry, consider subscribing to industry newsletters, following relevant companies and organizations, or regularly checking reputable industry news sources and publications.
Methodology
Step 1 - Identification of Relevant Samples Size from Population Database


Step 2 - Approaches for Defining Global Market Size (Value, Volume* & Price*)

Note*: In applicable scenarios
Step 3 - Data Sources
Primary Research
- Web Analytics
- Survey Reports
- Research Institute
- Latest Research Reports
- Opinion Leaders
Secondary Research
- Annual Reports
- White Paper
- Latest Press Release
- Industry Association
- Paid Database
- Investor Presentations

Step 4 - Data Triangulation
Involves using different sources of information in order to increase the validity of a study
These sources are likely to be stakeholders in a program - participants, other researchers, program staff, other community members, and so on.
Then we put all data in single framework & apply various statistical tools to find out the dynamic on the market.
During the analysis stage, feedback from the stakeholder groups would be compared to determine areas of agreement as well as areas of divergence