Key Insights
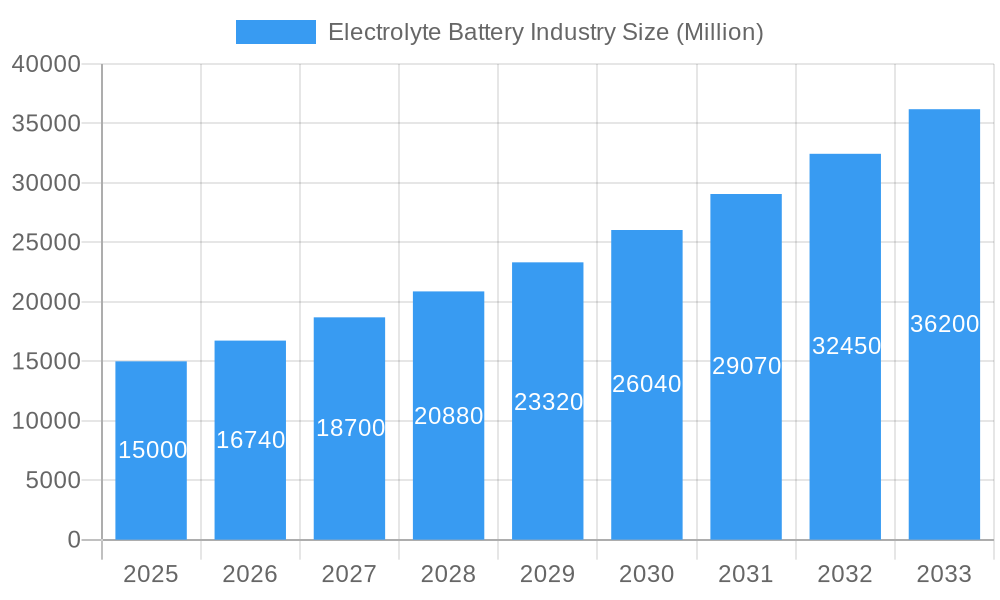
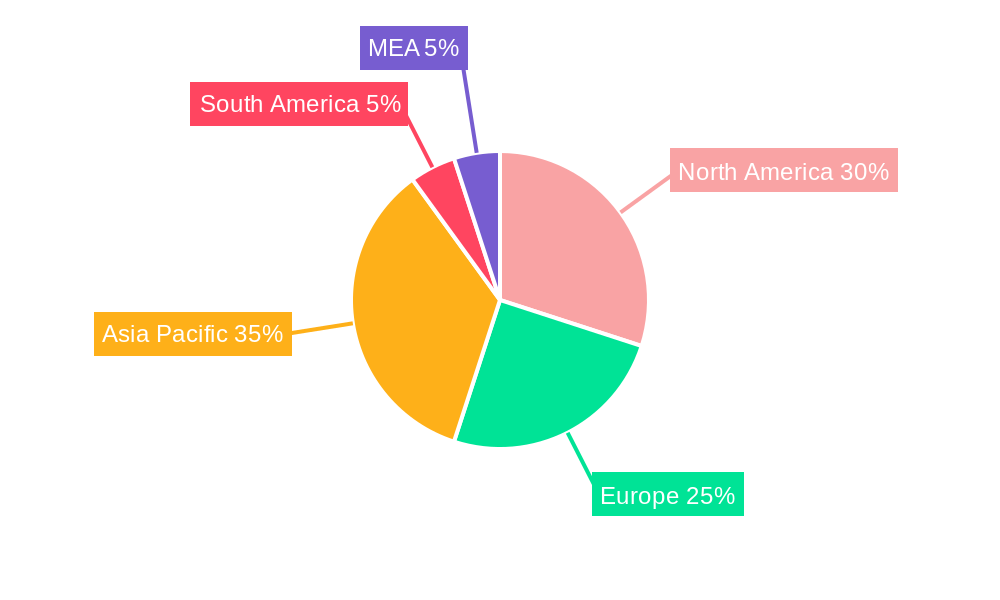
The global electrolyte battery market is experiencing robust growth, projected to reach a substantial size driven by the increasing demand for energy storage solutions and the proliferation of electric vehicles (EVs). The market's Compound Annual Growth Rate (CAGR) of 11.60% from 2019 to 2024 indicates a significant upward trajectory, a trend expected to continue through 2033. This expansion is fueled by several key factors: the rising adoption of renewable energy sources necessitating efficient energy storage, the global push towards electrification in transportation, and the growing demand for portable power in consumer electronics. Lithium-ion batteries, known for their high energy density, currently dominate the market, but advancements in flow battery and other electrolyte technologies are expected to drive diversification and innovation. Geographic growth is widespread, with North America and Asia-Pacific leading the charge due to strong government support for clean energy initiatives and the presence of major battery manufacturers. However, regulatory hurdles and the cost of raw materials represent significant challenges to continued expansion. The market segmentation by battery and electrolyte type (lead-acid, gel, lithium-ion, flow, zinc-bromide, etc.) reflects the diverse applications across various end-user sectors, each exhibiting its own growth trajectory.
Electrolyte Battery Industry Market Size (In Billion)
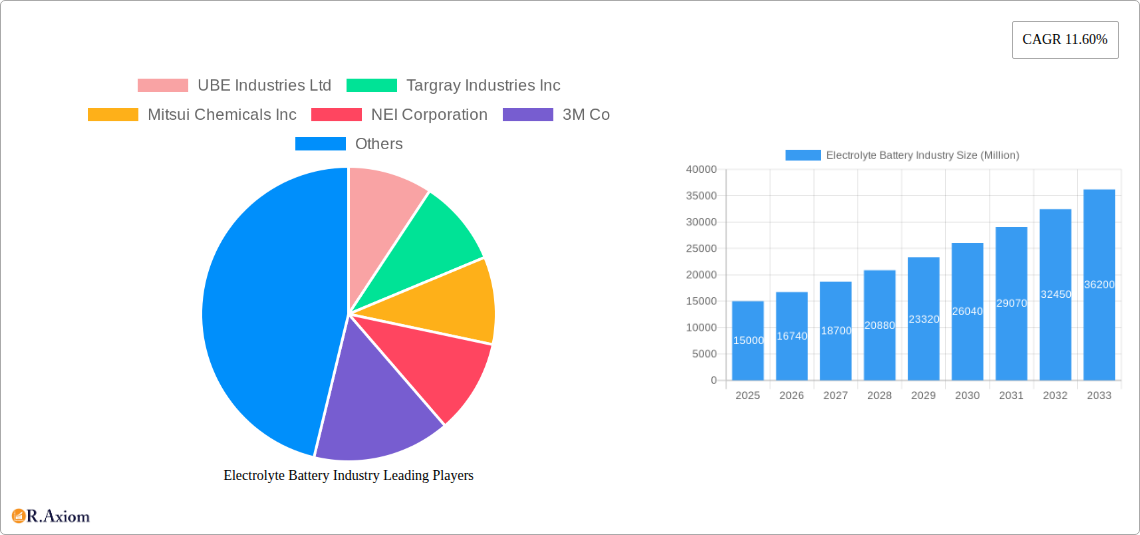
The competitive landscape includes both established chemical giants and specialized battery material suppliers. Companies like UBE Industries, Targray Industries, Mitsui Chemicals, and 3M are actively involved in research and development, seeking to improve battery performance, lifespan, and safety. The market is witnessing increased vertical integration, with some companies expanding their presence across the value chain from raw material sourcing to battery manufacturing. The continued growth will likely depend on collaborative efforts between material suppliers, battery manufacturers, and government agencies to address raw material sourcing, environmental concerns, and infrastructure development. Future projections suggest a steady increase in market size, driven by advancements in battery technologies, improved energy efficiency, and the increasing adoption of electric vehicles and renewable energy systems globally. Furthermore, a continued emphasis on sustainability and reducing the environmental impact of battery manufacturing will be crucial for long-term market success.
Electrolyte Battery Industry Company Market Share
Electrolyte Battery Industry: A Comprehensive Market Report (2019-2033)
This comprehensive report provides a detailed analysis of the global electrolyte battery industry, covering market size, growth drivers, challenges, and future opportunities from 2019 to 2033. The report incorporates extensive data and insights, focusing on key segments, leading players, and emerging trends. This in-depth analysis is crucial for businesses, investors, and stakeholders seeking to understand and navigate this dynamic market. The study period spans 2019-2033, with 2025 serving as both the base and estimated year. The forecast period covers 2025-2033, and the historical period encompasses 2019-2024.
Electrolyte Battery Industry Market Concentration & Innovation
This section analyzes the competitive landscape of the electrolyte battery industry, examining market concentration, innovation drivers, regulatory frameworks, product substitutes, end-user trends, and M&A activities. The global electrolyte battery market exhibits a moderately concentrated structure, with a handful of major players holding significant market share. For instance, the combined market share of UBE Industries Ltd, Mitsui Chemicals Inc, and Mitsubishi Chemical Holdings Corporation is estimated at xx%. Innovation is primarily driven by the demand for higher energy density, improved safety, and reduced costs, leading to continuous advancements in battery chemistries and manufacturing processes.
- Market Share: UBE Industries Ltd (xx%), Mitsui Chemicals Inc (xx%), Mitsubishi Chemical Holdings Corporation (xx%), others (xx%).
- M&A Activity: The industry has witnessed significant M&A activity in recent years, with deals valued at over xx Million USD in the last five years. These acquisitions have primarily focused on expanding product portfolios, securing raw material supplies, and enhancing technological capabilities. For example, the acquisition of [Company A] by [Company B] in [Year] resulted in [Impact on market share/technology].
- Regulatory Frameworks: Stringent environmental regulations and safety standards are influencing the adoption of specific electrolyte types and manufacturing processes. This has led to increased focus on sustainable and eco-friendly battery technologies.
- Product Substitutes: The market faces competition from alternative energy storage solutions such as fuel cells and supercapacitors; however, electrolyte batteries continue to dominate due to their cost-effectiveness and widespread applicability.
- End-User Trends: The increasing adoption of electric vehicles (EVs) and energy storage systems (ESS) is driving significant demand for electrolyte batteries across diverse segments.
Electrolyte Battery Industry Trends & Insights
The electrolyte battery market is experiencing robust growth, fueled by several key factors. The global market CAGR from 2025 to 2033 is projected at xx%. This growth is primarily driven by the escalating demand for EVs, the expanding energy storage sector, and the increasing penetration of consumer electronics. Technological advancements are leading to improved battery performance, longer lifespans, and enhanced safety features, further stimulating market growth. Consumer preferences are shifting towards environmentally friendly and cost-effective energy solutions, creating strong impetus for the adoption of advanced electrolyte battery technologies. Competitive dynamics are intensifying as manufacturers strive to innovate and differentiate their offerings, fostering increased product diversity and market penetration. The market penetration of lithium-ion batteries in the EV segment has increased from xx% in 2019 to xx% in 2024, highlighting the significant shift toward this technology.
Dominant Markets & Segments in Electrolyte Battery Industry
The lithium-ion battery segment is currently the dominant market segment, accounting for a significant portion of the overall market value. This is attributed to its higher energy density compared to other battery types. The electric vehicle (EV) end-use segment is the fastest-growing sector due to the rapid expansion of the electric vehicle market globally. Growth is particularly pronounced in regions with supportive government policies and investments in charging infrastructure.
- Leading Regions: Asia-Pacific (China, Japan, South Korea) are currently leading the market, driven by robust manufacturing capabilities, supportive government policies, and growing demand.
- Key Drivers:
- Electric Vehicle (EV) Adoption: Government incentives, rising fuel costs, and environmental concerns are accelerating EV adoption, increasing the demand for electrolyte batteries.
- Energy Storage Systems (ESS): The growing need for grid-scale energy storage solutions for renewable energy integration is boosting the demand for flow batteries and other battery types.
- Consumer Electronics: The proliferation of portable electronic devices, such as smartphones and laptops, fuels the demand for smaller, high-performance batteries.
- Dominant Segments:
- Battery Type: Lithium-ion batteries dominate due to high energy density and versatility.
- Electrolyte Type: Liquid electrolytes are the most prevalent, while solid-state electrolyte technology is rapidly emerging.
- End-User: Electric vehicles are the primary driver of growth, followed by energy storage and consumer electronics.
Electrolyte Battery Industry Product Developments
Recent product innovations focus on enhancing energy density, improving safety features, and extending battery lifespan. Manufacturers are exploring novel materials, advanced manufacturing processes, and innovative battery designs to address the limitations of existing technologies. The market is witnessing the emergence of solid-state batteries, which offer improved safety and energy density compared to conventional lithium-ion batteries. These advancements are driving the adoption of electrolyte batteries across a wider range of applications.
Report Scope & Segmentation Analysis
This report segments the electrolyte battery market based on battery type (Lead Acid, Lithium-ion, Flow Battery, Zinc Bromide, Other), electrolyte type (Gel, Liquid, Solid-state, Other), and end-user (Electric Vehicle, Energy Storage, Consumer Electronics, Other). Each segment's market size, growth projections, and competitive dynamics are analyzed, providing a comprehensive understanding of the market structure. For example, the lithium-ion segment is expected to experience a CAGR of xx% during the forecast period, driven by strong demand from the electric vehicle industry. The flow battery market, although smaller, is witnessing significant growth due to its applications in large-scale energy storage.
Key Drivers of Electrolyte Battery Industry Growth
Several key factors are driving the growth of the electrolyte battery industry. These include:
- Technological advancements: Continuous innovation in battery chemistry, materials science, and manufacturing processes is leading to improvements in energy density, lifespan, and safety.
- Government policies and incentives: Government regulations promoting the adoption of electric vehicles and renewable energy are driving demand for electrolyte batteries.
- Rising demand for electric vehicles: The global shift toward electric mobility is a major driver of growth in the electrolyte battery market.
- Increasing energy storage needs: The need for efficient energy storage solutions for renewable energy sources is creating new opportunities for electrolyte batteries.
Challenges in the Electrolyte Battery Industry Sector
The electrolyte battery industry faces several challenges, including:
- Raw material supply chain disruptions: Fluctuations in the price and availability of critical raw materials can impact production costs and profitability.
- Safety concerns: The potential for battery fires and explosions remains a concern, requiring improvements in battery safety and thermal management.
- High manufacturing costs: The manufacturing of advanced electrolyte batteries can be expensive, hindering their wider adoption.
- Environmental impact: The environmental impact of battery production and disposal needs to be addressed through sustainable manufacturing practices and recycling initiatives.
Emerging Opportunities in Electrolyte Battery Industry
Several emerging trends present significant opportunities for growth in the electrolyte battery industry. These include:
- Solid-state battery technology: Solid-state batteries offer improved safety and energy density, representing a significant advancement in battery technology.
- Next-generation battery chemistries: Research into alternative battery chemistries, such as lithium-sulfur and lithium-air batteries, holds the potential to revolutionize energy storage.
- Battery recycling and reuse: Developing efficient battery recycling processes is crucial for reducing environmental impact and securing valuable raw materials.
- Development of advanced battery management systems: Sophisticated battery management systems enhance battery performance, safety, and lifespan.
Leading Players in the Electrolyte Battery Industry Market
- UBE Industries Ltd
- Targray Industries Inc
- Mitsui Chemicals Inc
- NEI Corporation
- 3M Co
- Guangzhou Tinci Materials Technology Co Ltd
- Mitsubishi Chemical Holdings Corporation
- Shenzhen Capchem Technology Co Ltd
Key Developments in Electrolyte Battery Industry Industry
- February 2022: US Vanadium announced an expanded purchase agreement with Enerox for up to 3 Million additional liters/year of ultra-high-purity electrolyte.
- January 2022: Nexeon Limited licensed its NSP-1 technology to SKC Co. Ltd. for next-generation lithium-ion batteries.
Strategic Outlook for Electrolyte Battery Industry Market
The electrolyte battery market is poised for significant growth, driven by the increasing demand for electric vehicles, energy storage systems, and portable electronic devices. Continuous technological advancements, supportive government policies, and the growing awareness of environmental sustainability will further propel market expansion. The focus on developing safer, more efficient, and cost-effective battery technologies will shape the future of the electrolyte battery industry, creating lucrative opportunities for manufacturers, investors, and stakeholders.
Electrolyte Battery Industry Segmentation
-
1. Battery Type and Electrolyte Type
-
1.1. Lead Acid
- 1.1.1. Liquid Electrolyte
- 1.1.2. Gel Electrolyte
-
1.2. Lithium-ion
- 1.2.1. Solid Electrolyte
-
1.3. Flow Battery
- 1.3.1. Vanadium
- 1.3.2. Zinc Bromide
- 1.4. Other Battery Types and Electrolyte Types
- 1.5. Liquid Electrolyte
-
1.1. Lead Acid
-
2. End User
- 2.1. Electric Vehicle
- 2.2. Energy Storage
- 2.3. Consumer Electronics
- 2.4. Other End Users
Electrolyte Battery Industry Segmentation By Geography
- 1. North America
- 2. Europe
- 3. Asia Pacific
- 4. South America
- 5. Middle East and Africa
Electrolyte Battery Industry Regional Market Share
Geographic Coverage of Electrolyte Battery Industry
Electrolyte Battery Industry REPORT HIGHLIGHTS
| Aspects | Details |
|---|---|
| Study Period | 2020-2034 |
| Base Year | 2025 |
| Estimated Year | 2026 |
| Forecast Period | 2026-2034 |
| Historical Period | 2020-2025 |
| Growth Rate | CAGR of 11.60% from 2020-2034 |
| Segmentation |
|
Table of Contents
- 1. Introduction
- 1.1. Research Scope
- 1.2. Market Segmentation
- 1.3. Research Objective
- 1.4. Definitions and Assumptions
- 2. Executive Summary
- 2.1. Market Snapshot
- 3. Market Dynamics
- 3.1. Market Drivers
- 3.2. Market Restrains
- 3.3. Market Trends
- 3.4. Market Opportunities
- 4. Market Factor Analysis
- 4.1. Porters Five Forces
- 4.1.1. Bargaining Power of Suppliers
- 4.1.2. Bargaining Power of Buyers
- 4.1.3. Threat of New Entrants
- 4.1.4. Threat of Substitutes
- 4.1.5. Competitive Rivalry
- 4.2. PESTEL analysis
- 4.3. BCG Analysis
- 4.3.1. Stars (High Growth, High Market Share)
- 4.3.2. Cash Cows (Low Growth, High Market Share)
- 4.3.3. Question Mark (High Growth, Low Market Share)
- 4.3.4. Dogs (Low Growth, Low Market Share)
- 4.4. Ansoff Matrix Analysis
- 4.5. Supply Chain Analysis
- 4.6. Regulatory Landscape
- 4.7. Current Market Potential and Opportunity Assessment (TAM–SAM–SOM Framework)
- 4.8. RAX Analyst Note
- 4.1. Porters Five Forces
- 5. Market Analysis, Insights and Forecast 2021-2033
- 5.1. Market Analysis, Insights and Forecast - by Battery Type and Electrolyte Type
- 5.1.1. Lead Acid
- 5.1.1.1. Liquid Electrolyte
- 5.1.1.2. Gel Electrolyte
- 5.1.2. Lithium-ion
- 5.1.2.1. Solid Electrolyte
- 5.1.3. Flow Battery
- 5.1.3.1. Vanadium
- 5.1.3.2. Zinc Bromide
- 5.1.4. Other Battery Types and Electrolyte Types
- 5.1.5. Liquid Electrolyte
- 5.1.1. Lead Acid
- 5.2. Market Analysis, Insights and Forecast - by End User
- 5.2.1. Electric Vehicle
- 5.2.2. Energy Storage
- 5.2.3. Consumer Electronics
- 5.2.4. Other End Users
- 5.3. Market Analysis, Insights and Forecast - by Region
- 5.3.1. North America
- 5.3.2. Europe
- 5.3.3. Asia Pacific
- 5.3.4. South America
- 5.3.5. Middle East and Africa
- 5.1. Market Analysis, Insights and Forecast - by Battery Type and Electrolyte Type
- 6. Global Electrolyte Battery Industry Analysis, Insights and Forecast, 2021-2033
- 6.1. Market Analysis, Insights and Forecast - by Battery Type and Electrolyte Type
- 6.1.1. Lead Acid
- 6.1.1.1. Liquid Electrolyte
- 6.1.1.2. Gel Electrolyte
- 6.1.2. Lithium-ion
- 6.1.2.1. Solid Electrolyte
- 6.1.3. Flow Battery
- 6.1.3.1. Vanadium
- 6.1.3.2. Zinc Bromide
- 6.1.4. Other Battery Types and Electrolyte Types
- 6.1.5. Liquid Electrolyte
- 6.1.1. Lead Acid
- 6.2. Market Analysis, Insights and Forecast - by End User
- 6.2.1. Electric Vehicle
- 6.2.2. Energy Storage
- 6.2.3. Consumer Electronics
- 6.2.4. Other End Users
- 6.1. Market Analysis, Insights and Forecast - by Battery Type and Electrolyte Type
- 7. North America Electrolyte Battery Industry Analysis, Insights and Forecast, 2020-2032
- 7.1. Market Analysis, Insights and Forecast - by Battery Type and Electrolyte Type
- 7.1.1. Lead Acid
- 7.1.1.1. Liquid Electrolyte
- 7.1.1.2. Gel Electrolyte
- 7.1.2. Lithium-ion
- 7.1.2.1. Solid Electrolyte
- 7.1.3. Flow Battery
- 7.1.3.1. Vanadium
- 7.1.3.2. Zinc Bromide
- 7.1.4. Other Battery Types and Electrolyte Types
- 7.1.5. Liquid Electrolyte
- 7.1.1. Lead Acid
- 7.2. Market Analysis, Insights and Forecast - by End User
- 7.2.1. Electric Vehicle
- 7.2.2. Energy Storage
- 7.2.3. Consumer Electronics
- 7.2.4. Other End Users
- 7.1. Market Analysis, Insights and Forecast - by Battery Type and Electrolyte Type
- 8. Europe Electrolyte Battery Industry Analysis, Insights and Forecast, 2020-2032
- 8.1. Market Analysis, Insights and Forecast - by Battery Type and Electrolyte Type
- 8.1.1. Lead Acid
- 8.1.1.1. Liquid Electrolyte
- 8.1.1.2. Gel Electrolyte
- 8.1.2. Lithium-ion
- 8.1.2.1. Solid Electrolyte
- 8.1.3. Flow Battery
- 8.1.3.1. Vanadium
- 8.1.3.2. Zinc Bromide
- 8.1.4. Other Battery Types and Electrolyte Types
- 8.1.5. Liquid Electrolyte
- 8.1.1. Lead Acid
- 8.2. Market Analysis, Insights and Forecast - by End User
- 8.2.1. Electric Vehicle
- 8.2.2. Energy Storage
- 8.2.3. Consumer Electronics
- 8.2.4. Other End Users
- 8.1. Market Analysis, Insights and Forecast - by Battery Type and Electrolyte Type
- 9. Asia Pacific Electrolyte Battery Industry Analysis, Insights and Forecast, 2020-2032
- 9.1. Market Analysis, Insights and Forecast - by Battery Type and Electrolyte Type
- 9.1.1. Lead Acid
- 9.1.1.1. Liquid Electrolyte
- 9.1.1.2. Gel Electrolyte
- 9.1.2. Lithium-ion
- 9.1.2.1. Solid Electrolyte
- 9.1.3. Flow Battery
- 9.1.3.1. Vanadium
- 9.1.3.2. Zinc Bromide
- 9.1.4. Other Battery Types and Electrolyte Types
- 9.1.5. Liquid Electrolyte
- 9.1.1. Lead Acid
- 9.2. Market Analysis, Insights and Forecast - by End User
- 9.2.1. Electric Vehicle
- 9.2.2. Energy Storage
- 9.2.3. Consumer Electronics
- 9.2.4. Other End Users
- 9.1. Market Analysis, Insights and Forecast - by Battery Type and Electrolyte Type
- 10. South America Electrolyte Battery Industry Analysis, Insights and Forecast, 2020-2032
- 10.1. Market Analysis, Insights and Forecast - by Battery Type and Electrolyte Type
- 10.1.1. Lead Acid
- 10.1.1.1. Liquid Electrolyte
- 10.1.1.2. Gel Electrolyte
- 10.1.2. Lithium-ion
- 10.1.2.1. Solid Electrolyte
- 10.1.3. Flow Battery
- 10.1.3.1. Vanadium
- 10.1.3.2. Zinc Bromide
- 10.1.4. Other Battery Types and Electrolyte Types
- 10.1.5. Liquid Electrolyte
- 10.1.1. Lead Acid
- 10.2. Market Analysis, Insights and Forecast - by End User
- 10.2.1. Electric Vehicle
- 10.2.2. Energy Storage
- 10.2.3. Consumer Electronics
- 10.2.4. Other End Users
- 10.1. Market Analysis, Insights and Forecast - by Battery Type and Electrolyte Type
- 11. Middle East and Africa Electrolyte Battery Industry Analysis, Insights and Forecast, 2020-2032
- 11.1. Market Analysis, Insights and Forecast - by Battery Type and Electrolyte Type
- 11.1.1. Lead Acid
- 11.1.1.1. Liquid Electrolyte
- 11.1.1.2. Gel Electrolyte
- 11.1.2. Lithium-ion
- 11.1.2.1. Solid Electrolyte
- 11.1.3. Flow Battery
- 11.1.3.1. Vanadium
- 11.1.3.2. Zinc Bromide
- 11.1.4. Other Battery Types and Electrolyte Types
- 11.1.5. Liquid Electrolyte
- 11.1.1. Lead Acid
- 11.2. Market Analysis, Insights and Forecast - by End User
- 11.2.1. Electric Vehicle
- 11.2.2. Energy Storage
- 11.2.3. Consumer Electronics
- 11.2.4. Other End Users
- 11.1. Market Analysis, Insights and Forecast - by Battery Type and Electrolyte Type
- 12. Competitive Analysis
- 12.1. Company Profiles
- 12.1.1 UBE Industries Ltd
- 12.1.1.1. Company Overview
- 12.1.1.2. Products
- 12.1.1.3. Company Financials
- 12.1.1.4. SWOT Analysis
- 12.1.2 Targray Industries Inc
- 12.1.2.1. Company Overview
- 12.1.2.2. Products
- 12.1.2.3. Company Financials
- 12.1.2.4. SWOT Analysis
- 12.1.3 Mitsui Chemicals Inc
- 12.1.3.1. Company Overview
- 12.1.3.2. Products
- 12.1.3.3. Company Financials
- 12.1.3.4. SWOT Analysis
- 12.1.4 NEI Corporation
- 12.1.4.1. Company Overview
- 12.1.4.2. Products
- 12.1.4.3. Company Financials
- 12.1.4.4. SWOT Analysis
- 12.1.5 3M Co
- 12.1.5.1. Company Overview
- 12.1.5.2. Products
- 12.1.5.3. Company Financials
- 12.1.5.4. SWOT Analysis
- 12.1.6 Guangzhou Tinci Materials Technology Co Ltd
- 12.1.6.1. Company Overview
- 12.1.6.2. Products
- 12.1.6.3. Company Financials
- 12.1.6.4. SWOT Analysis
- 12.1.7 Mitsubishi Chemical Holdings Corporation
- 12.1.7.1. Company Overview
- 12.1.7.2. Products
- 12.1.7.3. Company Financials
- 12.1.7.4. SWOT Analysis
- 12.1.8 Shenzhen Capchem Technology Co Ltd
- 12.1.8.1. Company Overview
- 12.1.8.2. Products
- 12.1.8.3. Company Financials
- 12.1.8.4. SWOT Analysis
- 12.1.1 UBE Industries Ltd
- 12.2. Market Entropy
- 12.2.1 Company's Key Areas Served
- 12.2.2 Recent Developments
- 12.3. Company Market Share Analysis 2025
- 12.3.1 Top 5 Companies Market Share Analysis
- 12.3.2 Top 3 Companies Market Share Analysis
- 12.4. List of Potential Customers
- 13. Research Methodology
List of Figures
- Figure 1: Global Electrolyte Battery Industry Revenue Breakdown (Million, %) by Region 2025 & 2033
- Figure 2: North America Electrolyte Battery Industry Revenue (Million), by Battery Type and Electrolyte Type 2025 & 2033
- Figure 3: North America Electrolyte Battery Industry Revenue Share (%), by Battery Type and Electrolyte Type 2025 & 2033
- Figure 4: North America Electrolyte Battery Industry Revenue (Million), by End User 2025 & 2033
- Figure 5: North America Electrolyte Battery Industry Revenue Share (%), by End User 2025 & 2033
- Figure 6: North America Electrolyte Battery Industry Revenue (Million), by Country 2025 & 2033
- Figure 7: North America Electrolyte Battery Industry Revenue Share (%), by Country 2025 & 2033
- Figure 8: Europe Electrolyte Battery Industry Revenue (Million), by Battery Type and Electrolyte Type 2025 & 2033
- Figure 9: Europe Electrolyte Battery Industry Revenue Share (%), by Battery Type and Electrolyte Type 2025 & 2033
- Figure 10: Europe Electrolyte Battery Industry Revenue (Million), by End User 2025 & 2033
- Figure 11: Europe Electrolyte Battery Industry Revenue Share (%), by End User 2025 & 2033
- Figure 12: Europe Electrolyte Battery Industry Revenue (Million), by Country 2025 & 2033
- Figure 13: Europe Electrolyte Battery Industry Revenue Share (%), by Country 2025 & 2033
- Figure 14: Asia Pacific Electrolyte Battery Industry Revenue (Million), by Battery Type and Electrolyte Type 2025 & 2033
- Figure 15: Asia Pacific Electrolyte Battery Industry Revenue Share (%), by Battery Type and Electrolyte Type 2025 & 2033
- Figure 16: Asia Pacific Electrolyte Battery Industry Revenue (Million), by End User 2025 & 2033
- Figure 17: Asia Pacific Electrolyte Battery Industry Revenue Share (%), by End User 2025 & 2033
- Figure 18: Asia Pacific Electrolyte Battery Industry Revenue (Million), by Country 2025 & 2033
- Figure 19: Asia Pacific Electrolyte Battery Industry Revenue Share (%), by Country 2025 & 2033
- Figure 20: South America Electrolyte Battery Industry Revenue (Million), by Battery Type and Electrolyte Type 2025 & 2033
- Figure 21: South America Electrolyte Battery Industry Revenue Share (%), by Battery Type and Electrolyte Type 2025 & 2033
- Figure 22: South America Electrolyte Battery Industry Revenue (Million), by End User 2025 & 2033
- Figure 23: South America Electrolyte Battery Industry Revenue Share (%), by End User 2025 & 2033
- Figure 24: South America Electrolyte Battery Industry Revenue (Million), by Country 2025 & 2033
- Figure 25: South America Electrolyte Battery Industry Revenue Share (%), by Country 2025 & 2033
- Figure 26: Middle East and Africa Electrolyte Battery Industry Revenue (Million), by Battery Type and Electrolyte Type 2025 & 2033
- Figure 27: Middle East and Africa Electrolyte Battery Industry Revenue Share (%), by Battery Type and Electrolyte Type 2025 & 2033
- Figure 28: Middle East and Africa Electrolyte Battery Industry Revenue (Million), by End User 2025 & 2033
- Figure 29: Middle East and Africa Electrolyte Battery Industry Revenue Share (%), by End User 2025 & 2033
- Figure 30: Middle East and Africa Electrolyte Battery Industry Revenue (Million), by Country 2025 & 2033
- Figure 31: Middle East and Africa Electrolyte Battery Industry Revenue Share (%), by Country 2025 & 2033
List of Tables
- Table 1: Global Electrolyte Battery Industry Revenue Million Forecast, by Battery Type and Electrolyte Type 2020 & 2033
- Table 2: Global Electrolyte Battery Industry Revenue Million Forecast, by End User 2020 & 2033
- Table 3: Global Electrolyte Battery Industry Revenue Million Forecast, by Region 2020 & 2033
- Table 4: Global Electrolyte Battery Industry Revenue Million Forecast, by Battery Type and Electrolyte Type 2020 & 2033
- Table 5: Global Electrolyte Battery Industry Revenue Million Forecast, by End User 2020 & 2033
- Table 6: Global Electrolyte Battery Industry Revenue Million Forecast, by Country 2020 & 2033
- Table 7: Global Electrolyte Battery Industry Revenue Million Forecast, by Battery Type and Electrolyte Type 2020 & 2033
- Table 8: Global Electrolyte Battery Industry Revenue Million Forecast, by End User 2020 & 2033
- Table 9: Global Electrolyte Battery Industry Revenue Million Forecast, by Country 2020 & 2033
- Table 10: Global Electrolyte Battery Industry Revenue Million Forecast, by Battery Type and Electrolyte Type 2020 & 2033
- Table 11: Global Electrolyte Battery Industry Revenue Million Forecast, by End User 2020 & 2033
- Table 12: Global Electrolyte Battery Industry Revenue Million Forecast, by Country 2020 & 2033
- Table 13: Global Electrolyte Battery Industry Revenue Million Forecast, by Battery Type and Electrolyte Type 2020 & 2033
- Table 14: Global Electrolyte Battery Industry Revenue Million Forecast, by End User 2020 & 2033
- Table 15: Global Electrolyte Battery Industry Revenue Million Forecast, by Country 2020 & 2033
- Table 16: Global Electrolyte Battery Industry Revenue Million Forecast, by Battery Type and Electrolyte Type 2020 & 2033
- Table 17: Global Electrolyte Battery Industry Revenue Million Forecast, by End User 2020 & 2033
- Table 18: Global Electrolyte Battery Industry Revenue Million Forecast, by Country 2020 & 2033
Frequently Asked Questions
1. What is the projected Compound Annual Growth Rate (CAGR) of the Electrolyte Battery Industry?
The projected CAGR is approximately 11.60%.
2. Which companies are prominent players in the Electrolyte Battery Industry?
Key companies in the market include UBE Industries Ltd, Targray Industries Inc, Mitsui Chemicals Inc, NEI Corporation, 3M Co, Guangzhou Tinci Materials Technology Co Ltd, Mitsubishi Chemical Holdings Corporation, Shenzhen Capchem Technology Co Ltd.
3. What are the main segments of the Electrolyte Battery Industry?
The market segments include Battery Type and Electrolyte Type, End User.
4. Can you provide details about the market size?
The market size is estimated to be USD XX Million as of 2022.
5. What are some drivers contributing to market growth?
Increasing Energy Demand.; Increasing Export Opportunities.
6. What are the notable trends driving market growth?
Lithium-ion Battery Expected to Dominate the Market.
7. Are there any restraints impacting market growth?
Volatility in Energy Prices.
8. Can you provide examples of recent developments in the market?
In February 2022, US Vanadium announced an expanded purchase agreement under which Austrian-based Enerox, which sells vanadium redox flow battery (VRFB) systems under its brand name CellCube, can purchase up to 3 million additional liters/year of US Vanadium's ultra-high-purity electrolyte with a price cap over the next five years. The agreement boosts the initial purchase agreement for 580,000 liters/year of US Vanadium electrolyte, announced in September 2021.
9. What pricing options are available for accessing the report?
Pricing options include single-user, multi-user, and enterprise licenses priced at USD 4750, USD 5250, and USD 8750 respectively.
10. Is the market size provided in terms of value or volume?
The market size is provided in terms of value, measured in Million.
11. Are there any specific market keywords associated with the report?
Yes, the market keyword associated with the report is "Electrolyte Battery Industry," which aids in identifying and referencing the specific market segment covered.
12. How do I determine which pricing option suits my needs best?
The pricing options vary based on user requirements and access needs. Individual users may opt for single-user licenses, while businesses requiring broader access may choose multi-user or enterprise licenses for cost-effective access to the report.
13. Are there any additional resources or data provided in the Electrolyte Battery Industry report?
While the report offers comprehensive insights, it's advisable to review the specific contents or supplementary materials provided to ascertain if additional resources or data are available.
14. How can I stay updated on further developments or reports in the Electrolyte Battery Industry?
To stay informed about further developments, trends, and reports in the Electrolyte Battery Industry, consider subscribing to industry newsletters, following relevant companies and organizations, or regularly checking reputable industry news sources and publications.
Methodology
Step 1 - Identification of Relevant Samples Size from Population Database


Step 2 - Approaches for Defining Global Market Size (Value, Volume* & Price*)

Note*: In applicable scenarios
Step 3 - Data Sources
Primary Research
- Web Analytics
- Survey Reports
- Research Institute
- Latest Research Reports
- Opinion Leaders
Secondary Research
- Annual Reports
- White Paper
- Latest Press Release
- Industry Association
- Paid Database
- Investor Presentations

Step 4 - Data Triangulation
Involves using different sources of information in order to increase the validity of a study
These sources are likely to be stakeholders in a program - participants, other researchers, program staff, other community members, and so on.
Then we put all data in single framework & apply various statistical tools to find out the dynamic on the market.
During the analysis stage, feedback from the stakeholder groups would be compared to determine areas of agreement as well as areas of divergence

