

Key Insights
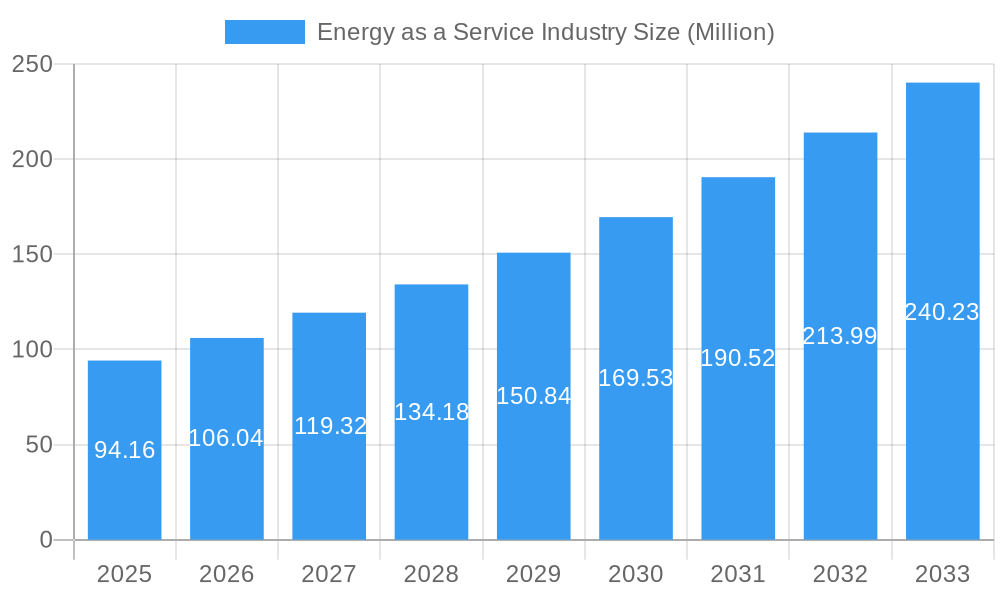
The Energy as a Service (EaaS) industry is experiencing robust growth, projected to reach a market size of $94.16 million in 2025 and maintain a Compound Annual Growth Rate (CAGR) of 12.48% from 2025 to 2033. This expansion is fueled by several key drivers. Increasing energy costs and a heightened focus on sustainability are pushing businesses and industries to adopt EaaS models, which offer predictable operational expenses and reduced upfront capital investments. The integration of advanced technologies like smart meters, AI-powered energy management systems, and renewable energy sources further enhances the attractiveness of EaaS. Furthermore, government incentives and regulations promoting energy efficiency are creating a favorable environment for market growth. The commercial sector, driven by the need to optimize energy consumption in buildings and facilities, currently dominates the market, but industrial applications are witnessing rapid adoption due to the potential for significant energy savings and improved operational efficiency in manufacturing processes.
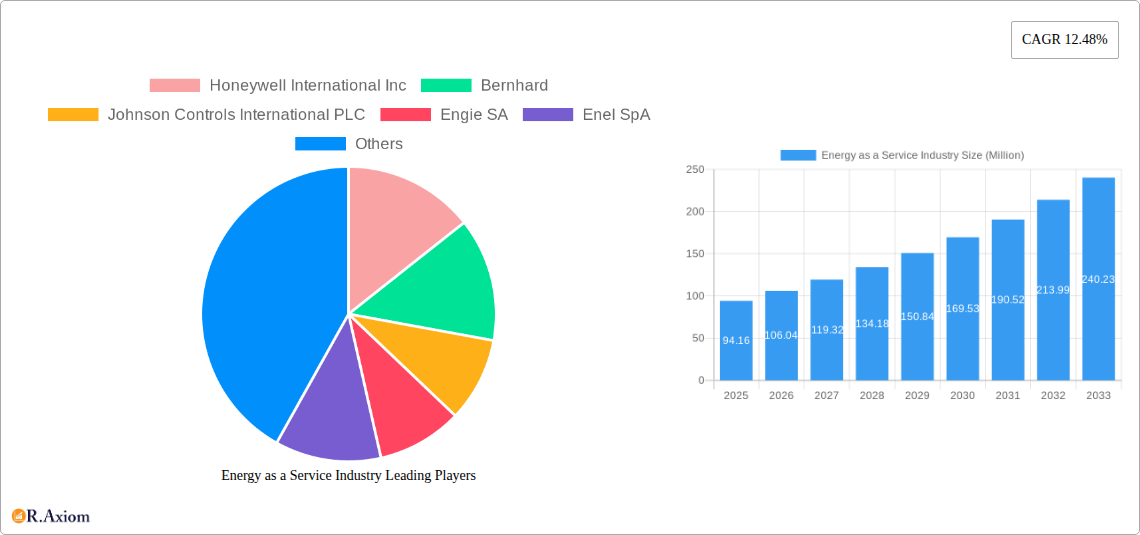
Energy as a Service Industry Market Size (In Million)
Key market restraints include the initial investment required for infrastructure upgrades and the potential for long-term contract lock-in. However, innovative financing options and flexible contract terms are gradually mitigating these concerns. Geographic distribution reveals strong market presence in North America and Europe, with significant growth potential in Asia-Pacific, driven by rapid industrialization and urbanization in countries like China and India. Major players, including Honeywell International Inc., Johnson Controls, and Schneider Electric, are actively shaping the market through technological advancements, strategic partnerships, and acquisitions, further solidifying the EaaS sector's position as a key component of the future energy landscape. The competitive landscape is characterized by a mix of large multinational corporations and specialized EaaS providers, leading to innovation and diversified offerings tailored to specific customer needs. This dynamic market structure is expected to contribute to sustained growth throughout the forecast period.
Energy as a Service Industry Company Market Share
This comprehensive report provides an in-depth analysis of the Energy as a Service (EaaS) industry, covering market size, growth projections, competitive landscape, and key trends from 2019 to 2033. The study period is 2019-2033, with 2025 as the base and estimated year. The forecast period is 2025-2033, and the historical period is 2019-2024. This report is essential for industry stakeholders, investors, and businesses seeking to understand and capitalize on the opportunities within this rapidly evolving market. The total market size in 2025 is estimated at $xx Million.
Energy as a Service Industry Market Concentration & Innovation
The EaaS market is characterized by a moderately concentrated landscape, with several major players dominating significant market share. Honeywell International Inc, Johnson Controls International PLC, Engie SA, and Schneider Electric SE are amongst the leading companies, collectively holding an estimated xx% market share in 2025. However, the market also features numerous smaller, specialized providers, particularly in niche segments.
Innovation Drivers:
- Technological advancements: Improvements in energy efficiency technologies, smart grid integration, and data analytics are driving innovation.
- Regulatory frameworks: Government policies promoting renewable energy and energy efficiency are creating favorable conditions for EaaS adoption.
- Product substitutes: While traditional energy procurement methods remain prevalent, the EaaS model's cost-effectiveness and reduced risk are driving substitution.
- End-user trends: Increasing demand for sustainable energy solutions and a preference for flexible, outcome-based contracts are fueling market growth.
M&A Activities: The EaaS sector witnessed significant M&A activity in recent years, with deal values exceeding $xx Million in 2024 alone. These transactions reflect the strategic importance of EaaS and the consolidation within the market. For example, Honeywell's investment in Redaptive (March 2023) highlights the strategic moves to expand EaaS capabilities.
Energy as a Service Industry Industry Trends & Insights
The EaaS market is experiencing robust growth, driven by several key factors. The Compound Annual Growth Rate (CAGR) is projected to be xx% during the forecast period (2025-2033), indicating a significant expansion in market size. Market penetration is steadily increasing, especially within the commercial and industrial sectors, with an estimated xx% penetration rate in 2025.
Several technological disruptions are shaping the industry, including the rise of AI-powered energy management systems, the increasing adoption of renewable energy sources integrated into EaaS offerings, and the development of innovative financing models that make EaaS more accessible to a wider range of customers. Consumer preferences are shifting towards sustainable and cost-effective energy solutions, further boosting the demand for EaaS. Competitive dynamics are intense, with established players expanding their offerings and new entrants leveraging technological innovations to gain market share.
Dominant Markets & Segments in Energy as a Service Industry
The North American region currently spearheads the global Energy as a Service (EaaS) market, with the United States and Canada commanding the largest share of revenue. This leadership is underpinned by a confluence of powerful factors:
- Robust Regulatory Support: Proactive government initiatives and policies championing energy efficiency, the integration of renewable energy sources, and the adoption of sustainable practices are pivotal accelerators for EaaS adoption.
- Well-Developed Infrastructure: The presence of sophisticated and adaptable existing energy and digital infrastructure significantly streamlines the deployment and scalability of EaaS solutions.
- High Energy Consumption & Demand for Optimization: The substantial energy demands inherent in these regions create a fertile ground for advanced energy optimization services and innovative EaaS models that promise cost savings and enhanced performance.
Segment Analysis:
Both the commercial and industrial sectors are exhibiting robust growth trajectories, fueled by an increasing imperative to curtail energy expenditures and elevate operational efficiency. The industrial segment, characterized by its high energy intensity and the substantial potential for cost reductions, demonstrates a particularly accelerated growth rate compared to its commercial counterpart. This is often driven by the tangible ROI from optimizing complex energy systems.
Energy as a Service Industry Product Developments
The landscape of EaaS is continually evolving with groundbreaking product innovations. These advancements prominently feature the seamless integration of sophisticated advanced analytics, proactive predictive maintenance capabilities, and real-time energy monitoring tools directly within EaaS platforms. This enhancement significantly amplifies the value proposition for customers, leading to tangible improvements in overall efficiency, a reduction in costly downtime, and optimized energy consumption patterns. Furthermore, the market is actively witnessing the rise of highly specialized EaaS solutions meticulously tailored to the unique energy needs and operational demands of specific industries, including advanced manufacturing, critical healthcare facilities, and energy-intensive data centers.
Report Scope & Segmentation Analysis
This report segments the EaaS market by end-user (Commercial and Industrial). The Commercial segment encompasses businesses like offices, retail spaces, and hospitality, with a projected market size of $xx Million in 2025 and a CAGR of xx%. The Industrial segment comprises manufacturing facilities, processing plants, and other energy-intensive industries. This segment is expected to reach $xx Million in 2025, with a CAGR of xx%. Competitive dynamics within each segment vary, with established players competing on service quality, technology, and pricing.
Key Drivers of Energy as a Service Industry Growth
The burgeoning expansion of the EaaS industry is being propelled by a synergistic interplay of several critical factors:
- Technological Advancements: The integration of cutting-edge technologies such as AI-powered energy management systems, the pervasive reach of IoT integration for data collection and control, and the increasing incorporation of renewable energy sources are collectively driving unprecedented levels of efficiency and substantial cost savings for end-users.
- Economic Incentives: A supportive ecosystem of government subsidies, attractive tax breaks, and accessible energy efficiency rebates plays a crucial role in de-risking EaaS investments and incentivizing widespread adoption across various business sectors.
- Regulatory Pressures & Sustainability Mandates: Increasingly stringent environmental regulations and a growing global emphasis on sustainability mandates are compelling organizations to seek and implement cleaner, more efficient, and ultimately more sustainable energy solutions, thereby fueling the demand for EaaS.
Challenges in the Energy as a Service Industry Sector
The EaaS sector faces several challenges:
- Regulatory uncertainties: Evolving regulations and inconsistent standards across different regions create complexities.
- Supply chain disruptions: Global supply chain issues impact the availability of critical components and technologies.
- Competition: The increasing number of players and diverse service offerings heighten competitive pressures.
Emerging Opportunities in Energy as a Service Industry
The EaaS market presents various emerging opportunities:
- Expansion into new markets: Untapped potential exists in developing economies with growing energy demands.
- Integration of new technologies: Blockchain technology and microgrids offer potential for enhanced security and efficiency.
- Development of tailored solutions: Specialized EaaS services for specific industries can capture niche markets.
Leading Players in the Energy as a Service Industry Market
- Honeywell International Inc
- Bernhard
- Johnson Controls International PLC
- Engie SA
- Enel SpA
- Spark Community Investment Co
- Schneider Electric SE
- Veolia Environnement SA
- Electricite de France (EDF) SA
Key Developments in Energy as a Service Industry Industry
- March 2023: Honeywell announced a strategic investment in Redaptive to accelerate the collaboration and bring Energy-as-a-service (EaaS) capabilities to commercial and industrial buildings. This investment significantly expands Honeywell's reach within the EaaS sector.
- April 2023: Capstone Green Energy Corporation secured a contract for an additional C800S Signature Series microturbine through its distributor Lone Star Power Solutions with a large West Texas energy company. This contract builds upon a previous 3.6 MW EaaS agreement, reinforcing the growing adoption of EaaS solutions within the energy industry.
Strategic Outlook for Energy as a Service Industry Market
The Energy as a Service (EaaS) market is strategically positioned for sustained and significant expansion. This growth is being catalyzed by a heightened global awareness of sustainability imperatives, the persistent and growing need for sophisticated cost optimization strategies, and the continuous wave of technological innovation that enhances service delivery and value. The market's untapped potential remains substantial, presenting numerous opportunities for growth across a diverse spectrum of market segments and geographical regions. Moving forward, the paramount focus on developing and delivering highly customized, integrated, and outcome-driven EaaS solutions will be the definitive key to achieving enduring success and market leadership in this dynamic industry.
Energy as a Service Industry Segmentation
-
1. End User
- 1.1. Commercial
- 1.2. Industrial
Energy as a Service Industry Segmentation By Geography
-
1. North America
- 1.1. United States
- 1.2. Canada
- 1.3. Rest of North America
-
2. Europe
- 2.1. Germany
- 2.2. France
- 2.3. United Kingdom
- 2.4. Rest of Europe
-
3. Asia Pacific
- 3.1. China
- 3.2. India
- 3.3. Japan
- 3.4. South Korea
- 3.5. Rest of Asia Pacific
-
4. South America
- 4.1. Brazil
- 4.2. Argentina
- 4.3. Rest of South America
-
5. Middle East and Africa
- 5.1. Saudi Arabia
- 5.2. United Arab Emirates
- 5.3. South Africa
- 5.4. Rest of Middle East and Africa
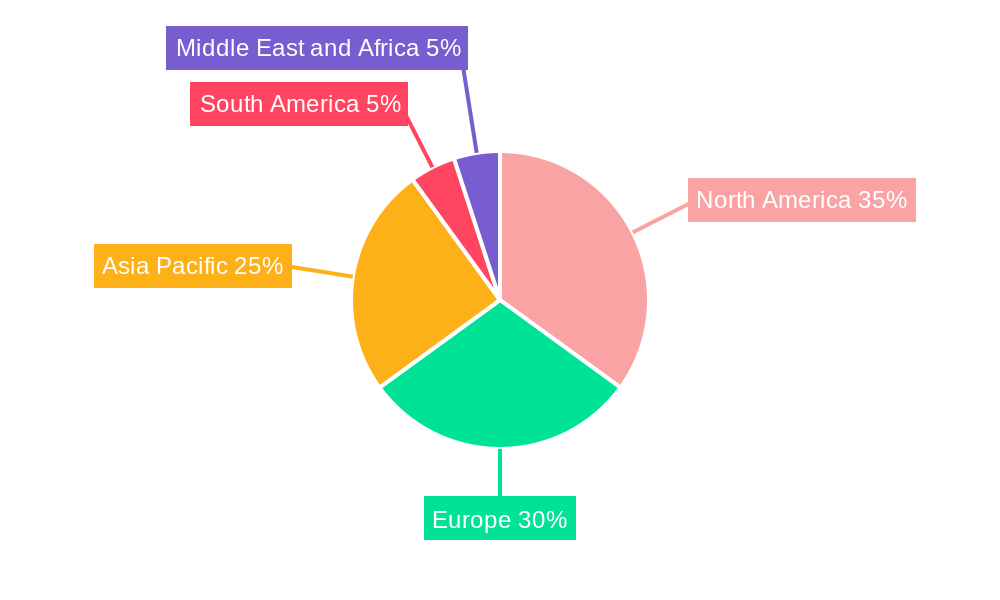
Energy as a Service Industry Regional Market Share
Geographic Coverage of Energy as a Service Industry
Energy as a Service Industry REPORT HIGHLIGHTS
| Aspects | Details |
|---|---|
| Study Period | 2020-2034 |
| Base Year | 2025 |
| Estimated Year | 2026 |
| Forecast Period | 2026-2034 |
| Historical Period | 2020-2025 |
| Growth Rate | CAGR of 12.48% from 2020-2034 |
| Segmentation |
|
Table of Contents
- 1. Introduction
- 1.1. Research Scope
- 1.2. Market Segmentation
- 1.3. Research Objective
- 1.4. Definitions and Assumptions
- 2. Executive Summary
- 2.1. Market Snapshot
- 3. Market Dynamics
- 3.1. Market Drivers
- 3.2. Market Restrains
- 3.3. Market Trends
- 3.4. Market Opportunities
- 4. Market Factor Analysis
- 4.1. Porters Five Forces
- 4.1.1. Bargaining Power of Suppliers
- 4.1.2. Bargaining Power of Buyers
- 4.1.3. Threat of New Entrants
- 4.1.4. Threat of Substitutes
- 4.1.5. Competitive Rivalry
- 4.2. PESTEL analysis
- 4.3. BCG Analysis
- 4.3.1. Stars (High Growth, High Market Share)
- 4.3.2. Cash Cows (Low Growth, High Market Share)
- 4.3.3. Question Mark (High Growth, Low Market Share)
- 4.3.4. Dogs (Low Growth, Low Market Share)
- 4.4. Ansoff Matrix Analysis
- 4.5. Supply Chain Analysis
- 4.6. Regulatory Landscape
- 4.7. Current Market Potential and Opportunity Assessment (TAM–SAM–SOM Framework)
- 4.8. RAX Analyst Note
- 4.1. Porters Five Forces
- 5. Market Analysis, Insights and Forecast 2021-2033
- 5.1. Market Analysis, Insights and Forecast - by End User
- 5.1.1. Commercial
- 5.1.2. Industrial
- 5.2. Market Analysis, Insights and Forecast - by Region
- 5.2.1. North America
- 5.2.2. Europe
- 5.2.3. Asia Pacific
- 5.2.4. South America
- 5.2.5. Middle East and Africa
- 5.1. Market Analysis, Insights and Forecast - by End User
- 6. Global Energy as a Service Industry Analysis, Insights and Forecast, 2021-2033
- 6.1. Market Analysis, Insights and Forecast - by End User
- 6.1.1. Commercial
- 6.1.2. Industrial
- 6.1. Market Analysis, Insights and Forecast - by End User
- 7. North America Energy as a Service Industry Analysis, Insights and Forecast, 2020-2032
- 7.1. Market Analysis, Insights and Forecast - by End User
- 7.1.1. Commercial
- 7.1.2. Industrial
- 7.1. Market Analysis, Insights and Forecast - by End User
- 8. Europe Energy as a Service Industry Analysis, Insights and Forecast, 2020-2032
- 8.1. Market Analysis, Insights and Forecast - by End User
- 8.1.1. Commercial
- 8.1.2. Industrial
- 8.1. Market Analysis, Insights and Forecast - by End User
- 9. Asia Pacific Energy as a Service Industry Analysis, Insights and Forecast, 2020-2032
- 9.1. Market Analysis, Insights and Forecast - by End User
- 9.1.1. Commercial
- 9.1.2. Industrial
- 9.1. Market Analysis, Insights and Forecast - by End User
- 10. South America Energy as a Service Industry Analysis, Insights and Forecast, 2020-2032
- 10.1. Market Analysis, Insights and Forecast - by End User
- 10.1.1. Commercial
- 10.1.2. Industrial
- 10.1. Market Analysis, Insights and Forecast - by End User
- 11. Middle East and Africa Energy as a Service Industry Analysis, Insights and Forecast, 2020-2032
- 11.1. Market Analysis, Insights and Forecast - by End User
- 11.1.1. Commercial
- 11.1.2. Industrial
- 11.1. Market Analysis, Insights and Forecast - by End User
- 12. Competitive Analysis
- 12.1. Company Profiles
- 12.1.1 Honeywell International Inc
- 12.1.1.1. Company Overview
- 12.1.1.2. Products
- 12.1.1.3. Company Financials
- 12.1.1.4. SWOT Analysis
- 12.1.2 Bernhard
- 12.1.2.1. Company Overview
- 12.1.2.2. Products
- 12.1.2.3. Company Financials
- 12.1.2.4. SWOT Analysis
- 12.1.3 Johnson Controls International PLC
- 12.1.3.1. Company Overview
- 12.1.3.2. Products
- 12.1.3.3. Company Financials
- 12.1.3.4. SWOT Analysis
- 12.1.4 Engie SA
- 12.1.4.1. Company Overview
- 12.1.4.2. Products
- 12.1.4.3. Company Financials
- 12.1.4.4. SWOT Analysis
- 12.1.5 Enel SpA
- 12.1.5.1. Company Overview
- 12.1.5.2. Products
- 12.1.5.3. Company Financials
- 12.1.5.4. SWOT Analysis
- 12.1.6 Spark Community Investment Co
- 12.1.6.1. Company Overview
- 12.1.6.2. Products
- 12.1.6.3. Company Financials
- 12.1.6.4. SWOT Analysis
- 12.1.7 Schneider Electric SE
- 12.1.7.1. Company Overview
- 12.1.7.2. Products
- 12.1.7.3. Company Financials
- 12.1.7.4. SWOT Analysis
- 12.1.8 Veolia Environnement SA
- 12.1.8.1. Company Overview
- 12.1.8.2. Products
- 12.1.8.3. Company Financials
- 12.1.8.4. SWOT Analysis
- 12.1.9 Electricite de France (EDF) SA
- 12.1.9.1. Company Overview
- 12.1.9.2. Products
- 12.1.9.3. Company Financials
- 12.1.9.4. SWOT Analysis
- 12.1.1 Honeywell International Inc
- 12.2. Market Entropy
- 12.2.1 Company's Key Areas Served
- 12.2.2 Recent Developments
- 12.3. Company Market Share Analysis 2025
- 12.3.1 Top 5 Companies Market Share Analysis
- 12.3.2 Top 3 Companies Market Share Analysis
- 12.4. List of Potential Customers
- 13. Research Methodology
List of Figures
- Figure 1: Global Energy as a Service Industry Revenue Breakdown (Million, %) by Region 2025 & 2033
- Figure 2: North America Energy as a Service Industry Revenue (Million), by End User 2025 & 2033
- Figure 3: North America Energy as a Service Industry Revenue Share (%), by End User 2025 & 2033
- Figure 4: North America Energy as a Service Industry Revenue (Million), by Country 2025 & 2033
- Figure 5: North America Energy as a Service Industry Revenue Share (%), by Country 2025 & 2033
- Figure 6: Europe Energy as a Service Industry Revenue (Million), by End User 2025 & 2033
- Figure 7: Europe Energy as a Service Industry Revenue Share (%), by End User 2025 & 2033
- Figure 8: Europe Energy as a Service Industry Revenue (Million), by Country 2025 & 2033
- Figure 9: Europe Energy as a Service Industry Revenue Share (%), by Country 2025 & 2033
- Figure 10: Asia Pacific Energy as a Service Industry Revenue (Million), by End User 2025 & 2033
- Figure 11: Asia Pacific Energy as a Service Industry Revenue Share (%), by End User 2025 & 2033
- Figure 12: Asia Pacific Energy as a Service Industry Revenue (Million), by Country 2025 & 2033
- Figure 13: Asia Pacific Energy as a Service Industry Revenue Share (%), by Country 2025 & 2033
- Figure 14: South America Energy as a Service Industry Revenue (Million), by End User 2025 & 2033
- Figure 15: South America Energy as a Service Industry Revenue Share (%), by End User 2025 & 2033
- Figure 16: South America Energy as a Service Industry Revenue (Million), by Country 2025 & 2033
- Figure 17: South America Energy as a Service Industry Revenue Share (%), by Country 2025 & 2033
- Figure 18: Middle East and Africa Energy as a Service Industry Revenue (Million), by End User 2025 & 2033
- Figure 19: Middle East and Africa Energy as a Service Industry Revenue Share (%), by End User 2025 & 2033
- Figure 20: Middle East and Africa Energy as a Service Industry Revenue (Million), by Country 2025 & 2033
- Figure 21: Middle East and Africa Energy as a Service Industry Revenue Share (%), by Country 2025 & 2033
List of Tables
- Table 1: Global Energy as a Service Industry Revenue Million Forecast, by End User 2020 & 2033
- Table 2: Global Energy as a Service Industry Revenue Million Forecast, by Region 2020 & 2033
- Table 3: Global Energy as a Service Industry Revenue Million Forecast, by End User 2020 & 2033
- Table 4: Global Energy as a Service Industry Revenue Million Forecast, by Country 2020 & 2033
- Table 5: United States Energy as a Service Industry Revenue (Million) Forecast, by Application 2020 & 2033
- Table 6: Canada Energy as a Service Industry Revenue (Million) Forecast, by Application 2020 & 2033
- Table 7: Rest of North America Energy as a Service Industry Revenue (Million) Forecast, by Application 2020 & 2033
- Table 8: Global Energy as a Service Industry Revenue Million Forecast, by End User 2020 & 2033
- Table 9: Global Energy as a Service Industry Revenue Million Forecast, by Country 2020 & 2033
- Table 10: Germany Energy as a Service Industry Revenue (Million) Forecast, by Application 2020 & 2033
- Table 11: France Energy as a Service Industry Revenue (Million) Forecast, by Application 2020 & 2033
- Table 12: United Kingdom Energy as a Service Industry Revenue (Million) Forecast, by Application 2020 & 2033
- Table 13: Rest of Europe Energy as a Service Industry Revenue (Million) Forecast, by Application 2020 & 2033
- Table 14: Global Energy as a Service Industry Revenue Million Forecast, by End User 2020 & 2033
- Table 15: Global Energy as a Service Industry Revenue Million Forecast, by Country 2020 & 2033
- Table 16: China Energy as a Service Industry Revenue (Million) Forecast, by Application 2020 & 2033
- Table 17: India Energy as a Service Industry Revenue (Million) Forecast, by Application 2020 & 2033
- Table 18: Japan Energy as a Service Industry Revenue (Million) Forecast, by Application 2020 & 2033
- Table 19: South Korea Energy as a Service Industry Revenue (Million) Forecast, by Application 2020 & 2033
- Table 20: Rest of Asia Pacific Energy as a Service Industry Revenue (Million) Forecast, by Application 2020 & 2033
- Table 21: Global Energy as a Service Industry Revenue Million Forecast, by End User 2020 & 2033
- Table 22: Global Energy as a Service Industry Revenue Million Forecast, by Country 2020 & 2033
- Table 23: Brazil Energy as a Service Industry Revenue (Million) Forecast, by Application 2020 & 2033
- Table 24: Argentina Energy as a Service Industry Revenue (Million) Forecast, by Application 2020 & 2033
- Table 25: Rest of South America Energy as a Service Industry Revenue (Million) Forecast, by Application 2020 & 2033
- Table 26: Global Energy as a Service Industry Revenue Million Forecast, by End User 2020 & 2033
- Table 27: Global Energy as a Service Industry Revenue Million Forecast, by Country 2020 & 2033
- Table 28: Saudi Arabia Energy as a Service Industry Revenue (Million) Forecast, by Application 2020 & 2033
- Table 29: United Arab Emirates Energy as a Service Industry Revenue (Million) Forecast, by Application 2020 & 2033
- Table 30: South Africa Energy as a Service Industry Revenue (Million) Forecast, by Application 2020 & 2033
- Table 31: Rest of Middle East and Africa Energy as a Service Industry Revenue (Million) Forecast, by Application 2020 & 2033
Frequently Asked Questions
1. What is the projected Compound Annual Growth Rate (CAGR) of the Energy as a Service Industry?
The projected CAGR is approximately 12.48%.
2. Which companies are prominent players in the Energy as a Service Industry?
Key companies in the market include Honeywell International Inc, Bernhard, Johnson Controls International PLC, Engie SA, Enel SpA, Spark Community Investment Co, Schneider Electric SE, Veolia Environnement SA, Electricite de France (EDF) SA.
3. What are the main segments of the Energy as a Service Industry?
The market segments include End User.
4. Can you provide details about the market size?
The market size is estimated to be USD 94.16 Million as of 2022.
5. What are some drivers contributing to market growth?
4.; Growing Demand for Energy As A Service4.; Increasing Adoption of Distributed Energy Generation in Commercial and Industrial Sectors.
6. What are the notable trends driving market growth?
Commercial Segment to Dominate the Market.
7. Are there any restraints impacting market growth?
4.; Lack of Awareness in Developing Economies and High Technological Costs.
8. Can you provide examples of recent developments in the market?
April 2023: Capstone Green Energy Corporation announced that its southern U.S. distributor, Lone Star Power Solutions, contracted with a large West Texas energy company to deliver an additional C800S Signature Series microturbine following Energy-as-a-Service (EaaS) for 3.6 MW contract earlier this year.
9. What pricing options are available for accessing the report?
Pricing options include single-user, multi-user, and enterprise licenses priced at USD 4750, USD 5250, and USD 8750 respectively.
10. Is the market size provided in terms of value or volume?
The market size is provided in terms of value, measured in Million.
11. Are there any specific market keywords associated with the report?
Yes, the market keyword associated with the report is "Energy as a Service Industry," which aids in identifying and referencing the specific market segment covered.
12. How do I determine which pricing option suits my needs best?
The pricing options vary based on user requirements and access needs. Individual users may opt for single-user licenses, while businesses requiring broader access may choose multi-user or enterprise licenses for cost-effective access to the report.
13. Are there any additional resources or data provided in the Energy as a Service Industry report?
While the report offers comprehensive insights, it's advisable to review the specific contents or supplementary materials provided to ascertain if additional resources or data are available.
14. How can I stay updated on further developments or reports in the Energy as a Service Industry?
To stay informed about further developments, trends, and reports in the Energy as a Service Industry, consider subscribing to industry newsletters, following relevant companies and organizations, or regularly checking reputable industry news sources and publications.
Methodology
Step 1 - Identification of Relevant Samples Size from Population Database


Step 2 - Approaches for Defining Global Market Size (Value, Volume* & Price*)

Note*: In applicable scenarios
Step 3 - Data Sources
Primary Research
- Web Analytics
- Survey Reports
- Research Institute
- Latest Research Reports
- Opinion Leaders
Secondary Research
- Annual Reports
- White Paper
- Latest Press Release
- Industry Association
- Paid Database
- Investor Presentations

Step 4 - Data Triangulation
Involves using different sources of information in order to increase the validity of a study
These sources are likely to be stakeholders in a program - participants, other researchers, program staff, other community members, and so on.
Then we put all data in single framework & apply various statistical tools to find out the dynamic on the market.
During the analysis stage, feedback from the stakeholder groups would be compared to determine areas of agreement as well as areas of divergence