
Key Insights
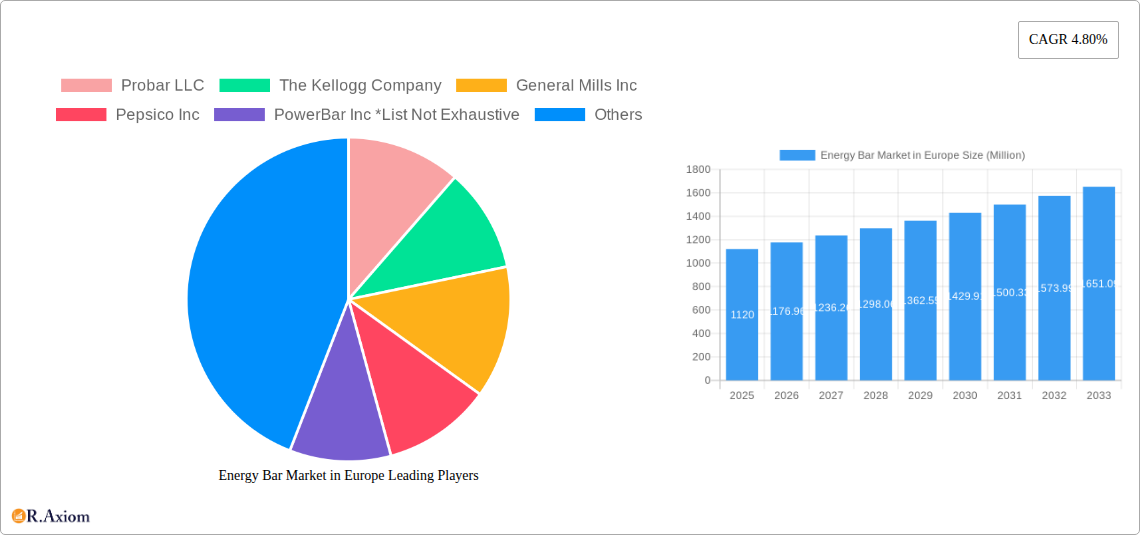
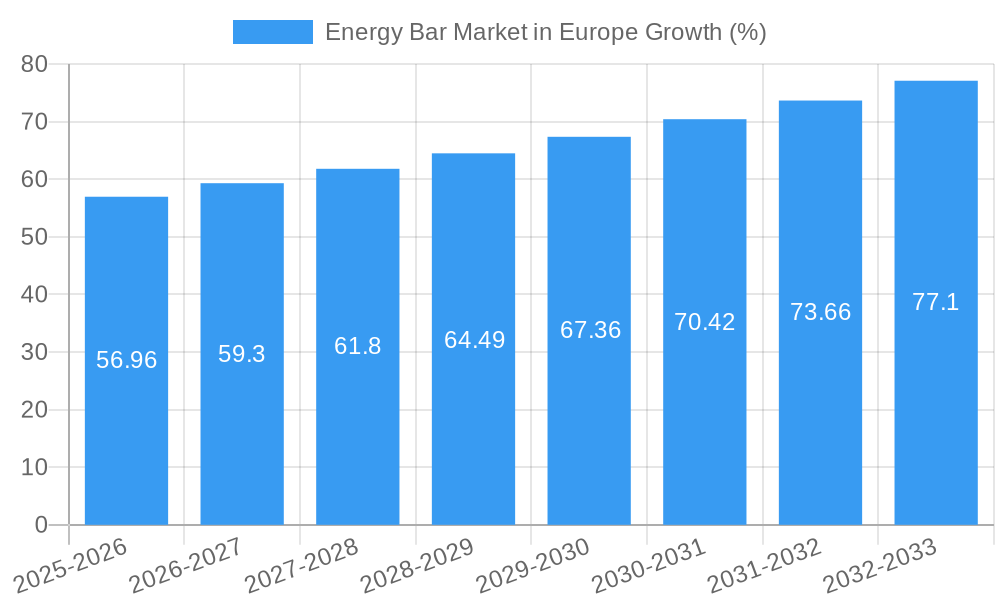
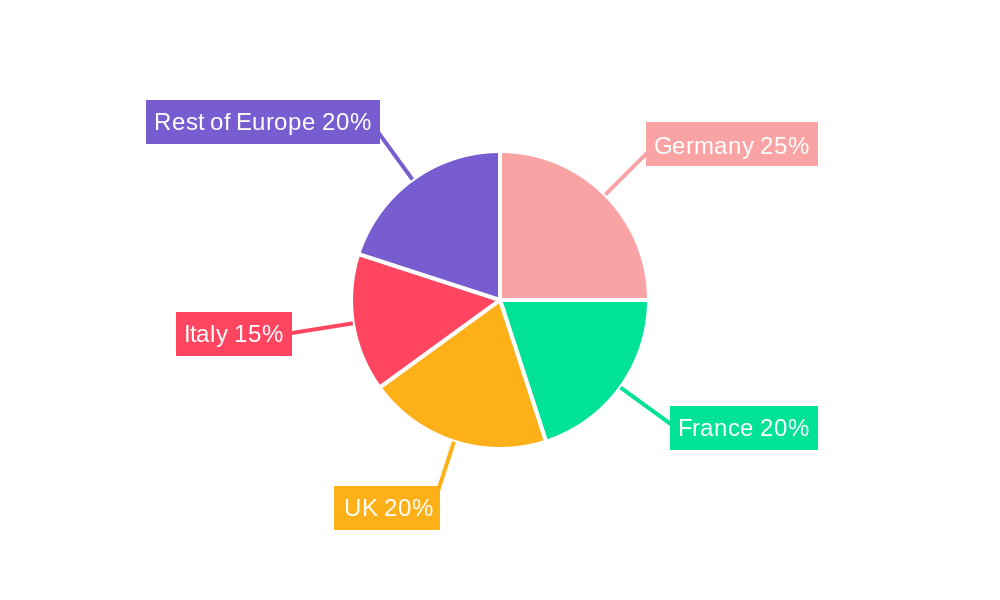
The European energy bar market, valued at €1120 million in 2025, is projected to experience robust growth, driven by increasing health consciousness among consumers, the rising popularity of convenient and on-the-go snacking options, and the expanding availability of energy bars across diverse distribution channels. The market's Compound Annual Growth Rate (CAGR) of 4.80% from 2025 to 2033 indicates a steady expansion, with significant potential for further growth. Key drivers include the increasing demand for functional foods, the growing prevalence of fitness activities and athletic pursuits, and the development of innovative energy bar formulations focusing on natural ingredients, increased protein content, and reduced sugar levels. The market is segmented by distribution channel, with supermarkets/hypermarkets dominating sales followed by convenience stores and online retail, which is experiencing rapid growth fueled by e-commerce expansion and increased online shopping habits. Leading players like Probar LLC, Kellogg's, General Mills, and PepsiCo are driving innovation through product diversification and strategic acquisitions, while smaller companies focus on niche markets and specialized formulations. The European market exhibits regional variations, with Germany, France, the UK, and Italy representing significant consumer bases, presenting opportunities for targeted marketing campaigns. While the market faces potential restraints such as fluctuating raw material prices and increasing competition, the overall outlook remains positive, driven by the continued growth in health and wellness trends.
The growth trajectory of the European energy bar market is likely to be influenced by factors such as evolving consumer preferences (demand for organic, vegan, and gluten-free options), advancements in product technology (improved taste and texture, extended shelf life), and government regulations (labeling and health claims). The competitive landscape is characterized by established multinational corporations and smaller, agile companies focusing on unique product differentiators. Successfully navigating this competitive environment requires companies to invest in research and development, expand their distribution networks, and employ effective marketing strategies targeting specific consumer segments. Furthermore, the sustainability aspect is gaining prominence, prompting manufacturers to prioritize eco-friendly packaging and sourcing practices. The strong growth outlook ensures that the energy bar market will remain a dynamic and attractive sector within the broader European food and beverage industry.
This in-depth report provides a comprehensive analysis of the Energy Bar Market in Europe, covering market size, growth drivers, challenges, key players, and future opportunities. The study period spans from 2019 to 2033, with 2025 serving as the base and estimated year. This report is essential for industry stakeholders, investors, and businesses seeking to understand and capitalize on the growth potential within this dynamic market.
Energy Bar Market in Europe Market Concentration & Innovation
This section analyzes the competitive landscape of the European energy bar market, exploring market concentration, innovation drivers, regulatory frameworks, product substitutes, end-user trends, and M&A activities. The market is characterized by a mix of large multinational corporations and smaller specialized brands. Market share is concentrated among the top players, with the largest companies holding approximately xx% of the market in 2025. However, smaller companies are gaining traction through innovation and niche product offerings. Innovation is driven by consumer demand for healthier, more functional, and sustainable energy bars. Regulatory frameworks, such as those related to food labeling and health claims, significantly impact product development and marketing strategies. The presence of substitute products, such as protein shakes and fruit snacks, poses a competitive challenge. Consumer trends, such as increasing health consciousness and demand for convenience, are key drivers of market growth. Mergers and acquisitions (M&A) activity has been moderate in recent years, with deal values averaging xx Million.
- Market Concentration: Top 5 players hold approximately xx% of market share (2025).
- Innovation Drivers: Healthier ingredients, functional benefits, sustainable packaging.
- Regulatory Frameworks: EU food labeling regulations, health claim approvals.
- Product Substitutes: Protein shakes, fruit snacks, granola bars.
- End-User Trends: Growing health consciousness, demand for convenience.
- M&A Activity: Moderate activity, with average deal values of xx Million (2019-2024). For example, Clif Bar & Company's acquisition of Bioenergy in 2022.
Energy Bar Market in Europe Industry Trends & Insights
The European energy bar market exhibits strong growth potential, driven by several key factors. The market is experiencing a compound annual growth rate (CAGR) of xx% during the forecast period (2025-2033), indicating robust expansion. Market penetration remains relatively high in established markets, but significant opportunities exist in untapped segments and regions. Consumer preferences are shifting towards organic, plant-based, and high-protein options, forcing companies to adapt their product portfolios. Technological advancements, such as improved manufacturing processes and innovative packaging solutions, are enhancing product quality and shelf life. Competitive dynamics are intense, with established players facing challenges from emerging brands offering unique products and marketing strategies. The market is also witnessing increasing focus on sustainability and ethical sourcing, influencing consumer purchasing decisions.
Dominant Markets & Segments in Energy Bar Market in Europe
The United Kingdom currently dominates the European energy bar market, driven by high consumer spending on health and wellness products, along with a well-established retail infrastructure. Germany and France also represent significant markets with substantial growth potential.
By Distribution Channel:
- Supermarkets/Hypermarkets: This channel holds the largest market share, owing to extensive reach and established distribution networks. Key drivers include convenient access and competitive pricing.
- Convenience Stores: This segment offers growth opportunities due to increasing consumer demand for on-the-go snacking options. However, higher prices and limited product variety can be a constraint.
- Specialist Stores: This niche channel caters to consumers seeking high-quality, specialized energy bars, offering premium pricing and specialized products.
- Online Retail Stores: This fast-growing segment is benefiting from increasing online shopping trends and wider product selection, despite potential delivery and logistical challenges.
- Other Distribution Channels: This includes smaller retailers, direct-to-consumer sales, and food service channels. Growth is relatively moderate.
Energy Bar Market in Europe Product Developments
Recent product innovations focus on improved taste, texture, and functionality. There is increasing demand for organic, plant-based, and protein-rich bars. Technological trends like functional ingredients (e.g., probiotics, adaptogens) are shaping product development. Companies are creating bars with specialized features tailored to specific consumer needs and preferences (e.g., gluten-free, vegan, keto-friendly). These innovations enhance market fit and competitive advantage, targeting various health-conscious consumer segments.
Report Scope & Segmentation Analysis
This report segments the European energy bar market by distribution channel:
- Supermarkets/Hypermarkets: Projected to reach xx Million by 2033, with a CAGR of xx%. Competitive landscape is intense due to high market share and established players.
- Convenience Stores: Expected to reach xx Million by 2033, with a CAGR of xx%. Growth is driven by increasing demand for on-the-go snacks.
- Specialist Stores: Projected to reach xx Million by 2033, with a CAGR of xx%. High-quality products and niche consumer segments drive growth.
- Online Retail Stores: Expected to reach xx Million by 2033, with a CAGR of xx%. Rapid growth is fueled by increasing e-commerce adoption.
- Other Distribution Channels: Projected to reach xx Million by 2033, with a CAGR of xx%. This segment encompasses various smaller channels with moderate growth.
Key Drivers of Energy Bar Market in Europe Growth
The growth of the European energy bar market is propelled by several key factors:
- Rising health consciousness: Consumers increasingly prioritize health and wellness, leading to higher demand for nutritious snacks.
- Convenience and portability: Energy bars are convenient and portable, making them ideal for busy lifestyles.
- Increasing disposable incomes: Higher purchasing power allows for increased spending on premium and specialized energy bar products.
- Growing popularity of fitness and sports activities: This boosts the demand for energy bars as a convenient source of fuel.
- Product innovation: Continuous innovation in ingredients, flavors, and formulations drives market expansion.
Challenges in the Energy Bar Market in Europe Sector
The European energy bar market faces several challenges:
- Intense competition: The market is highly competitive, with numerous established and emerging players.
- Fluctuating raw material prices: This impacts production costs and profitability.
- Stringent regulatory requirements: Compliance with various food safety and labeling regulations can be complex and costly.
- Consumer preference shifts: Changing consumer trends and evolving dietary preferences require continuous product adaptation.
- Sustainability concerns: Increasing pressure for sustainable sourcing and eco-friendly packaging.
Emerging Opportunities in Energy Bar Market in Europe
Several emerging opportunities exist within the European energy bar market:
- Growth in plant-based and organic products: Meeting increasing consumer demand for sustainable and ethical options.
- Expansion into new geographical markets: Untapped potential in certain European regions.
- Focus on specialized formulations: Catering to niche consumer segments (e.g., keto, paleo).
- Innovation in functional ingredients: Adding ingredients with health benefits beyond basic nutrition.
- Development of sustainable packaging solutions: Addressing consumer concerns regarding environmental impact.
Leading Players in the Energy Bar Market in Europe Market
- Probar LLC
- The Kellogg Company
- General Mills Inc
- Pepsico Inc
- PowerBar Inc
- QuestNutrition LLC
- Oatein
- Clif Bar & Company
- Nestlé S.A.
- Mars, Incorporated
Key Developments in Energy Bar Market in Europe Industry
- 2022: Clif Bar & Company acquires a majority stake in UK-based Bioenergy, expanding its European presence.
- 2021: Launch of several new vegan and organic energy bar lines by major players.
- 2020: Increased focus on sustainable packaging by key manufacturers.
- 2019: Several mergers and acquisitions among smaller energy bar companies.
Strategic Outlook for Energy Bar Market in Europe Market
The European energy bar market is poised for continued growth, driven by increasing health consciousness, demand for convenient snacks, and ongoing product innovation. Opportunities exist for companies to expand their product portfolios, explore new market segments, and adopt sustainable practices. Strategic partnerships and acquisitions will play a vital role in shaping the market's future landscape. Companies that effectively adapt to evolving consumer preferences and leverage technological advancements will be best positioned for success.
Energy Bar Market in Europe Segmentation
-
1. Distribution Channel
- 1.1. Supermarkets/Hypermarkets
- 1.2. Convenience Stores
- 1.3. Specialist stores
- 1.4. Online Retail Stores
- 1.5. Other Distribution Channels
Energy Bar Market in Europe Segmentation By Geography
-
1. Europe
- 1.1. Spain
- 1.2. United Kingdom
- 1.3. Germany
- 1.4. France
- 1.5. Italy
- 1.6. Russia
- 1.7. Rest of Europe
Energy Bar Market in Europe REPORT HIGHLIGHTS
| Aspects | Details |
|---|---|
| Study Period | 2019-2033 |
| Base Year | 2024 |
| Estimated Year | 2025 |
| Forecast Period | 2025-2033 |
| Historical Period | 2019-2024 |
| Growth Rate | CAGR of 4.80% from 2019-2033 |
| Segmentation |
|
Table of Contents
- 1. Introduction
- 1.1. Research Scope
- 1.2. Market Segmentation
- 1.3. Research Methodology
- 1.4. Definitions and Assumptions
- 2. Executive Summary
- 2.1. Introduction
- 3. Market Dynamics
- 3.1. Introduction
- 3.2. Market Drivers
- 3.2.1. Increasing Demand for Clean Label Ingredients; Growing Health Consciousness of Consumers
- 3.3. Market Restrains
- 3.3.1. Higher Manufacturing Cost
- 3.4. Market Trends
- 3.4.1. United Kingdom Dominating the Market
- 4. Market Factor Analysis
- 4.1. Porters Five Forces
- 4.2. Supply/Value Chain
- 4.3. PESTEL analysis
- 4.4. Market Entropy
- 4.5. Patent/Trademark Analysis
- 5. Energy Bar Market in Europe Analysis, Insights and Forecast, 2019-2031
- 5.1. Market Analysis, Insights and Forecast - by Distribution Channel
- 5.1.1. Supermarkets/Hypermarkets
- 5.1.2. Convenience Stores
- 5.1.3. Specialist stores
- 5.1.4. Online Retail Stores
- 5.1.5. Other Distribution Channels
- 5.2. Market Analysis, Insights and Forecast - by Region
- 5.2.1. Europe
- 5.1. Market Analysis, Insights and Forecast - by Distribution Channel
- 6. Germany Energy Bar Market in Europe Analysis, Insights and Forecast, 2019-2031
- 7. France Energy Bar Market in Europe Analysis, Insights and Forecast, 2019-2031
- 8. Italy Energy Bar Market in Europe Analysis, Insights and Forecast, 2019-2031
- 9. United Kingdom Energy Bar Market in Europe Analysis, Insights and Forecast, 2019-2031
- 10. Netherlands Energy Bar Market in Europe Analysis, Insights and Forecast, 2019-2031
- 11. Sweden Energy Bar Market in Europe Analysis, Insights and Forecast, 2019-2031
- 12. Rest of Europe Energy Bar Market in Europe Analysis, Insights and Forecast, 2019-2031
- 13. Competitive Analysis
- 13.1. Market Share Analysis 2024
- 13.2. Company Profiles
- 13.2.1 Probar LLC
- 13.2.1.1. Overview
- 13.2.1.2. Products
- 13.2.1.3. SWOT Analysis
- 13.2.1.4. Recent Developments
- 13.2.1.5. Financials (Based on Availability)
- 13.2.2 The Kellogg Company
- 13.2.2.1. Overview
- 13.2.2.2. Products
- 13.2.2.3. SWOT Analysis
- 13.2.2.4. Recent Developments
- 13.2.2.5. Financials (Based on Availability)
- 13.2.3 General Mills Inc
- 13.2.3.1. Overview
- 13.2.3.2. Products
- 13.2.3.3. SWOT Analysis
- 13.2.3.4. Recent Developments
- 13.2.3.5. Financials (Based on Availability)
- 13.2.4 Pepsico Inc
- 13.2.4.1. Overview
- 13.2.4.2. Products
- 13.2.4.3. SWOT Analysis
- 13.2.4.4. Recent Developments
- 13.2.4.5. Financials (Based on Availability)
- 13.2.5 PowerBar Inc *List Not Exhaustive
- 13.2.5.1. Overview
- 13.2.5.2. Products
- 13.2.5.3. SWOT Analysis
- 13.2.5.4. Recent Developments
- 13.2.5.5. Financials (Based on Availability)
- 13.2.6 QuestNutrition LLC
- 13.2.6.1. Overview
- 13.2.6.2. Products
- 13.2.6.3. SWOT Analysis
- 13.2.6.4. Recent Developments
- 13.2.6.5. Financials (Based on Availability)
- 13.2.7 Oatein
- 13.2.7.1. Overview
- 13.2.7.2. Products
- 13.2.7.3. SWOT Analysis
- 13.2.7.4. Recent Developments
- 13.2.7.5. Financials (Based on Availability)
- 13.2.8 Clif Bar & Company
- 13.2.8.1. Overview
- 13.2.8.2. Products
- 13.2.8.3. SWOT Analysis
- 13.2.8.4. Recent Developments
- 13.2.8.5. Financials (Based on Availability)
- 13.2.9 Nestlé S.A.
- 13.2.9.1. Overview
- 13.2.9.2. Products
- 13.2.9.3. SWOT Analysis
- 13.2.9.4. Recent Developments
- 13.2.9.5. Financials (Based on Availability)
- 13.2.10 Mars Incorporated
- 13.2.10.1. Overview
- 13.2.10.2. Products
- 13.2.10.3. SWOT Analysis
- 13.2.10.4. Recent Developments
- 13.2.10.5. Financials (Based on Availability)
- 13.2.1 Probar LLC
List of Figures
- Figure 1: Energy Bar Market in Europe Revenue Breakdown (Million, %) by Product 2024 & 2032
- Figure 2: Energy Bar Market in Europe Share (%) by Company 2024
List of Tables
- Table 1: Energy Bar Market in Europe Revenue Million Forecast, by Region 2019 & 2032
- Table 2: Energy Bar Market in Europe Volume K Tons Forecast, by Region 2019 & 2032
- Table 3: Energy Bar Market in Europe Revenue Million Forecast, by Distribution Channel 2019 & 2032
- Table 4: Energy Bar Market in Europe Volume K Tons Forecast, by Distribution Channel 2019 & 2032
- Table 5: Energy Bar Market in Europe Revenue Million Forecast, by Region 2019 & 2032
- Table 6: Energy Bar Market in Europe Volume K Tons Forecast, by Region 2019 & 2032
- Table 7: Energy Bar Market in Europe Revenue Million Forecast, by Country 2019 & 2032
- Table 8: Energy Bar Market in Europe Volume K Tons Forecast, by Country 2019 & 2032
- Table 9: Germany Energy Bar Market in Europe Revenue (Million) Forecast, by Application 2019 & 2032
- Table 10: Germany Energy Bar Market in Europe Volume (K Tons) Forecast, by Application 2019 & 2032
- Table 11: France Energy Bar Market in Europe Revenue (Million) Forecast, by Application 2019 & 2032
- Table 12: France Energy Bar Market in Europe Volume (K Tons) Forecast, by Application 2019 & 2032
- Table 13: Italy Energy Bar Market in Europe Revenue (Million) Forecast, by Application 2019 & 2032
- Table 14: Italy Energy Bar Market in Europe Volume (K Tons) Forecast, by Application 2019 & 2032
- Table 15: United Kingdom Energy Bar Market in Europe Revenue (Million) Forecast, by Application 2019 & 2032
- Table 16: United Kingdom Energy Bar Market in Europe Volume (K Tons) Forecast, by Application 2019 & 2032
- Table 17: Netherlands Energy Bar Market in Europe Revenue (Million) Forecast, by Application 2019 & 2032
- Table 18: Netherlands Energy Bar Market in Europe Volume (K Tons) Forecast, by Application 2019 & 2032
- Table 19: Sweden Energy Bar Market in Europe Revenue (Million) Forecast, by Application 2019 & 2032
- Table 20: Sweden Energy Bar Market in Europe Volume (K Tons) Forecast, by Application 2019 & 2032
- Table 21: Rest of Europe Energy Bar Market in Europe Revenue (Million) Forecast, by Application 2019 & 2032
- Table 22: Rest of Europe Energy Bar Market in Europe Volume (K Tons) Forecast, by Application 2019 & 2032
- Table 23: Energy Bar Market in Europe Revenue Million Forecast, by Distribution Channel 2019 & 2032
- Table 24: Energy Bar Market in Europe Volume K Tons Forecast, by Distribution Channel 2019 & 2032
- Table 25: Energy Bar Market in Europe Revenue Million Forecast, by Country 2019 & 2032
- Table 26: Energy Bar Market in Europe Volume K Tons Forecast, by Country 2019 & 2032
- Table 27: Spain Energy Bar Market in Europe Revenue (Million) Forecast, by Application 2019 & 2032
- Table 28: Spain Energy Bar Market in Europe Volume (K Tons) Forecast, by Application 2019 & 2032
- Table 29: United Kingdom Energy Bar Market in Europe Revenue (Million) Forecast, by Application 2019 & 2032
- Table 30: United Kingdom Energy Bar Market in Europe Volume (K Tons) Forecast, by Application 2019 & 2032
- Table 31: Germany Energy Bar Market in Europe Revenue (Million) Forecast, by Application 2019 & 2032
- Table 32: Germany Energy Bar Market in Europe Volume (K Tons) Forecast, by Application 2019 & 2032
- Table 33: France Energy Bar Market in Europe Revenue (Million) Forecast, by Application 2019 & 2032
- Table 34: France Energy Bar Market in Europe Volume (K Tons) Forecast, by Application 2019 & 2032
- Table 35: Italy Energy Bar Market in Europe Revenue (Million) Forecast, by Application 2019 & 2032
- Table 36: Italy Energy Bar Market in Europe Volume (K Tons) Forecast, by Application 2019 & 2032
- Table 37: Russia Energy Bar Market in Europe Revenue (Million) Forecast, by Application 2019 & 2032
- Table 38: Russia Energy Bar Market in Europe Volume (K Tons) Forecast, by Application 2019 & 2032
- Table 39: Rest of Europe Energy Bar Market in Europe Revenue (Million) Forecast, by Application 2019 & 2032
- Table 40: Rest of Europe Energy Bar Market in Europe Volume (K Tons) Forecast, by Application 2019 & 2032
Frequently Asked Questions
1. What is the projected Compound Annual Growth Rate (CAGR) of the Energy Bar Market in Europe?
The projected CAGR is approximately 4.80%.
2. Which companies are prominent players in the Energy Bar Market in Europe?
Key companies in the market include Probar LLC, The Kellogg Company, General Mills Inc, Pepsico Inc, PowerBar Inc *List Not Exhaustive, QuestNutrition LLC, Oatein, Clif Bar & Company, Nestlé S.A. , Mars, Incorporated.
3. What are the main segments of the Energy Bar Market in Europe?
The market segments include Distribution Channel.
4. Can you provide details about the market size?
The market size is estimated to be USD 1120 Million as of 2022.
5. What are some drivers contributing to market growth?
Increasing Demand for Clean Label Ingredients; Growing Health Consciousness of Consumers.
6. What are the notable trends driving market growth?
United Kingdom Dominating the Market.
7. Are there any restraints impacting market growth?
Higher Manufacturing Cost.
8. Can you provide examples of recent developments in the market?
Recent developments in the Energy Bar Market in Europe include product launches, mergers and acquisitions, and strategic partnerships. For instance, in 2022, Clif Bar & Company acquired a majority stake in UK-based energy bar manufacturer, Bioenergy. This acquisition expanded Clif Bar's presence in the European market and strengthened its product portfolio.
9. What pricing options are available for accessing the report?
Pricing options include single-user, multi-user, and enterprise licenses priced at USD 4750, USD 5250, and USD 8750 respectively.
10. Is the market size provided in terms of value or volume?
The market size is provided in terms of value, measured in Million and volume, measured in K Tons.
11. Are there any specific market keywords associated with the report?
Yes, the market keyword associated with the report is "Energy Bar Market in Europe," which aids in identifying and referencing the specific market segment covered.
12. How do I determine which pricing option suits my needs best?
The pricing options vary based on user requirements and access needs. Individual users may opt for single-user licenses, while businesses requiring broader access may choose multi-user or enterprise licenses for cost-effective access to the report.
13. Are there any additional resources or data provided in the Energy Bar Market in Europe report?
While the report offers comprehensive insights, it's advisable to review the specific contents or supplementary materials provided to ascertain if additional resources or data are available.
14. How can I stay updated on further developments or reports in the Energy Bar Market in Europe?
To stay informed about further developments, trends, and reports in the Energy Bar Market in Europe, consider subscribing to industry newsletters, following relevant companies and organizations, or regularly checking reputable industry news sources and publications.
Methodology
Step 1 - Identification of Relevant Samples Size from Population Database


Step 2 - Approaches for Defining Global Market Size (Value, Volume* & Price*)

Note*: In applicable scenarios
Step 3 - Data Sources
Primary Research
- Web Analytics
- Survey Reports
- Research Institute
- Latest Research Reports
- Opinion Leaders
Secondary Research
- Annual Reports
- White Paper
- Latest Press Release
- Industry Association
- Paid Database
- Investor Presentations

Step 4 - Data Triangulation
Involves using different sources of information in order to increase the validity of a study
These sources are likely to be stakeholders in a program - participants, other researchers, program staff, other community members, and so on.
Then we put all data in single framework & apply various statistical tools to find out the dynamic on the market.
During the analysis stage, feedback from the stakeholder groups would be compared to determine areas of agreement as well as areas of divergence


