
Key Insights
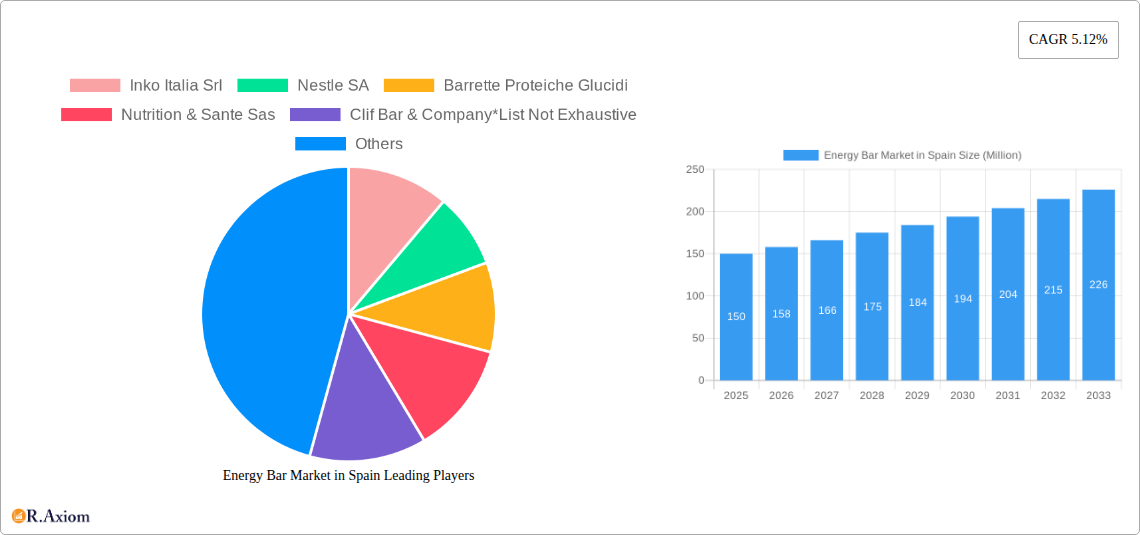
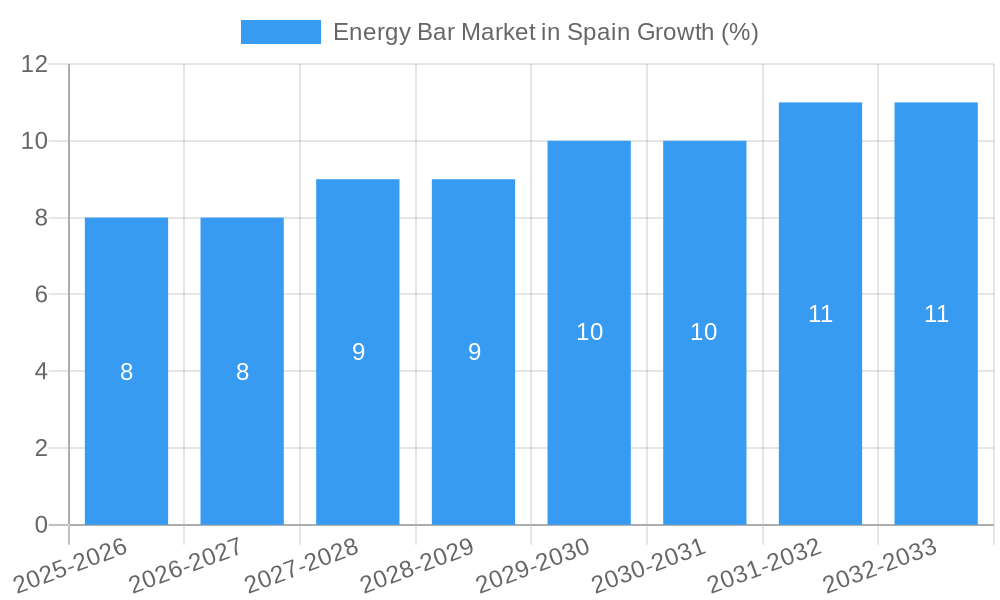
The Spanish energy bar market, valued at approximately €150 million in 2025, is projected to experience robust growth, driven by increasing health consciousness among consumers and the convenience offered by these bars. A compound annual growth rate (CAGR) of 5.12% is anticipated from 2025 to 2033, indicating a significant expansion of the market. This growth is fueled by several key factors. The rising popularity of fitness and active lifestyles is a major driver, with consumers seeking convenient and nutritious energy sources before, during, and after workouts. Furthermore, the increasing availability of organic and specialized energy bars catering to specific dietary needs (e.g., vegan, gluten-free) is expanding the market's appeal. Supermarkets and hypermarkets currently dominate the distribution channels, but the online retail segment is experiencing significant growth, reflecting the broader shift towards e-commerce in Spain. However, challenges remain. Price sensitivity among consumers and the potential for increased competition from similar convenient snack options could act as restraints on market growth. The market is segmented by type (organic and conventional) and distribution channel (supermarkets/hypermarkets, convenience stores, specialist retailers, online retail, and others). Key players like Nestle SA, Inko Italia Srl, and Clif Bar & Company are actively competing in this dynamic market, constantly innovating to meet evolving consumer preferences. The forecast period of 2025-2033 suggests a promising outlook for energy bar manufacturers who can adapt to these trends and cater to the specific needs and preferences of the Spanish consumer.
The sustained growth in the Spanish energy bar market is anticipated to be further influenced by government initiatives promoting healthy eating habits and the increasing awareness of the role of nutrition in overall well-being. The competitive landscape, characterized by both established international players and local brands, will continue to drive innovation and product differentiation. The focus on sustainable and ethically sourced ingredients is also becoming increasingly important to consumers, prompting manufacturers to adopt eco-friendly practices and transparent supply chains. The expansion into niche markets, such as bars designed for specific sports or dietary restrictions, presents substantial opportunities for growth. The increasing adoption of personalized nutrition plans and the growth of the health and wellness sector further contribute to the positive outlook for the energy bar market in Spain.
Energy Bar Market in Spain: A Comprehensive Market Analysis (2019-2033)
This comprehensive report provides an in-depth analysis of the Energy Bar market in Spain, covering market size, segmentation, growth drivers, challenges, and opportunities from 2019 to 2033. The report offers invaluable insights for industry stakeholders, including manufacturers, distributors, investors, and market researchers. With a focus on key trends and competitive dynamics, this report is an essential resource for understanding and navigating the evolving landscape of the Spanish energy bar market.
Energy Bar Market in Spain Market Concentration & Innovation
The Spanish energy bar market exhibits a moderately concentrated structure, with key players like Nestlé SA and Clif Bar & Company holding significant market share. However, the presence of numerous smaller, regional players, such as Inko Italia Srl, Barrette Proteiche Glucidi, and Nutrition & Sante Sas, indicates a competitive landscape. Market share data for 2024 estimates Nestlé SA at approximately 25%, while Clif Bar & Company holds around 10%. The remaining share is distributed among other players, including Enervit and Abbott. Innovation in the sector is driven by consumer demand for healthier, more functional products, including organic options and bars with specific nutritional benefits (e.g., high protein, low sugar). Regulatory frameworks concerning labeling and food safety significantly impact product development and marketing. The market also sees a notable presence of product substitutes, including fruit snacks and protein shakes, constantly influencing market share. Recent M&A activity has been limited, with an estimated total deal value of approximately €xx Million in the past five years, but the possibility of consolidation remains high. End-user trends show a growing preference for convenient, portable, and healthy snacks, which is bolstering market growth.
Energy Bar Market in Spain Industry Trends & Insights
The Spanish energy bar market has experienced consistent growth over the past few years, with a Compound Annual Growth Rate (CAGR) of approximately 5% during the historical period (2019-2024). This growth is primarily fueled by increasing health consciousness among consumers, coupled with a rise in active lifestyles and demand for convenient snacking options. Market penetration is estimated at xx% in 2025, with significant growth potential, especially in online retail channels. Technological advancements in food processing and packaging are enhancing product quality and shelf life. Consumer preferences are shifting toward organic, gluten-free, and vegan options, driving innovation within the segment. Competitive dynamics are largely shaped by pricing strategies, brand loyalty, and product differentiation. The estimated market size in 2025 is €xx Million, projected to reach €xx Million by 2033. The key growth drivers include rising disposable incomes, increasing urbanization, and the expanding fitness and sports sector.
Dominant Markets & Segments in Energy Bar Market in Spain
The Spanish energy bar market shows significant dominance in the urban regions, driven by higher disposable incomes and health-conscious populations. The supermarkets/hypermarkets distribution channel holds the largest market share, accounting for approximately 60% of total sales. This segment’s dominance stems from the wide reach of large retailers and the convenient accessibility of energy bars in these outlets.
- By Type: The conventional energy bar segment holds the majority market share, although the organic segment is witnessing significant growth, driven by increasing demand for natural and sustainable products.
- By Distribution Channel:
- Supermarkets/Hypermarkets: Wide reach, established infrastructure, and strong brand presence contribute to this segment's dominance.
- Convenience Stores: Offer convenience for on-the-go consumption, though their contribution to overall sales is relatively smaller.
- Specialist Retailers: Niche players offering specialized products, such as organic or functional energy bars, capture a small but growing market segment.
- Online Retail: Shows strong growth potential, benefiting from increasing e-commerce adoption and convenience.
- Other Distribution Channels: Including gyms, fitness centers, and online retailers specialized in sports nutrition.
Energy Bar Market in Spain Product Developments
Recent product innovations focus on enhancing taste, texture, and nutritional value. The market is witnessing an increasing number of energy bars with added functional ingredients, such as probiotics, collagen, and adaptogens, catering to specific health needs. Technological advancements, such as improved processing techniques and sustainable packaging, are also contributing to product development. The introduction of convenient formats, like single-serving packs, is also driving market growth. This aligns perfectly with the increasing demand for healthy and convenient on-the-go snacking options, ensuring strong market fit.
Report Scope & Segmentation Analysis
This report segments the Spanish energy bar market based on type (organic, conventional) and distribution channel (supermarkets/hypermarkets, convenience stores, specialist retailers, online retail, other). Each segment is analyzed in detail, providing insights into market size, growth projections, and competitive dynamics.
- By Type: The organic segment is anticipated to grow at a faster rate than the conventional segment due to changing consumer preferences toward healthier and sustainable products.
- By Distribution Channel: The online retail channel is projected to witness high growth driven by the rising popularity of e-commerce. Growth in the online sector also presents many challenges, such as fulfillment and delivery.
Key Drivers of Energy Bar Market in Spain Growth
The growth of the energy bar market in Spain is driven by several factors: The rising awareness of health and wellness, increasing disposable incomes, growing popularity of fitness and sports activities, and the trend toward convenient snacking. Furthermore, government initiatives promoting healthy eating habits and the rise of online retail channels all positively contribute to market growth.
Challenges in the Energy Bar Market in Spain Sector
The sector faces challenges including intense competition from established players and new entrants, fluctuations in raw material prices impacting profitability, and stringent regulatory frameworks regarding labeling and food safety. Supply chain disruptions can also lead to stockouts and affect sales. These factors collectively restrict market expansion.
Emerging Opportunities in Energy Bar Market in Spain
Emerging opportunities lie in the growing demand for functional energy bars with added health benefits, the expansion of online retail channels, and the potential to tap into niche markets with specialized products. Furthermore, focusing on sustainable and eco-friendly packaging presents a key opportunity for differentiation and market growth.
Leading Players in the Energy Bar Market in Spain Market
- Inko Italia Srl
- Nestlé SA
- Barrette Proteiche Glucidi
- Nutrition & Sante Sas
- Clif Bar & Company
- Enervit
- Abbott
Key Developments in Energy Bar Market in Spain Industry
- 2022 Q4: Nestlé SA launches a new range of organic energy bars.
- 2023 Q1: Clif Bar & Company expands its distribution network in Spain.
- 2024 Q2: A new entrant launches a line of vegan energy bars targeting a specific health-conscious niche. (Further details on other developments are unavailable for public access).
Strategic Outlook for Energy Bar Market in Spain Market
The Spanish energy bar market holds significant growth potential driven by continued health consciousness among consumers and the expansion of convenient and functional product options. Companies with a strong focus on innovation, sustainable practices, and strategic distribution channels are poised for success in this dynamic market. The increasing adoption of e-commerce presents lucrative opportunities. However, navigating the challenges presented by competition and fluctuating raw material prices will be crucial for sustained growth.
Energy Bar Market in Spain Segmentation
-
1. Type
- 1.1. Organic
- 1.2. Conventional
-
2. Distribution Channel
- 2.1. Supermarkets/Hypermarkets
- 2.2. Convenience Stores
- 2.3. Specialist Retailers
- 2.4. Online Retail
- 2.5. Other Distribution Channels
Energy Bar Market in Spain Segmentation By Geography
-
1. North America
- 1.1. United States
- 1.2. Canada
- 1.3. Mexico
-
2. South America
- 2.1. Brazil
- 2.2. Argentina
- 2.3. Rest of South America
-
3. Europe
- 3.1. United Kingdom
- 3.2. Germany
- 3.3. France
- 3.4. Italy
- 3.5. Spain
- 3.6. Russia
- 3.7. Benelux
- 3.8. Nordics
- 3.9. Rest of Europe
-
4. Middle East & Africa
- 4.1. Turkey
- 4.2. Israel
- 4.3. GCC
- 4.4. North Africa
- 4.5. South Africa
- 4.6. Rest of Middle East & Africa
-
5. Asia Pacific
- 5.1. China
- 5.2. India
- 5.3. Japan
- 5.4. South Korea
- 5.5. ASEAN
- 5.6. Oceania
- 5.7. Rest of Asia Pacific
Energy Bar Market in Spain REPORT HIGHLIGHTS
| Aspects | Details |
|---|---|
| Study Period | 2019-2033 |
| Base Year | 2024 |
| Estimated Year | 2025 |
| Forecast Period | 2025-2033 |
| Historical Period | 2019-2024 |
| Growth Rate | CAGR of 5.12% from 2019-2033 |
| Segmentation |
|
Table of Contents
- 1. Introduction
- 1.1. Research Scope
- 1.2. Market Segmentation
- 1.3. Research Methodology
- 1.4. Definitions and Assumptions
- 2. Executive Summary
- 2.1. Introduction
- 3. Market Dynamics
- 3.1. Introduction
- 3.2. Market Drivers
- 3.2.1. Increasing Consumer Demand for Products with Low Environmental Impacts; Dedicated Policies and Government Efforts to Promote the use of Biotechnology
- 3.3. Market Restrains
- 3.3.1. Deteriorating Fertility of Agricultural Lands
- 3.4. Market Trends
- 3.4.1. Rising Healthy Snacking Trend
- 4. Market Factor Analysis
- 4.1. Porters Five Forces
- 4.2. Supply/Value Chain
- 4.3. PESTEL analysis
- 4.4. Market Entropy
- 4.5. Patent/Trademark Analysis
- 5. Global Energy Bar Market in Spain Analysis, Insights and Forecast, 2019-2031
- 5.1. Market Analysis, Insights and Forecast - by Type
- 5.1.1. Organic
- 5.1.2. Conventional
- 5.2. Market Analysis, Insights and Forecast - by Distribution Channel
- 5.2.1. Supermarkets/Hypermarkets
- 5.2.2. Convenience Stores
- 5.2.3. Specialist Retailers
- 5.2.4. Online Retail
- 5.2.5. Other Distribution Channels
- 5.3. Market Analysis, Insights and Forecast - by Region
- 5.3.1. North America
- 5.3.2. South America
- 5.3.3. Europe
- 5.3.4. Middle East & Africa
- 5.3.5. Asia Pacific
- 5.1. Market Analysis, Insights and Forecast - by Type
- 6. North America Energy Bar Market in Spain Analysis, Insights and Forecast, 2019-2031
- 6.1. Market Analysis, Insights and Forecast - by Type
- 6.1.1. Organic
- 6.1.2. Conventional
- 6.2. Market Analysis, Insights and Forecast - by Distribution Channel
- 6.2.1. Supermarkets/Hypermarkets
- 6.2.2. Convenience Stores
- 6.2.3. Specialist Retailers
- 6.2.4. Online Retail
- 6.2.5. Other Distribution Channels
- 6.1. Market Analysis, Insights and Forecast - by Type
- 7. South America Energy Bar Market in Spain Analysis, Insights and Forecast, 2019-2031
- 7.1. Market Analysis, Insights and Forecast - by Type
- 7.1.1. Organic
- 7.1.2. Conventional
- 7.2. Market Analysis, Insights and Forecast - by Distribution Channel
- 7.2.1. Supermarkets/Hypermarkets
- 7.2.2. Convenience Stores
- 7.2.3. Specialist Retailers
- 7.2.4. Online Retail
- 7.2.5. Other Distribution Channels
- 7.1. Market Analysis, Insights and Forecast - by Type
- 8. Europe Energy Bar Market in Spain Analysis, Insights and Forecast, 2019-2031
- 8.1. Market Analysis, Insights and Forecast - by Type
- 8.1.1. Organic
- 8.1.2. Conventional
- 8.2. Market Analysis, Insights and Forecast - by Distribution Channel
- 8.2.1. Supermarkets/Hypermarkets
- 8.2.2. Convenience Stores
- 8.2.3. Specialist Retailers
- 8.2.4. Online Retail
- 8.2.5. Other Distribution Channels
- 8.1. Market Analysis, Insights and Forecast - by Type
- 9. Middle East & Africa Energy Bar Market in Spain Analysis, Insights and Forecast, 2019-2031
- 9.1. Market Analysis, Insights and Forecast - by Type
- 9.1.1. Organic
- 9.1.2. Conventional
- 9.2. Market Analysis, Insights and Forecast - by Distribution Channel
- 9.2.1. Supermarkets/Hypermarkets
- 9.2.2. Convenience Stores
- 9.2.3. Specialist Retailers
- 9.2.4. Online Retail
- 9.2.5. Other Distribution Channels
- 9.1. Market Analysis, Insights and Forecast - by Type
- 10. Asia Pacific Energy Bar Market in Spain Analysis, Insights and Forecast, 2019-2031
- 10.1. Market Analysis, Insights and Forecast - by Type
- 10.1.1. Organic
- 10.1.2. Conventional
- 10.2. Market Analysis, Insights and Forecast - by Distribution Channel
- 10.2.1. Supermarkets/Hypermarkets
- 10.2.2. Convenience Stores
- 10.2.3. Specialist Retailers
- 10.2.4. Online Retail
- 10.2.5. Other Distribution Channels
- 10.1. Market Analysis, Insights and Forecast - by Type
- 11. Competitive Analysis
- 11.1. Global Market Share Analysis 2024
- 11.2. Company Profiles
- 11.2.1 Inko Italia Srl
- 11.2.1.1. Overview
- 11.2.1.2. Products
- 11.2.1.3. SWOT Analysis
- 11.2.1.4. Recent Developments
- 11.2.1.5. Financials (Based on Availability)
- 11.2.2 Nestle SA
- 11.2.2.1. Overview
- 11.2.2.2. Products
- 11.2.2.3. SWOT Analysis
- 11.2.2.4. Recent Developments
- 11.2.2.5. Financials (Based on Availability)
- 11.2.3 Barrette Proteiche Glucidi
- 11.2.3.1. Overview
- 11.2.3.2. Products
- 11.2.3.3. SWOT Analysis
- 11.2.3.4. Recent Developments
- 11.2.3.5. Financials (Based on Availability)
- 11.2.4 Nutrition & Sante Sas
- 11.2.4.1. Overview
- 11.2.4.2. Products
- 11.2.4.3. SWOT Analysis
- 11.2.4.4. Recent Developments
- 11.2.4.5. Financials (Based on Availability)
- 11.2.5 Clif Bar & Company*List Not Exhaustive
- 11.2.5.1. Overview
- 11.2.5.2. Products
- 11.2.5.3. SWOT Analysis
- 11.2.5.4. Recent Developments
- 11.2.5.5. Financials (Based on Availability)
- 11.2.6 Enervit
- 11.2.6.1. Overview
- 11.2.6.2. Products
- 11.2.6.3. SWOT Analysis
- 11.2.6.4. Recent Developments
- 11.2.6.5. Financials (Based on Availability)
- 11.2.7 Abbott
- 11.2.7.1. Overview
- 11.2.7.2. Products
- 11.2.7.3. SWOT Analysis
- 11.2.7.4. Recent Developments
- 11.2.7.5. Financials (Based on Availability)
- 11.2.1 Inko Italia Srl
List of Figures
- Figure 1: Global Energy Bar Market in Spain Revenue Breakdown (Million, %) by Region 2024 & 2032
- Figure 2: Spain Energy Bar Market in Spain Revenue (Million), by Country 2024 & 2032
- Figure 3: Spain Energy Bar Market in Spain Revenue Share (%), by Country 2024 & 2032
- Figure 4: North America Energy Bar Market in Spain Revenue (Million), by Type 2024 & 2032
- Figure 5: North America Energy Bar Market in Spain Revenue Share (%), by Type 2024 & 2032
- Figure 6: North America Energy Bar Market in Spain Revenue (Million), by Distribution Channel 2024 & 2032
- Figure 7: North America Energy Bar Market in Spain Revenue Share (%), by Distribution Channel 2024 & 2032
- Figure 8: North America Energy Bar Market in Spain Revenue (Million), by Country 2024 & 2032
- Figure 9: North America Energy Bar Market in Spain Revenue Share (%), by Country 2024 & 2032
- Figure 10: South America Energy Bar Market in Spain Revenue (Million), by Type 2024 & 2032
- Figure 11: South America Energy Bar Market in Spain Revenue Share (%), by Type 2024 & 2032
- Figure 12: South America Energy Bar Market in Spain Revenue (Million), by Distribution Channel 2024 & 2032
- Figure 13: South America Energy Bar Market in Spain Revenue Share (%), by Distribution Channel 2024 & 2032
- Figure 14: South America Energy Bar Market in Spain Revenue (Million), by Country 2024 & 2032
- Figure 15: South America Energy Bar Market in Spain Revenue Share (%), by Country 2024 & 2032
- Figure 16: Europe Energy Bar Market in Spain Revenue (Million), by Type 2024 & 2032
- Figure 17: Europe Energy Bar Market in Spain Revenue Share (%), by Type 2024 & 2032
- Figure 18: Europe Energy Bar Market in Spain Revenue (Million), by Distribution Channel 2024 & 2032
- Figure 19: Europe Energy Bar Market in Spain Revenue Share (%), by Distribution Channel 2024 & 2032
- Figure 20: Europe Energy Bar Market in Spain Revenue (Million), by Country 2024 & 2032
- Figure 21: Europe Energy Bar Market in Spain Revenue Share (%), by Country 2024 & 2032
- Figure 22: Middle East & Africa Energy Bar Market in Spain Revenue (Million), by Type 2024 & 2032
- Figure 23: Middle East & Africa Energy Bar Market in Spain Revenue Share (%), by Type 2024 & 2032
- Figure 24: Middle East & Africa Energy Bar Market in Spain Revenue (Million), by Distribution Channel 2024 & 2032
- Figure 25: Middle East & Africa Energy Bar Market in Spain Revenue Share (%), by Distribution Channel 2024 & 2032
- Figure 26: Middle East & Africa Energy Bar Market in Spain Revenue (Million), by Country 2024 & 2032
- Figure 27: Middle East & Africa Energy Bar Market in Spain Revenue Share (%), by Country 2024 & 2032
- Figure 28: Asia Pacific Energy Bar Market in Spain Revenue (Million), by Type 2024 & 2032
- Figure 29: Asia Pacific Energy Bar Market in Spain Revenue Share (%), by Type 2024 & 2032
- Figure 30: Asia Pacific Energy Bar Market in Spain Revenue (Million), by Distribution Channel 2024 & 2032
- Figure 31: Asia Pacific Energy Bar Market in Spain Revenue Share (%), by Distribution Channel 2024 & 2032
- Figure 32: Asia Pacific Energy Bar Market in Spain Revenue (Million), by Country 2024 & 2032
- Figure 33: Asia Pacific Energy Bar Market in Spain Revenue Share (%), by Country 2024 & 2032
List of Tables
- Table 1: Global Energy Bar Market in Spain Revenue Million Forecast, by Region 2019 & 2032
- Table 2: Global Energy Bar Market in Spain Revenue Million Forecast, by Type 2019 & 2032
- Table 3: Global Energy Bar Market in Spain Revenue Million Forecast, by Distribution Channel 2019 & 2032
- Table 4: Global Energy Bar Market in Spain Revenue Million Forecast, by Region 2019 & 2032
- Table 5: Global Energy Bar Market in Spain Revenue Million Forecast, by Country 2019 & 2032
- Table 6: Global Energy Bar Market in Spain Revenue Million Forecast, by Type 2019 & 2032
- Table 7: Global Energy Bar Market in Spain Revenue Million Forecast, by Distribution Channel 2019 & 2032
- Table 8: Global Energy Bar Market in Spain Revenue Million Forecast, by Country 2019 & 2032
- Table 9: United States Energy Bar Market in Spain Revenue (Million) Forecast, by Application 2019 & 2032
- Table 10: Canada Energy Bar Market in Spain Revenue (Million) Forecast, by Application 2019 & 2032
- Table 11: Mexico Energy Bar Market in Spain Revenue (Million) Forecast, by Application 2019 & 2032
- Table 12: Global Energy Bar Market in Spain Revenue Million Forecast, by Type 2019 & 2032
- Table 13: Global Energy Bar Market in Spain Revenue Million Forecast, by Distribution Channel 2019 & 2032
- Table 14: Global Energy Bar Market in Spain Revenue Million Forecast, by Country 2019 & 2032
- Table 15: Brazil Energy Bar Market in Spain Revenue (Million) Forecast, by Application 2019 & 2032
- Table 16: Argentina Energy Bar Market in Spain Revenue (Million) Forecast, by Application 2019 & 2032
- Table 17: Rest of South America Energy Bar Market in Spain Revenue (Million) Forecast, by Application 2019 & 2032
- Table 18: Global Energy Bar Market in Spain Revenue Million Forecast, by Type 2019 & 2032
- Table 19: Global Energy Bar Market in Spain Revenue Million Forecast, by Distribution Channel 2019 & 2032
- Table 20: Global Energy Bar Market in Spain Revenue Million Forecast, by Country 2019 & 2032
- Table 21: United Kingdom Energy Bar Market in Spain Revenue (Million) Forecast, by Application 2019 & 2032
- Table 22: Germany Energy Bar Market in Spain Revenue (Million) Forecast, by Application 2019 & 2032
- Table 23: France Energy Bar Market in Spain Revenue (Million) Forecast, by Application 2019 & 2032
- Table 24: Italy Energy Bar Market in Spain Revenue (Million) Forecast, by Application 2019 & 2032
- Table 25: Spain Energy Bar Market in Spain Revenue (Million) Forecast, by Application 2019 & 2032
- Table 26: Russia Energy Bar Market in Spain Revenue (Million) Forecast, by Application 2019 & 2032
- Table 27: Benelux Energy Bar Market in Spain Revenue (Million) Forecast, by Application 2019 & 2032
- Table 28: Nordics Energy Bar Market in Spain Revenue (Million) Forecast, by Application 2019 & 2032
- Table 29: Rest of Europe Energy Bar Market in Spain Revenue (Million) Forecast, by Application 2019 & 2032
- Table 30: Global Energy Bar Market in Spain Revenue Million Forecast, by Type 2019 & 2032
- Table 31: Global Energy Bar Market in Spain Revenue Million Forecast, by Distribution Channel 2019 & 2032
- Table 32: Global Energy Bar Market in Spain Revenue Million Forecast, by Country 2019 & 2032
- Table 33: Turkey Energy Bar Market in Spain Revenue (Million) Forecast, by Application 2019 & 2032
- Table 34: Israel Energy Bar Market in Spain Revenue (Million) Forecast, by Application 2019 & 2032
- Table 35: GCC Energy Bar Market in Spain Revenue (Million) Forecast, by Application 2019 & 2032
- Table 36: North Africa Energy Bar Market in Spain Revenue (Million) Forecast, by Application 2019 & 2032
- Table 37: South Africa Energy Bar Market in Spain Revenue (Million) Forecast, by Application 2019 & 2032
- Table 38: Rest of Middle East & Africa Energy Bar Market in Spain Revenue (Million) Forecast, by Application 2019 & 2032
- Table 39: Global Energy Bar Market in Spain Revenue Million Forecast, by Type 2019 & 2032
- Table 40: Global Energy Bar Market in Spain Revenue Million Forecast, by Distribution Channel 2019 & 2032
- Table 41: Global Energy Bar Market in Spain Revenue Million Forecast, by Country 2019 & 2032
- Table 42: China Energy Bar Market in Spain Revenue (Million) Forecast, by Application 2019 & 2032
- Table 43: India Energy Bar Market in Spain Revenue (Million) Forecast, by Application 2019 & 2032
- Table 44: Japan Energy Bar Market in Spain Revenue (Million) Forecast, by Application 2019 & 2032
- Table 45: South Korea Energy Bar Market in Spain Revenue (Million) Forecast, by Application 2019 & 2032
- Table 46: ASEAN Energy Bar Market in Spain Revenue (Million) Forecast, by Application 2019 & 2032
- Table 47: Oceania Energy Bar Market in Spain Revenue (Million) Forecast, by Application 2019 & 2032
- Table 48: Rest of Asia Pacific Energy Bar Market in Spain Revenue (Million) Forecast, by Application 2019 & 2032
Frequently Asked Questions
1. What is the projected Compound Annual Growth Rate (CAGR) of the Energy Bar Market in Spain?
The projected CAGR is approximately 5.12%.
2. Which companies are prominent players in the Energy Bar Market in Spain?
Key companies in the market include Inko Italia Srl, Nestle SA, Barrette Proteiche Glucidi, Nutrition & Sante Sas, Clif Bar & Company*List Not Exhaustive, Enervit, Abbott.
3. What are the main segments of the Energy Bar Market in Spain?
The market segments include Type, Distribution Channel.
4. Can you provide details about the market size?
The market size is estimated to be USD XX Million as of 2022.
5. What are some drivers contributing to market growth?
Increasing Consumer Demand for Products with Low Environmental Impacts; Dedicated Policies and Government Efforts to Promote the use of Biotechnology.
6. What are the notable trends driving market growth?
Rising Healthy Snacking Trend.
7. Are there any restraints impacting market growth?
Deteriorating Fertility of Agricultural Lands.
8. Can you provide examples of recent developments in the market?
N/A
9. What pricing options are available for accessing the report?
Pricing options include single-user, multi-user, and enterprise licenses priced at USD 3800, USD 4500, and USD 5800 respectively.
10. Is the market size provided in terms of value or volume?
The market size is provided in terms of value, measured in Million.
11. Are there any specific market keywords associated with the report?
Yes, the market keyword associated with the report is "Energy Bar Market in Spain," which aids in identifying and referencing the specific market segment covered.
12. How do I determine which pricing option suits my needs best?
The pricing options vary based on user requirements and access needs. Individual users may opt for single-user licenses, while businesses requiring broader access may choose multi-user or enterprise licenses for cost-effective access to the report.
13. Are there any additional resources or data provided in the Energy Bar Market in Spain report?
While the report offers comprehensive insights, it's advisable to review the specific contents or supplementary materials provided to ascertain if additional resources or data are available.
14. How can I stay updated on further developments or reports in the Energy Bar Market in Spain?
To stay informed about further developments, trends, and reports in the Energy Bar Market in Spain, consider subscribing to industry newsletters, following relevant companies and organizations, or regularly checking reputable industry news sources and publications.
Methodology
Step 1 - Identification of Relevant Samples Size from Population Database


Step 2 - Approaches for Defining Global Market Size (Value, Volume* & Price*)

Note*: In applicable scenarios
Step 3 - Data Sources
Primary Research
- Web Analytics
- Survey Reports
- Research Institute
- Latest Research Reports
- Opinion Leaders
Secondary Research
- Annual Reports
- White Paper
- Latest Press Release
- Industry Association
- Paid Database
- Investor Presentations

Step 4 - Data Triangulation
Involves using different sources of information in order to increase the validity of a study
These sources are likely to be stakeholders in a program - participants, other researchers, program staff, other community members, and so on.
Then we put all data in single framework & apply various statistical tools to find out the dynamic on the market.
During the analysis stage, feedback from the stakeholder groups would be compared to determine areas of agreement as well as areas of divergence


