

Key Insights
The European mass spectrometry market, valued at approximately $1.9 billion in 2025, is poised for substantial growth. This expansion is fueled by the escalating demand for advanced analytical solutions within the pharmaceutical and biotechnology sectors. Innovations in hybrid mass spectrometry and Fourier Transform Mass Spectrometry (FTMS) are key drivers, offering enhanced precision and efficiency in analyzing complex biological and chemical compounds. The pharmaceutical industry's commitment to drug discovery and development, alongside the increasing incidence of chronic diseases, significantly propels market advancement. Furthermore, stringent regulatory mandates for drug quality assurance and safety necessitate the adoption of sophisticated analytical instruments like mass spectrometers, thereby increasing market penetration. Germany, France, and the United Kingdom are anticipated to lead the European market, attributed to their robust research infrastructure and the presence of leading pharmaceutical and biotechnology enterprises.
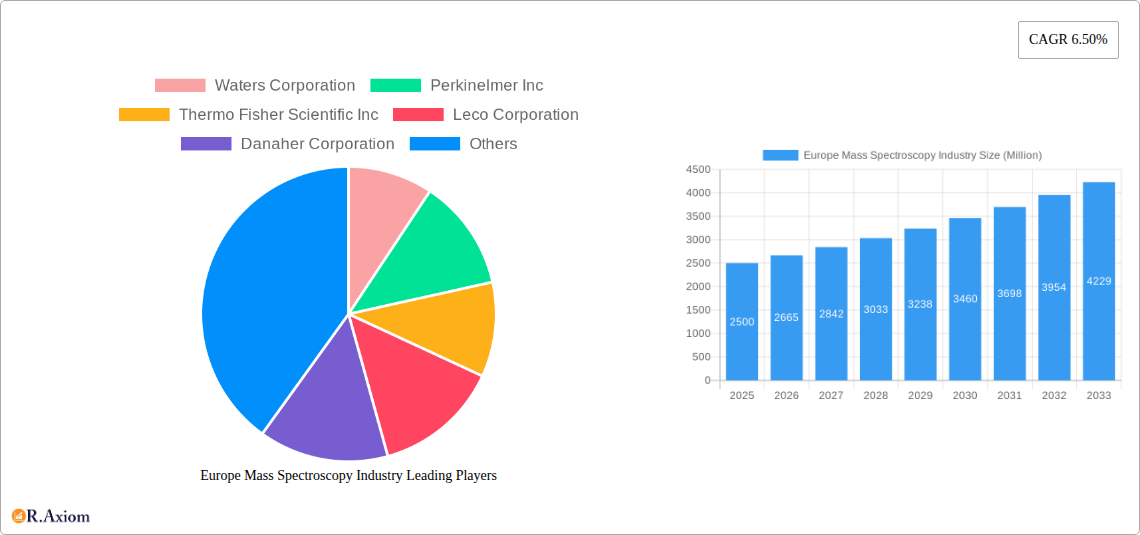
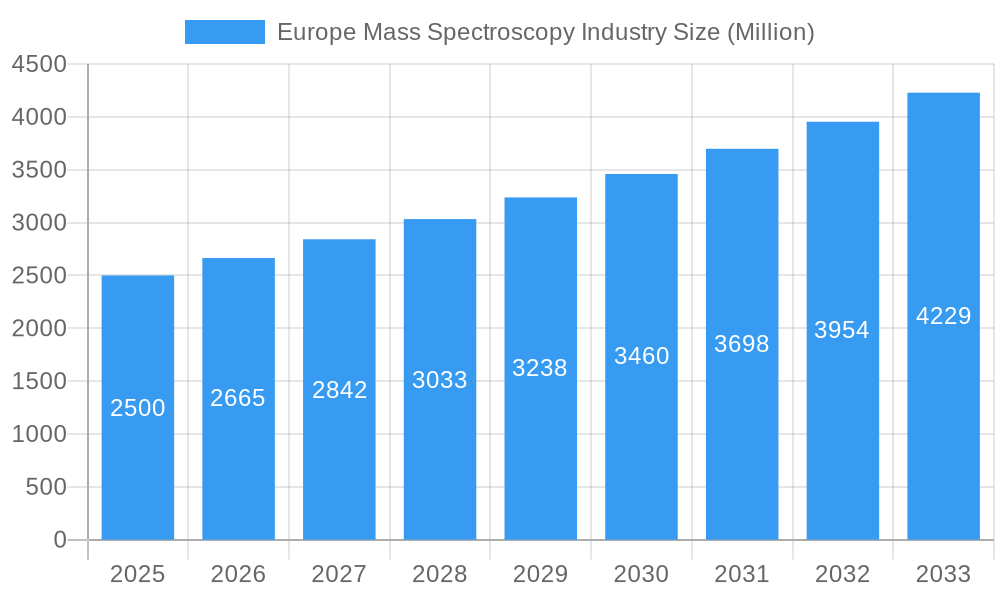
Europe Mass Spectroscopy Industry Market Size (In Billion)
The market is, however, subject to certain limitations. The considerable expense of mass spectrometers and the requirement for highly skilled operators present accessibility challenges, particularly for smaller organizations. The emergence of alternative analytical methodologies may also pose a competitive challenge in specific applications. Notwithstanding these factors, the market trajectory remains optimistic. Ongoing development of more compact, intuitive, and cost-effective mass spectrometry systems is expected to address these constraints and stimulate further market expansion throughout the forecast period. The projected Compound Annual Growth Rate (CAGR) of 6.4% signifies a stable and considerable growth trend for the European mass spectrometry market.
Europe Mass Spectroscopy Industry Company Market Share
Europe Mass Spectroscopy Industry Market Report: 2019-2033
This comprehensive report provides an in-depth analysis of the Europe Mass Spectroscopy industry, covering market size, growth drivers, competitive landscape, and future outlook from 2019 to 2033. The study period is 2019-2033, with 2025 as the base and estimated year. The forecast period is 2025-2033, and the historical period is 2019-2024. Key players analyzed include Waters Corporation, Perkinelmer Inc, Thermo Fisher Scientific Inc, Leco Corporation, Danaher Corporation, Agilent Technologies Inc, Dani Instruments SpA, Bruker Corporation, and Shimadzu Corporation. Market segmentation includes Technology (Hybrid Mass Spectrometry, FTMS, Time-of-flight, Other), and Application (Pharmaceuticals, Biotechnology, Chemical, Other).
Europe Mass Spectroscopy Industry Market Concentration & Innovation
The European mass spectrometry market exhibits a moderately concentrated landscape, with a few major players holding significant market share. The exact market share distribution for 2025 is currently being finalized but preliminary data suggests Thermo Fisher Scientific Inc and Agilent Technologies Inc hold the largest shares, followed closely by Waters Corporation and Bruker Corporation. Market concentration is influenced by factors such as high R&D investments, economies of scale, and stringent regulatory requirements. Innovation is a key driver, with companies continually developing advanced technologies like hybrid mass spectrometry and FTMS to improve sensitivity, resolution, and speed of analysis. The regulatory framework, particularly concerning healthcare and environmental regulations, significantly impacts market growth and product development. The market is witnessing a growing preference for sophisticated instruments, driving the demand for hybrid and advanced mass spectrometry systems. Furthermore, mergers and acquisitions (M&A) activities are prevalent, with recent deals exceeding xx Million in value, highlighting the strategic importance of this market segment. Examples of significant M&A activity include the April 2022 acquisition of IonSense by Bruker Corporation. This activity fuels innovation and expands market presence for acquiring companies.
- Market Share (2025 Estimate): Thermo Fisher Scientific Inc (xx%), Agilent Technologies Inc (xx%), Waters Corporation (xx%), Bruker Corporation (xx%), Others (xx%).
- M&A Deal Value (2019-2024): xx Million
- Key Innovation Drivers: Hybrid mass spectrometry, FTMS advancements, miniaturization, improved software analytics.
Europe Mass Spectroscopy Industry Industry Trends & Insights
The Europe mass spectrometry market is experiencing robust growth, driven by increasing demand from various end-use industries. The pharmaceutical and biotechnology sectors are key drivers, fueled by advancements in drug discovery and development, proteomics research, and personalized medicine. The chemical industry also contributes significantly, with applications in environmental monitoring, material science, and food safety. The market's CAGR from 2025 to 2033 is projected to be xx%, driven by technological advancements, increasing research funding, and rising regulatory scrutiny. Market penetration is highest in Western European countries with advanced scientific infrastructure, while Eastern Europe demonstrates significant growth potential due to increasing investments in research and healthcare. Competitive dynamics are shaped by technological innovation, product differentiation, and strategic partnerships. The market is witnessing the growing adoption of advanced analytical techniques such as ambient ionization and increased focus on providing integrated solutions including instruments, software, and services. Consumer preferences are shifting towards user-friendly, high-throughput systems with improved data analysis capabilities.
Dominant Markets & Segments in Europe Mass Spectroscopy Industry
- Leading Region: Western Europe (Germany, UK, France) accounts for the largest market share.
- Dominant Technology Segment: Hybrid mass spectrometry holds the largest segment share due to its versatility and superior performance.
- Leading Application Segment: The pharmaceutical industry is the largest application area, primarily because of its critical role in drug development and quality control.
Key Drivers of Market Dominance:
- Germany: Strong pharmaceutical and biotechnology industries, substantial R&D investments, advanced infrastructure, and favorable regulatory environment.
- UK: Well-established scientific research base, robust healthcare sector, and significant government funding for research and development.
- France: Growing biotechnology sector, focus on personalized medicine, and increasing adoption of advanced analytical techniques.
- Hybrid Mass Spectrometry: Superior performance (high sensitivity, resolution, speed), versatility across various applications, and increasing availability of advanced software solutions.
- Pharmaceuticals Industry: Growing demand for high-throughput screening, stringent quality control requirements, and increasing research funding for drug discovery and development.
Europe Mass Spectroscopy Industry Product Developments
Recent years have witnessed significant advancements in mass spectrometry technology, focusing on miniaturization, increased sensitivity, and improved data analysis capabilities. Hybrid mass spectrometers, combining the strengths of different mass analyzer types, are gaining popularity. Software advancements enable efficient data processing, interpretation, and integration with other analytical techniques. The integration of ambient ionization techniques reduces sample preparation time and increases throughput, while improved user interfaces make these systems more accessible and easier to operate. This drives wider adoption across various sectors.
Report Scope & Segmentation Analysis
This report comprehensively analyzes the European mass spectrometry market, segmented by technology and application. The technology segment includes Hybrid Mass Spectrometry (projected growth xx% 2025-2033, market size xx Million in 2025), FTMS (projected growth xx%, market size xx Million), Time-of-flight (projected growth xx%, market size xx Million), and Other (projected growth xx%, market size xx Million). The application segment encompasses Pharmaceuticals (projected growth xx%, market size xx Million), Biotechnology (projected growth xx%, market size xx Million), Chemical (projected growth xx%, market size xx Million), and Other applications (projected growth xx%, market size xx Million). Each segment's competitive dynamics are influenced by technological advancements, regulatory changes, and end-user demands.
Key Drivers of Europe Mass Spectroscopy Industry Growth
The European mass spectrometry market is propelled by several key factors: the burgeoning pharmaceutical and biotechnology industries driving demand for sophisticated analytical tools; significant investments in research and development across various sectors; stringent regulatory requirements for quality control and environmental monitoring; and the constant innovation within the mass spectrometry technology itself, leading to more efficient, accurate, and versatile instruments. Increased funding for proteomics research and personalized medicine are further contributing to growth.
Challenges in the Europe Mass Spectroscopy Industry Sector
The Europe mass spectrometry industry faces challenges such as high instrument costs limiting accessibility for smaller research institutions; the complexity of the technology requiring skilled personnel; intense competition among established players; and the evolving regulatory landscape requiring continuous adaptation. Supply chain disruptions, particularly regarding specialized components, also impact production and delivery times. These factors hinder market penetration and profitability, albeit to a varying extent.
Emerging Opportunities in Europe Mass Spectroscopy Industry
Emerging opportunities include the growing adoption of mass spectrometry in clinical diagnostics and point-of-care testing; increasing demand for miniaturized and portable instruments; the integration of mass spectrometry with other analytical techniques such as chromatography and imaging; and expansion into new application areas such as environmental monitoring and food safety. These trends will fuel market growth and innovation in the coming years.
Leading Players in the Europe Mass Spectroscopy Industry Market
- Waters Corporation
- Perkinelmer Inc
- Thermo Fisher Scientific Inc
- Leco Corporation
- Danaher Corporation
- Agilent Technologies Inc
- Dani Instruments SpA
- Bruker Corporation
- Shimadzu Corporation
Key Developments in Europe Mass Spectroscopy Industry Industry
- June 2022: Waters Corporation launched new instruments, software, and product enhancements to boost drug discovery and development, strengthening its position in the pharmaceutical sector and driving market competition.
- April 2022: Bruker Corporation's acquisition of IonSense expanded its ambient ionization capabilities, enhancing its product portfolio and potentially increasing its market share. This acquisition showcases a trend towards consolidation within the industry.
Strategic Outlook for Europe Mass Spectroscopy Industry Market
The Europe mass spectrometry market is poised for continued growth, driven by technological advancements, increasing research funding, and rising demand from diverse end-use industries. Opportunities lie in developing advanced mass spectrometry techniques, expanding into new application areas, and focusing on user-friendly and cost-effective solutions. Strategic partnerships and M&A activities will play a crucial role in shaping the future competitive landscape. The market will likely experience continued consolidation with larger players acquiring smaller companies to expand their product portfolio and increase market share.
Europe Mass Spectroscopy Industry Segmentation
-
1. Technology
-
1.1. Hybrid Mass Spectrometry
- 1.1.1. Triple Quadrupole (Tandem)
- 1.1.2. Quadrupole TOF (Q-TOF)
- 1.1.3. FTMS (Fourier Transform Mass Spectrometry)
-
1.2. Single Mass Spectrometry
- 1.2.1. ION Trap
- 1.2.2. Time-of-flight (TOF)
- 1.3. Other Mass Spectrometry
-
1.1. Hybrid Mass Spectrometry
-
2. Application
- 2.1. Pharmaceuticals Industry
- 2.2. Biotechnology Industry
- 2.3. Chemical Industry
- 2.4. Other Applications
Europe Mass Spectroscopy Industry Segmentation By Geography
- 1. Germany
- 2. United Kingdom
- 3. France
- 4. Italy
- 5. Spain
- 6. Rest of Europe
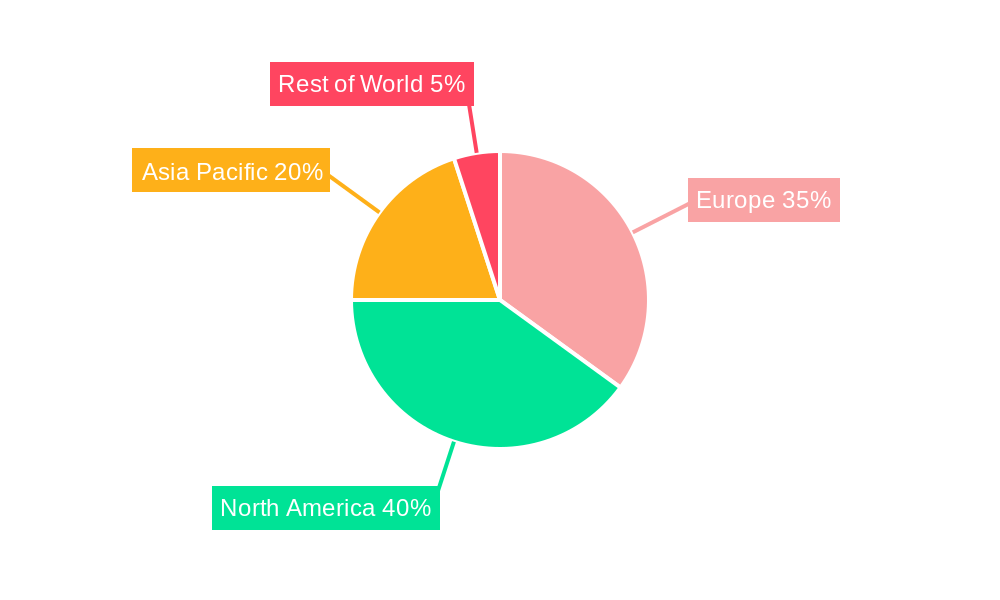
Europe Mass Spectroscopy Industry Regional Market Share
Geographic Coverage of Europe Mass Spectroscopy Industry
Europe Mass Spectroscopy Industry REPORT HIGHLIGHTS
| Aspects | Details |
|---|---|
| Study Period | 2020-2034 |
| Base Year | 2025 |
| Estimated Year | 2026 |
| Forecast Period | 2026-2034 |
| Historical Period | 2020-2025 |
| Growth Rate | CAGR of 6.4% from 2020-2034 |
| Segmentation |
|
Table of Contents
- 1. Introduction
- 1.1. Research Scope
- 1.2. Market Segmentation
- 1.3. Research Objective
- 1.4. Definitions and Assumptions
- 2. Executive Summary
- 2.1. Market Snapshot
- 3. Market Dynamics
- 3.1. Market Drivers
- 3.2. Market Restrains
- 3.3. Market Trends
- 3.4. Market Opportunities
- 4. Market Factor Analysis
- 4.1. Porters Five Forces
- 4.1.1. Bargaining Power of Suppliers
- 4.1.2. Bargaining Power of Buyers
- 4.1.3. Threat of New Entrants
- 4.1.4. Threat of Substitutes
- 4.1.5. Competitive Rivalry
- 4.2. PESTEL analysis
- 4.3. BCG Analysis
- 4.3.1. Stars (High Growth, High Market Share)
- 4.3.2. Cash Cows (Low Growth, High Market Share)
- 4.3.3. Question Mark (High Growth, Low Market Share)
- 4.3.4. Dogs (Low Growth, Low Market Share)
- 4.4. Ansoff Matrix Analysis
- 4.5. Supply Chain Analysis
- 4.6. Regulatory Landscape
- 4.7. Current Market Potential and Opportunity Assessment (TAM–SAM–SOM Framework)
- 4.8. RAX Analyst Note
- 4.1. Porters Five Forces
- 5. Market Analysis, Insights and Forecast 2021-2033
- 5.1. Market Analysis, Insights and Forecast - by Technology
- 5.1.1. Hybrid Mass Spectrometry
- 5.1.1.1. Triple Quadrupole (Tandem)
- 5.1.1.2. Quadrupole TOF (Q-TOF)
- 5.1.1.3. FTMS (Fourier Transform Mass Spectrometry)
- 5.1.2. Single Mass Spectrometry
- 5.1.2.1. ION Trap
- 5.1.2.2. Time-of-flight (TOF)
- 5.1.3. Other Mass Spectrometry
- 5.1.1. Hybrid Mass Spectrometry
- 5.2. Market Analysis, Insights and Forecast - by Application
- 5.2.1. Pharmaceuticals Industry
- 5.2.2. Biotechnology Industry
- 5.2.3. Chemical Industry
- 5.2.4. Other Applications
- 5.3. Market Analysis, Insights and Forecast - by Region
- 5.3.1. Germany
- 5.3.2. United Kingdom
- 5.3.3. France
- 5.3.4. Italy
- 5.3.5. Spain
- 5.3.6. Rest of Europe
- 5.1. Market Analysis, Insights and Forecast - by Technology
- 6. Europe Mass Spectroscopy Industry Analysis, Insights and Forecast, 2021-2033
- 6.1. Market Analysis, Insights and Forecast - by Technology
- 6.1.1. Hybrid Mass Spectrometry
- 6.1.1.1. Triple Quadrupole (Tandem)
- 6.1.1.2. Quadrupole TOF (Q-TOF)
- 6.1.1.3. FTMS (Fourier Transform Mass Spectrometry)
- 6.1.2. Single Mass Spectrometry
- 6.1.2.1. ION Trap
- 6.1.2.2. Time-of-flight (TOF)
- 6.1.3. Other Mass Spectrometry
- 6.1.1. Hybrid Mass Spectrometry
- 6.2. Market Analysis, Insights and Forecast - by Application
- 6.2.1. Pharmaceuticals Industry
- 6.2.2. Biotechnology Industry
- 6.2.3. Chemical Industry
- 6.2.4. Other Applications
- 6.1. Market Analysis, Insights and Forecast - by Technology
- 7. Germany Europe Mass Spectroscopy Industry Analysis, Insights and Forecast, 2020-2032
- 7.1. Market Analysis, Insights and Forecast - by Technology
- 7.1.1. Hybrid Mass Spectrometry
- 7.1.1.1. Triple Quadrupole (Tandem)
- 7.1.1.2. Quadrupole TOF (Q-TOF)
- 7.1.1.3. FTMS (Fourier Transform Mass Spectrometry)
- 7.1.2. Single Mass Spectrometry
- 7.1.2.1. ION Trap
- 7.1.2.2. Time-of-flight (TOF)
- 7.1.3. Other Mass Spectrometry
- 7.1.1. Hybrid Mass Spectrometry
- 7.2. Market Analysis, Insights and Forecast - by Application
- 7.2.1. Pharmaceuticals Industry
- 7.2.2. Biotechnology Industry
- 7.2.3. Chemical Industry
- 7.2.4. Other Applications
- 7.1. Market Analysis, Insights and Forecast - by Technology
- 8. United Kingdom Europe Mass Spectroscopy Industry Analysis, Insights and Forecast, 2020-2032
- 8.1. Market Analysis, Insights and Forecast - by Technology
- 8.1.1. Hybrid Mass Spectrometry
- 8.1.1.1. Triple Quadrupole (Tandem)
- 8.1.1.2. Quadrupole TOF (Q-TOF)
- 8.1.1.3. FTMS (Fourier Transform Mass Spectrometry)
- 8.1.2. Single Mass Spectrometry
- 8.1.2.1. ION Trap
- 8.1.2.2. Time-of-flight (TOF)
- 8.1.3. Other Mass Spectrometry
- 8.1.1. Hybrid Mass Spectrometry
- 8.2. Market Analysis, Insights and Forecast - by Application
- 8.2.1. Pharmaceuticals Industry
- 8.2.2. Biotechnology Industry
- 8.2.3. Chemical Industry
- 8.2.4. Other Applications
- 8.1. Market Analysis, Insights and Forecast - by Technology
- 9. France Europe Mass Spectroscopy Industry Analysis, Insights and Forecast, 2020-2032
- 9.1. Market Analysis, Insights and Forecast - by Technology
- 9.1.1. Hybrid Mass Spectrometry
- 9.1.1.1. Triple Quadrupole (Tandem)
- 9.1.1.2. Quadrupole TOF (Q-TOF)
- 9.1.1.3. FTMS (Fourier Transform Mass Spectrometry)
- 9.1.2. Single Mass Spectrometry
- 9.1.2.1. ION Trap
- 9.1.2.2. Time-of-flight (TOF)
- 9.1.3. Other Mass Spectrometry
- 9.1.1. Hybrid Mass Spectrometry
- 9.2. Market Analysis, Insights and Forecast - by Application
- 9.2.1. Pharmaceuticals Industry
- 9.2.2. Biotechnology Industry
- 9.2.3. Chemical Industry
- 9.2.4. Other Applications
- 9.1. Market Analysis, Insights and Forecast - by Technology
- 10. Italy Europe Mass Spectroscopy Industry Analysis, Insights and Forecast, 2020-2032
- 10.1. Market Analysis, Insights and Forecast - by Technology
- 10.1.1. Hybrid Mass Spectrometry
- 10.1.1.1. Triple Quadrupole (Tandem)
- 10.1.1.2. Quadrupole TOF (Q-TOF)
- 10.1.1.3. FTMS (Fourier Transform Mass Spectrometry)
- 10.1.2. Single Mass Spectrometry
- 10.1.2.1. ION Trap
- 10.1.2.2. Time-of-flight (TOF)
- 10.1.3. Other Mass Spectrometry
- 10.1.1. Hybrid Mass Spectrometry
- 10.2. Market Analysis, Insights and Forecast - by Application
- 10.2.1. Pharmaceuticals Industry
- 10.2.2. Biotechnology Industry
- 10.2.3. Chemical Industry
- 10.2.4. Other Applications
- 10.1. Market Analysis, Insights and Forecast - by Technology
- 11. Spain Europe Mass Spectroscopy Industry Analysis, Insights and Forecast, 2020-2032
- 11.1. Market Analysis, Insights and Forecast - by Technology
- 11.1.1. Hybrid Mass Spectrometry
- 11.1.1.1. Triple Quadrupole (Tandem)
- 11.1.1.2. Quadrupole TOF (Q-TOF)
- 11.1.1.3. FTMS (Fourier Transform Mass Spectrometry)
- 11.1.2. Single Mass Spectrometry
- 11.1.2.1. ION Trap
- 11.1.2.2. Time-of-flight (TOF)
- 11.1.3. Other Mass Spectrometry
- 11.1.1. Hybrid Mass Spectrometry
- 11.2. Market Analysis, Insights and Forecast - by Application
- 11.2.1. Pharmaceuticals Industry
- 11.2.2. Biotechnology Industry
- 11.2.3. Chemical Industry
- 11.2.4. Other Applications
- 11.1. Market Analysis, Insights and Forecast - by Technology
- 12. Rest of Europe Europe Mass Spectroscopy Industry Analysis, Insights and Forecast, 2020-2032
- 12.1. Market Analysis, Insights and Forecast - by Technology
- 12.1.1. Hybrid Mass Spectrometry
- 12.1.1.1. Triple Quadrupole (Tandem)
- 12.1.1.2. Quadrupole TOF (Q-TOF)
- 12.1.1.3. FTMS (Fourier Transform Mass Spectrometry)
- 12.1.2. Single Mass Spectrometry
- 12.1.2.1. ION Trap
- 12.1.2.2. Time-of-flight (TOF)
- 12.1.3. Other Mass Spectrometry
- 12.1.1. Hybrid Mass Spectrometry
- 12.2. Market Analysis, Insights and Forecast - by Application
- 12.2.1. Pharmaceuticals Industry
- 12.2.2. Biotechnology Industry
- 12.2.3. Chemical Industry
- 12.2.4. Other Applications
- 12.1. Market Analysis, Insights and Forecast - by Technology
- 13. Competitive Analysis
- 13.1. Company Profiles
- 13.1.1 Waters Corporation
- 13.1.1.1. Company Overview
- 13.1.1.2. Products
- 13.1.1.3. Company Financials
- 13.1.1.4. SWOT Analysis
- 13.1.2 Perkinelmer Inc
- 13.1.2.1. Company Overview
- 13.1.2.2. Products
- 13.1.2.3. Company Financials
- 13.1.2.4. SWOT Analysis
- 13.1.3 Thermo Fisher Scientific Inc
- 13.1.3.1. Company Overview
- 13.1.3.2. Products
- 13.1.3.3. Company Financials
- 13.1.3.4. SWOT Analysis
- 13.1.4 Leco Corporation
- 13.1.4.1. Company Overview
- 13.1.4.2. Products
- 13.1.4.3. Company Financials
- 13.1.4.4. SWOT Analysis
- 13.1.5 Danaher Corporation
- 13.1.5.1. Company Overview
- 13.1.5.2. Products
- 13.1.5.3. Company Financials
- 13.1.5.4. SWOT Analysis
- 13.1.6 Agilent Technologies Inc
- 13.1.6.1. Company Overview
- 13.1.6.2. Products
- 13.1.6.3. Company Financials
- 13.1.6.4. SWOT Analysis
- 13.1.7 Dani Instruments SpA
- 13.1.7.1. Company Overview
- 13.1.7.2. Products
- 13.1.7.3. Company Financials
- 13.1.7.4. SWOT Analysis
- 13.1.8 Bruker Corporation
- 13.1.8.1. Company Overview
- 13.1.8.2. Products
- 13.1.8.3. Company Financials
- 13.1.8.4. SWOT Analysis
- 13.1.9 Shimadzu Corporation
- 13.1.9.1. Company Overview
- 13.1.9.2. Products
- 13.1.9.3. Company Financials
- 13.1.9.4. SWOT Analysis
- 13.1.1 Waters Corporation
- 13.2. Market Entropy
- 13.2.1 Company's Key Areas Served
- 13.2.2 Recent Developments
- 13.3. Company Market Share Analysis 2025
- 13.3.1 Top 5 Companies Market Share Analysis
- 13.3.2 Top 3 Companies Market Share Analysis
- 13.4. List of Potential Customers
- 14. Research Methodology
List of Figures
- Figure 1: Europe Mass Spectroscopy Industry Revenue Breakdown (billion, %) by Product 2025 & 2033
- Figure 2: Europe Mass Spectroscopy Industry Share (%) by Company 2025
List of Tables
- Table 1: Europe Mass Spectroscopy Industry Revenue billion Forecast, by Technology 2020 & 2033
- Table 2: Europe Mass Spectroscopy Industry Volume K Unit Forecast, by Technology 2020 & 2033
- Table 3: Europe Mass Spectroscopy Industry Revenue billion Forecast, by Application 2020 & 2033
- Table 4: Europe Mass Spectroscopy Industry Volume K Unit Forecast, by Application 2020 & 2033
- Table 5: Europe Mass Spectroscopy Industry Revenue billion Forecast, by Region 2020 & 2033
- Table 6: Europe Mass Spectroscopy Industry Volume K Unit Forecast, by Region 2020 & 2033
- Table 7: Europe Mass Spectroscopy Industry Revenue billion Forecast, by Technology 2020 & 2033
- Table 8: Europe Mass Spectroscopy Industry Volume K Unit Forecast, by Technology 2020 & 2033
- Table 9: Europe Mass Spectroscopy Industry Revenue billion Forecast, by Application 2020 & 2033
- Table 10: Europe Mass Spectroscopy Industry Volume K Unit Forecast, by Application 2020 & 2033
- Table 11: Europe Mass Spectroscopy Industry Revenue billion Forecast, by Country 2020 & 2033
- Table 12: Europe Mass Spectroscopy Industry Volume K Unit Forecast, by Country 2020 & 2033
- Table 13: Europe Mass Spectroscopy Industry Revenue billion Forecast, by Technology 2020 & 2033
- Table 14: Europe Mass Spectroscopy Industry Volume K Unit Forecast, by Technology 2020 & 2033
- Table 15: Europe Mass Spectroscopy Industry Revenue billion Forecast, by Application 2020 & 2033
- Table 16: Europe Mass Spectroscopy Industry Volume K Unit Forecast, by Application 2020 & 2033
- Table 17: Europe Mass Spectroscopy Industry Revenue billion Forecast, by Country 2020 & 2033
- Table 18: Europe Mass Spectroscopy Industry Volume K Unit Forecast, by Country 2020 & 2033
- Table 19: Europe Mass Spectroscopy Industry Revenue billion Forecast, by Technology 2020 & 2033
- Table 20: Europe Mass Spectroscopy Industry Volume K Unit Forecast, by Technology 2020 & 2033
- Table 21: Europe Mass Spectroscopy Industry Revenue billion Forecast, by Application 2020 & 2033
- Table 22: Europe Mass Spectroscopy Industry Volume K Unit Forecast, by Application 2020 & 2033
- Table 23: Europe Mass Spectroscopy Industry Revenue billion Forecast, by Country 2020 & 2033
- Table 24: Europe Mass Spectroscopy Industry Volume K Unit Forecast, by Country 2020 & 2033
- Table 25: Europe Mass Spectroscopy Industry Revenue billion Forecast, by Technology 2020 & 2033
- Table 26: Europe Mass Spectroscopy Industry Volume K Unit Forecast, by Technology 2020 & 2033
- Table 27: Europe Mass Spectroscopy Industry Revenue billion Forecast, by Application 2020 & 2033
- Table 28: Europe Mass Spectroscopy Industry Volume K Unit Forecast, by Application 2020 & 2033
- Table 29: Europe Mass Spectroscopy Industry Revenue billion Forecast, by Country 2020 & 2033
- Table 30: Europe Mass Spectroscopy Industry Volume K Unit Forecast, by Country 2020 & 2033
- Table 31: Europe Mass Spectroscopy Industry Revenue billion Forecast, by Technology 2020 & 2033
- Table 32: Europe Mass Spectroscopy Industry Volume K Unit Forecast, by Technology 2020 & 2033
- Table 33: Europe Mass Spectroscopy Industry Revenue billion Forecast, by Application 2020 & 2033
- Table 34: Europe Mass Spectroscopy Industry Volume K Unit Forecast, by Application 2020 & 2033
- Table 35: Europe Mass Spectroscopy Industry Revenue billion Forecast, by Country 2020 & 2033
- Table 36: Europe Mass Spectroscopy Industry Volume K Unit Forecast, by Country 2020 & 2033
- Table 37: Europe Mass Spectroscopy Industry Revenue billion Forecast, by Technology 2020 & 2033
- Table 38: Europe Mass Spectroscopy Industry Volume K Unit Forecast, by Technology 2020 & 2033
- Table 39: Europe Mass Spectroscopy Industry Revenue billion Forecast, by Application 2020 & 2033
- Table 40: Europe Mass Spectroscopy Industry Volume K Unit Forecast, by Application 2020 & 2033
- Table 41: Europe Mass Spectroscopy Industry Revenue billion Forecast, by Country 2020 & 2033
- Table 42: Europe Mass Spectroscopy Industry Volume K Unit Forecast, by Country 2020 & 2033
Frequently Asked Questions
1. What is the projected Compound Annual Growth Rate (CAGR) of the Europe Mass Spectroscopy Industry?
The projected CAGR is approximately 6.4%.
2. Which companies are prominent players in the Europe Mass Spectroscopy Industry?
Key companies in the market include Waters Corporation, Perkinelmer Inc, Thermo Fisher Scientific Inc, Leco Corporation, Danaher Corporation, Agilent Technologies Inc, Dani Instruments SpA, Bruker Corporation, Shimadzu Corporation.
3. What are the main segments of the Europe Mass Spectroscopy Industry?
The market segments include Technology, Application.
4. Can you provide details about the market size?
The market size is estimated to be USD 1.9 billion as of 2022.
5. What are some drivers contributing to market growth?
Increasing Technological Advancement; Increased Pharmaceutical and Biotechnological Compounds in Pipeline.
6. What are the notable trends driving market growth?
Triple Quadrupole (Tandem Mass Spectrometry Devices) Segment is Expected to Dominate the Market over the Forecast Period.
7. Are there any restraints impacting market growth?
High Cost of Instrument; Shortage of Skilled Technicians.
8. Can you provide examples of recent developments in the market?
June 2022: Waters Corporation unveiled new instruments, software, and product enhancements to drive drug discovery and development.
9. What pricing options are available for accessing the report?
Pricing options include single-user, multi-user, and enterprise licenses priced at USD 4750, USD 5250, and USD 8750 respectively.
10. Is the market size provided in terms of value or volume?
The market size is provided in terms of value, measured in billion and volume, measured in K Unit.
11. Are there any specific market keywords associated with the report?
Yes, the market keyword associated with the report is "Europe Mass Spectroscopy Industry," which aids in identifying and referencing the specific market segment covered.
12. How do I determine which pricing option suits my needs best?
The pricing options vary based on user requirements and access needs. Individual users may opt for single-user licenses, while businesses requiring broader access may choose multi-user or enterprise licenses for cost-effective access to the report.
13. Are there any additional resources or data provided in the Europe Mass Spectroscopy Industry report?
While the report offers comprehensive insights, it's advisable to review the specific contents or supplementary materials provided to ascertain if additional resources or data are available.
14. How can I stay updated on further developments or reports in the Europe Mass Spectroscopy Industry?
To stay informed about further developments, trends, and reports in the Europe Mass Spectroscopy Industry, consider subscribing to industry newsletters, following relevant companies and organizations, or regularly checking reputable industry news sources and publications.
Methodology
Step 1 - Identification of Relevant Samples Size from Population Database


Step 2 - Approaches for Defining Global Market Size (Value, Volume* & Price*)

Note*: In applicable scenarios
Step 3 - Data Sources
Primary Research
- Web Analytics
- Survey Reports
- Research Institute
- Latest Research Reports
- Opinion Leaders
Secondary Research
- Annual Reports
- White Paper
- Latest Press Release
- Industry Association
- Paid Database
- Investor Presentations

Step 4 - Data Triangulation
Involves using different sources of information in order to increase the validity of a study
These sources are likely to be stakeholders in a program - participants, other researchers, program staff, other community members, and so on.
Then we put all data in single framework & apply various statistical tools to find out the dynamic on the market.
During the analysis stage, feedback from the stakeholder groups would be compared to determine areas of agreement as well as areas of divergence