

Key Insights
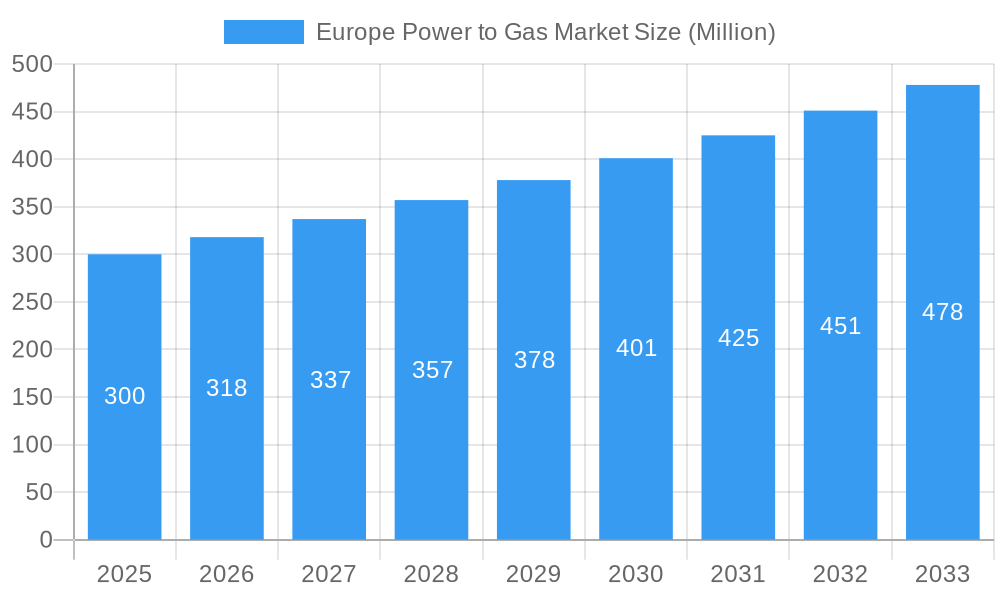
The European Power-to-Gas (PtG) market is projected for substantial expansion, driven by the imperative to decarbonize energy systems and integrate renewable energy sources. With a Compound Annual Growth Rate (CAGR) of 11.35%, the market is set to reach $46.76 billion by 2025. Key growth catalysts include stringent EU climate targets, supportive government policies facilitating renewable energy integration and energy security, and escalating investments in green hydrogen and synthetic methane production. Advancements in electrolysis technologies, such as PEM and SOEC, are enhancing efficiency and reducing costs, improving PtG economic viability. The market is segmented by technology (Power-to-Hydrogen, Power-to-Methane), capacity (categorized by kW), end-user (utilities, industrial, commercial sectors), and geography, with Germany, the UK, France, and Spain leading European adoption. Prominent players like Siemens Energy AG, GRT Gaz SA, and Nel ASA highlight the market's maturity and investment appeal.
Europe Power to Gas Market Market Size (In Billion)
Market expansion faces challenges including high capital expenditure for PtG infrastructure, limitations in grid capacity, and the necessity for further efficiency improvements. Nevertheless, the long-term European PtG market outlook remains robust, primarily due to the drive to reduce fossil fuel dependency and effectively manage renewable energy intermittency. The market's segmentation presents opportunities for specialized firms focusing on specific technological niches or end-user applications, fostering a dynamic competitive environment. Continued research, development, and policy support are vital to fully realize the potential of this critical sector for Europe's sustainable energy future.
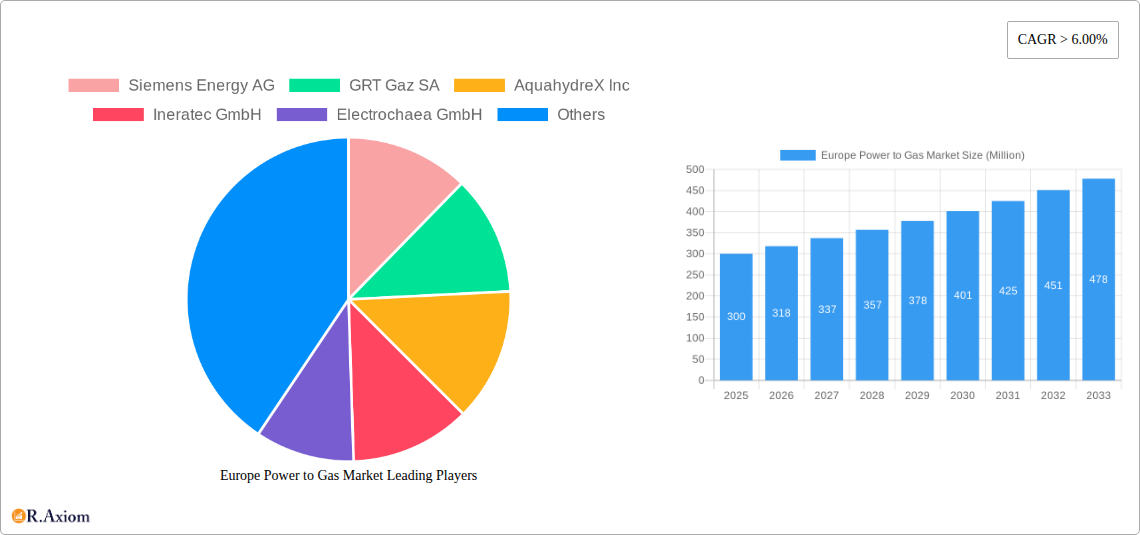
Europe Power to Gas Market Company Market Share
This comprehensive report delivers an in-depth analysis of the European Power-to-Gas market, providing critical insights into market dynamics, growth drivers, and future opportunities. Covering the period 2019-2033, with 2025 as the base year, this analysis is an indispensable resource for industry stakeholders, investors, and policymakers.
Europe Power to Gas Market Concentration & Innovation
This section analyzes the competitive landscape of the European Power to Gas market, examining market concentration, innovation drivers, regulatory frameworks, and recent mergers and acquisitions (M&A) activities. The market is characterized by a mix of established players and emerging innovators. Market share data for 2024 reveals a fragmented market, with no single dominant player holding more than xx%. However, companies like Siemens Energy AG and Nel ASA hold significant shares due to their established presence and technological expertise. Innovation is driven by the need to improve efficiency, reduce costs, and develop sustainable solutions. Regulatory frameworks, such as the EU’s Green Deal, are playing a crucial role in shaping market growth by providing incentives for renewable energy adoption. Product substitutes, such as traditional fossil fuels, face increasing pressure from stricter environmental regulations and the growing demand for decarbonization. M&A activity has been relatively robust, with deal values exceeding €xx Million in 2024, signaling the industry's consolidation and strategic expansion efforts.
- Market Concentration: Fragmented, with no single dominant player.
- Innovation Drivers: Efficiency improvements, cost reduction, sustainable solutions.
- Regulatory Framework: EU Green Deal driving market growth.
- Product Substitutes: Facing increased pressure from regulations.
- M&A Activity: Significant deal values exceeding €xx Million in 2024.
- End-User Trends: Increasing demand from utilities, industrial and commercial sectors.
Europe Power to Gas Market Industry Trends & Insights
The European Power to Gas market is experiencing robust growth, driven by several factors. The increasing focus on decarbonization and the transition to renewable energy sources is creating significant demand for power-to-gas technologies. Government support in the form of subsidies and tax incentives is further accelerating market expansion. Technological advancements, including improvements in electrolysis efficiency and the development of more cost-effective solutions, are also contributing to market growth. Consumer preferences are shifting towards cleaner energy sources, creating a strong pull for power-to-gas technologies. The competitive dynamics are characterized by intense competition among established players and emerging companies, leading to continuous innovation and product improvement. The Compound Annual Growth Rate (CAGR) for the market during the forecast period (2025-2033) is projected to be xx%, with market penetration expected to reach xx% by 2033.
Dominant Markets & Segments in Europe Power to Gas Market
Germany and the United Kingdom are the leading markets for Power to Gas in Europe, driven by supportive government policies, established renewable energy infrastructure, and significant industrial demand. The Power-to-Hydrogen segment dominates the technology landscape, with Alkaline Water Electrolysis currently holding the largest market share, followed by PEM and SOEC technologies. The demand for larger capacity systems (more than 1000 KW) is substantial, driven by large-scale industrial applications. Utilities are the largest end-users, followed by the industrial and commercial sectors.
- Key Drivers for Germany and UK: Supportive government policies, existing renewable energy infrastructure, strong industrial demand.
- Dominant Technology Segment: Power-to-Hydrogen (Alkaline Water Electrolysis).
- Dominant Capacity Segment: More than 1000 KW.
- Dominant End-User Segment: Utilities.
- Other regions: France and Spain show significant growth potential but are currently behind Germany and UK.
Europe Power to Gas Market Product Developments
Significant advancements are being made in electrolysis technologies, with a focus on improving efficiency, reducing costs, and expanding scalability. This includes advancements in Alkaline Water Electrolysis, Proton Exchange Membrane (PEM) electrolysis, and Solid Oxide Electrolysis Cells (SOEC). New applications are constantly emerging, driven by the increasing need for flexible and efficient energy storage solutions, particularly in sectors like transportation, heating, and industrial processes. The market is witnessing a strong emphasis on modular and scalable systems to cater to diverse needs and facilitate easier deployment.
Report Scope & Segmentation Analysis
This report segments the European Power to Gas market based on technology (Power-to-Hydrogen – Alkaline Water Electrolysis, PEM, SOEC; Power-to-Methane – Chemical and Biological), capacity (more than 1000 KW, 100 to 1000 KW, less than 100 KW), end-user (utilities, industrial, commercial), and location (United Kingdom, Germany, France, Spain, Others). Each segment is analyzed in detail, providing market size, growth projections, and competitive dynamics.
Key Drivers of Europe Power to Gas Market Growth
The growth of the European Power to Gas market is being driven by several factors:
- Renewable Energy Integration: The increasing penetration of renewable energy sources requires efficient energy storage solutions.
- Decarbonization Targets: Stringent government regulations and emission reduction targets promote green hydrogen production.
- Technological Advancements: Continuous improvements in electrolysis and methanation technologies lead to cost reduction and efficiency gains.
- Government Support: Subsidies, incentives, and supportive policies accelerate market adoption.
Challenges in the Europe Power to Gas Market Sector
Several factors hinder the growth of the Europe Power to Gas market:
- High Capital Costs: The initial investment for power-to-gas infrastructure is significant.
- Intermittency of Renewable Sources: Power-to-gas systems rely on the availability of renewable energy.
- Lack of Infrastructure: The existing gas infrastructure may require upgrades to handle hydrogen or methane.
- Competition from other energy storage solutions: Power-to-gas faces competition from other technologies, like batteries.
Emerging Opportunities in Europe Power to Gas Market
Emerging opportunities include:
- Green Hydrogen Production: The increasing demand for green hydrogen for various applications.
- Sector Coupling: Integrating power-to-gas with other sectors (heating, transportation).
- Power-to-X: Expanding into other forms of synthetic fuels beyond hydrogen and methane.
- Innovative Business Models: Exploring new business models for grid-scale energy storage and synthetic fuel production.
Leading Players in the Europe Power to Gas Market Market
- Siemens Energy AG
- GRT Gaz SA
- AquahydreX Inc
- Ineratec GmbH
- Electrochaea GmbH
- Sempra Energy
- Nel ASA
Key Developments in Europe Power to Gas Industry
- March 2022: ERM Dolphyn and Source Energie partner to develop a 200 MW floating wind-to-hydrogen project in the UK (commissioning expected by 2027).
- March 2022: Sunfire wins contract to supply electrolysis equipment for Finland's first industrial-scale green hydrogen plant (20 MW, EUR 70 Million investment).
Strategic Outlook for Europe Power to Gas Market Market
The European Power to Gas market holds substantial potential for growth, driven by the urgent need for decarbonization and the increasing adoption of renewable energy sources. Continued technological innovation, supportive government policies, and falling costs will further accelerate market expansion. The integration of power-to-gas into wider energy systems and the development of innovative business models will create significant opportunities for market participants. The market is poised for substantial growth, transforming the energy landscape and contributing significantly to Europe's climate goals.
Europe Power to Gas Market Segmentation
-
1. Technology
- 1.1. Power-to
- 1.2. Power-to-Methane (incl. Chemical and Biological)
-
2. Capacity
- 2.1. More than 1000 KW
- 2.2. 100 to 1000 KW
- 2.3. Less than 100 KW
-
3. End-User
- 3.1. Utilities
- 3.2. Industrial
- 3.3. Commercial
-
4. Location
- 4.1. United Kingdom
- 4.2. Germany
- 4.3. France
- 4.4. Spain
- 4.5. Others
Europe Power to Gas Market Segmentation By Geography
-
1. Europe
- 1.1. United Kingdom
- 1.2. Germany
- 1.3. France
- 1.4. Italy
- 1.5. Spain
- 1.6. Netherlands
- 1.7. Belgium
- 1.8. Sweden
- 1.9. Norway
- 1.10. Poland
- 1.11. Denmark
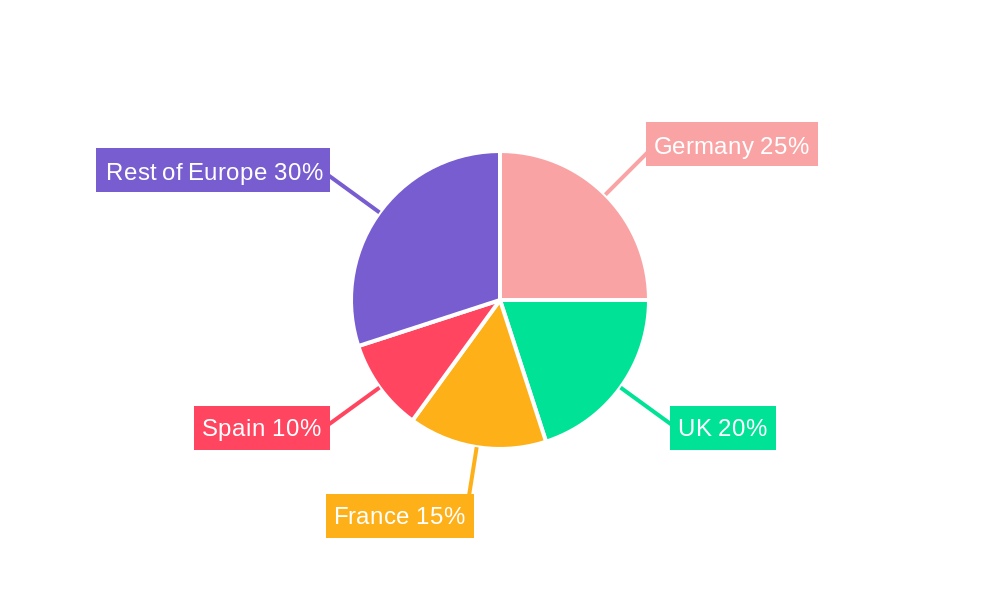
Europe Power to Gas Market Regional Market Share
Geographic Coverage of Europe Power to Gas Market
Europe Power to Gas Market REPORT HIGHLIGHTS
| Aspects | Details |
|---|---|
| Study Period | 2020-2034 |
| Base Year | 2025 |
| Estimated Year | 2026 |
| Forecast Period | 2026-2034 |
| Historical Period | 2020-2025 |
| Growth Rate | CAGR of 11.35% from 2020-2034 |
| Segmentation |
|
Table of Contents
- 1. Introduction
- 1.1. Research Scope
- 1.2. Market Segmentation
- 1.3. Research Objective
- 1.4. Definitions and Assumptions
- 2. Executive Summary
- 2.1. Market Snapshot
- 3. Market Dynamics
- 3.1. Market Drivers
- 3.2. Market Restrains
- 3.3. Market Trends
- 3.4. Market Opportunities
- 4. Market Factor Analysis
- 4.1. Porters Five Forces
- 4.1.1. Bargaining Power of Suppliers
- 4.1.2. Bargaining Power of Buyers
- 4.1.3. Threat of New Entrants
- 4.1.4. Threat of Substitutes
- 4.1.5. Competitive Rivalry
- 4.2. PESTEL analysis
- 4.3. BCG Analysis
- 4.3.1. Stars (High Growth, High Market Share)
- 4.3.2. Cash Cows (Low Growth, High Market Share)
- 4.3.3. Question Mark (High Growth, Low Market Share)
- 4.3.4. Dogs (Low Growth, Low Market Share)
- 4.4. Ansoff Matrix Analysis
- 4.5. Supply Chain Analysis
- 4.6. Regulatory Landscape
- 4.7. Current Market Potential and Opportunity Assessment (TAM–SAM–SOM Framework)
- 4.8. RAX Analyst Note
- 4.1. Porters Five Forces
- 5. Market Analysis, Insights and Forecast 2021-2033
- 5.1. Market Analysis, Insights and Forecast - by Technology
- 5.1.1. Power-to
- 5.1.2. Power-to-Methane (incl. Chemical and Biological)
- 5.2. Market Analysis, Insights and Forecast - by Capacity
- 5.2.1. More than 1000 KW
- 5.2.2. 100 to 1000 KW
- 5.2.3. Less than 100 KW
- 5.3. Market Analysis, Insights and Forecast - by End-User
- 5.3.1. Utilities
- 5.3.2. Industrial
- 5.3.3. Commercial
- 5.4. Market Analysis, Insights and Forecast - by Location
- 5.4.1. United Kingdom
- 5.4.2. Germany
- 5.4.3. France
- 5.4.4. Spain
- 5.4.5. Others
- 5.5. Market Analysis, Insights and Forecast - by Region
- 5.5.1. Europe
- 5.1. Market Analysis, Insights and Forecast - by Technology
- 6. Europe Power to Gas Market Analysis, Insights and Forecast, 2021-2033
- 6.1. Market Analysis, Insights and Forecast - by Technology
- 6.1.1. Power-to
- 6.1.2. Power-to-Methane (incl. Chemical and Biological)
- 6.2. Market Analysis, Insights and Forecast - by Capacity
- 6.2.1. More than 1000 KW
- 6.2.2. 100 to 1000 KW
- 6.2.3. Less than 100 KW
- 6.3. Market Analysis, Insights and Forecast - by End-User
- 6.3.1. Utilities
- 6.3.2. Industrial
- 6.3.3. Commercial
- 6.4. Market Analysis, Insights and Forecast - by Location
- 6.4.1. United Kingdom
- 6.4.2. Germany
- 6.4.3. France
- 6.4.4. Spain
- 6.4.5. Others
- 6.1. Market Analysis, Insights and Forecast - by Technology
- 7. Competitive Analysis
- 7.1. Company Profiles
- 7.1.1 Siemens Energy AG
- 7.1.1.1. Company Overview
- 7.1.1.2. Products
- 7.1.1.3. Company Financials
- 7.1.1.4. SWOT Analysis
- 7.1.2 GRT Gaz SA
- 7.1.2.1. Company Overview
- 7.1.2.2. Products
- 7.1.2.3. Company Financials
- 7.1.2.4. SWOT Analysis
- 7.1.3 AquahydreX Inc
- 7.1.3.1. Company Overview
- 7.1.3.2. Products
- 7.1.3.3. Company Financials
- 7.1.3.4. SWOT Analysis
- 7.1.4 Ineratec GmbH
- 7.1.4.1. Company Overview
- 7.1.4.2. Products
- 7.1.4.3. Company Financials
- 7.1.4.4. SWOT Analysis
- 7.1.5 Electrochaea GmbH
- 7.1.5.1. Company Overview
- 7.1.5.2. Products
- 7.1.5.3. Company Financials
- 7.1.5.4. SWOT Analysis
- 7.1.6 Sempra Energy
- 7.1.6.1. Company Overview
- 7.1.6.2. Products
- 7.1.6.3. Company Financials
- 7.1.6.4. SWOT Analysis
- 7.1.7 Nel ASA
- 7.1.7.1. Company Overview
- 7.1.7.2. Products
- 7.1.7.3. Company Financials
- 7.1.7.4. SWOT Analysis
- 7.1.1 Siemens Energy AG
- 7.2. Market Entropy
- 7.2.1 Company's Key Areas Served
- 7.2.2 Recent Developments
- 7.3. Company Market Share Analysis 2025
- 7.3.1 Top 5 Companies Market Share Analysis
- 7.3.2 Top 3 Companies Market Share Analysis
- 7.4. List of Potential Customers
- 8. Research Methodology
List of Figures
- Figure 1: Europe Power to Gas Market Revenue Breakdown (billion, %) by Product 2025 & 2033
- Figure 2: Europe Power to Gas Market Share (%) by Company 2025
List of Tables
- Table 1: Europe Power to Gas Market Revenue billion Forecast, by Technology 2020 & 2033
- Table 2: Europe Power to Gas Market Volume Gigawatt Forecast, by Technology 2020 & 2033
- Table 3: Europe Power to Gas Market Revenue billion Forecast, by Capacity 2020 & 2033
- Table 4: Europe Power to Gas Market Volume Gigawatt Forecast, by Capacity 2020 & 2033
- Table 5: Europe Power to Gas Market Revenue billion Forecast, by End-User 2020 & 2033
- Table 6: Europe Power to Gas Market Volume Gigawatt Forecast, by End-User 2020 & 2033
- Table 7: Europe Power to Gas Market Revenue billion Forecast, by Location 2020 & 2033
- Table 8: Europe Power to Gas Market Volume Gigawatt Forecast, by Location 2020 & 2033
- Table 9: Europe Power to Gas Market Revenue billion Forecast, by Region 2020 & 2033
- Table 10: Europe Power to Gas Market Volume Gigawatt Forecast, by Region 2020 & 2033
- Table 11: Europe Power to Gas Market Revenue billion Forecast, by Technology 2020 & 2033
- Table 12: Europe Power to Gas Market Volume Gigawatt Forecast, by Technology 2020 & 2033
- Table 13: Europe Power to Gas Market Revenue billion Forecast, by Capacity 2020 & 2033
- Table 14: Europe Power to Gas Market Volume Gigawatt Forecast, by Capacity 2020 & 2033
- Table 15: Europe Power to Gas Market Revenue billion Forecast, by End-User 2020 & 2033
- Table 16: Europe Power to Gas Market Volume Gigawatt Forecast, by End-User 2020 & 2033
- Table 17: Europe Power to Gas Market Revenue billion Forecast, by Location 2020 & 2033
- Table 18: Europe Power to Gas Market Volume Gigawatt Forecast, by Location 2020 & 2033
- Table 19: Europe Power to Gas Market Revenue billion Forecast, by Country 2020 & 2033
- Table 20: Europe Power to Gas Market Volume Gigawatt Forecast, by Country 2020 & 2033
- Table 21: United Kingdom Europe Power to Gas Market Revenue (billion) Forecast, by Application 2020 & 2033
- Table 22: United Kingdom Europe Power to Gas Market Volume (Gigawatt) Forecast, by Application 2020 & 2033
- Table 23: Germany Europe Power to Gas Market Revenue (billion) Forecast, by Application 2020 & 2033
- Table 24: Germany Europe Power to Gas Market Volume (Gigawatt) Forecast, by Application 2020 & 2033
- Table 25: France Europe Power to Gas Market Revenue (billion) Forecast, by Application 2020 & 2033
- Table 26: France Europe Power to Gas Market Volume (Gigawatt) Forecast, by Application 2020 & 2033
- Table 27: Italy Europe Power to Gas Market Revenue (billion) Forecast, by Application 2020 & 2033
- Table 28: Italy Europe Power to Gas Market Volume (Gigawatt) Forecast, by Application 2020 & 2033
- Table 29: Spain Europe Power to Gas Market Revenue (billion) Forecast, by Application 2020 & 2033
- Table 30: Spain Europe Power to Gas Market Volume (Gigawatt) Forecast, by Application 2020 & 2033
- Table 31: Netherlands Europe Power to Gas Market Revenue (billion) Forecast, by Application 2020 & 2033
- Table 32: Netherlands Europe Power to Gas Market Volume (Gigawatt) Forecast, by Application 2020 & 2033
- Table 33: Belgium Europe Power to Gas Market Revenue (billion) Forecast, by Application 2020 & 2033
- Table 34: Belgium Europe Power to Gas Market Volume (Gigawatt) Forecast, by Application 2020 & 2033
- Table 35: Sweden Europe Power to Gas Market Revenue (billion) Forecast, by Application 2020 & 2033
- Table 36: Sweden Europe Power to Gas Market Volume (Gigawatt) Forecast, by Application 2020 & 2033
- Table 37: Norway Europe Power to Gas Market Revenue (billion) Forecast, by Application 2020 & 2033
- Table 38: Norway Europe Power to Gas Market Volume (Gigawatt) Forecast, by Application 2020 & 2033
- Table 39: Poland Europe Power to Gas Market Revenue (billion) Forecast, by Application 2020 & 2033
- Table 40: Poland Europe Power to Gas Market Volume (Gigawatt) Forecast, by Application 2020 & 2033
- Table 41: Denmark Europe Power to Gas Market Revenue (billion) Forecast, by Application 2020 & 2033
- Table 42: Denmark Europe Power to Gas Market Volume (Gigawatt) Forecast, by Application 2020 & 2033
Frequently Asked Questions
1. What is the projected Compound Annual Growth Rate (CAGR) of the Europe Power to Gas Market?
The projected CAGR is approximately 11.35%.
2. Which companies are prominent players in the Europe Power to Gas Market?
Key companies in the market include Siemens Energy AG, GRT Gaz SA, AquahydreX Inc, Ineratec GmbH, Electrochaea GmbH, Sempra Energy, Nel ASA.
3. What are the main segments of the Europe Power to Gas Market?
The market segments include Technology, Capacity, End-User, Location.
4. Can you provide details about the market size?
The market size is estimated to be USD 46.76 billion as of 2022.
5. What are some drivers contributing to market growth?
4.; Growing Demand to Develop the Natural Gas Infrastructure4.; Increase in Offshore Oil and Gas Exploration and Production (E&P) Activities.
6. What are the notable trends driving market growth?
Germany is going to dominate the market.
7. Are there any restraints impacting market growth?
4.; High Volatility of Oil and Gas Prices.
8. Can you provide examples of recent developments in the market?
In March 2022. Environmental Resources Management's (ERM) ERM Dolphyn and Source Energie have entered into a partnership to develop a 200 floating wind to hydrogen project in the United Kingdom. The project is expected to be commissioned by 2027 and is likely to produce green hydrogen.
9. What pricing options are available for accessing the report?
Pricing options include single-user, multi-user, and enterprise licenses priced at USD 4750, USD 5250, and USD 8750 respectively.
10. Is the market size provided in terms of value or volume?
The market size is provided in terms of value, measured in billion and volume, measured in Gigawatt.
11. Are there any specific market keywords associated with the report?
Yes, the market keyword associated with the report is "Europe Power to Gas Market," which aids in identifying and referencing the specific market segment covered.
12. How do I determine which pricing option suits my needs best?
The pricing options vary based on user requirements and access needs. Individual users may opt for single-user licenses, while businesses requiring broader access may choose multi-user or enterprise licenses for cost-effective access to the report.
13. Are there any additional resources or data provided in the Europe Power to Gas Market report?
While the report offers comprehensive insights, it's advisable to review the specific contents or supplementary materials provided to ascertain if additional resources or data are available.
14. How can I stay updated on further developments or reports in the Europe Power to Gas Market?
To stay informed about further developments, trends, and reports in the Europe Power to Gas Market, consider subscribing to industry newsletters, following relevant companies and organizations, or regularly checking reputable industry news sources and publications.
Methodology
Step 1 - Identification of Relevant Samples Size from Population Database


Step 2 - Approaches for Defining Global Market Size (Value, Volume* & Price*)

Note*: In applicable scenarios
Step 3 - Data Sources
Primary Research
- Web Analytics
- Survey Reports
- Research Institute
- Latest Research Reports
- Opinion Leaders
Secondary Research
- Annual Reports
- White Paper
- Latest Press Release
- Industry Association
- Paid Database
- Investor Presentations

Step 4 - Data Triangulation
Involves using different sources of information in order to increase the validity of a study
These sources are likely to be stakeholders in a program - participants, other researchers, program staff, other community members, and so on.
Then we put all data in single framework & apply various statistical tools to find out the dynamic on the market.
During the analysis stage, feedback from the stakeholder groups would be compared to determine areas of agreement as well as areas of divergence