Events and Exhibition Market Expected to Reach XXX Million by 2033

Events and Exhibition Market by Type (B2B, B2C, Mixed/Hybrid), by Revenue Stream (Exhibitor Fee, Sponsorship Fee, Entrance Fee, Services), by End User (Consumer Goods and Retail Sector, Automotive and Transportation Sector, Industrial, Entertainment, Real Estate and Property, Hospitality Sector, Other End Users), by North America (United States, Canada), by Europe (Germany, United Kingdom, France), by Asia Pacific (China, Japan, India, South Korea, Australia and New Zealand), by Latin America, by Middle East and Africa Forecast 2025-2033

Jul 7 2025
Base Year: 2024

234 Pages
Main Logo

Events and Exhibition Market Expected to Reach XXX Million by 2033


Home
Industries
Technology, Media and Telecom
sponsor image
sponsor image
sponsor image
sponsor image
sponsor image
sponsor image
sponsor image
sponsor image
sponsor image
sponsor image
sponsor image
sponsor image
sponsor image
sponsor image
sponsor image
sponsor image
sponsor image
sponsor image
sponsor image
sponsor image

Tailored for you

  • In-depth Analysis Tailored to Specified Regions or Segments
  • Company Profiles Customized to User Preferences
  • Comprehensive Insights Focused on Specific Segments or Regions
  • Customized Evaluation of Competitive Landscape to Meet Your Needs
  • Tailored Customization to Address Other Specific Requirements
Ask for customization


Key Insights

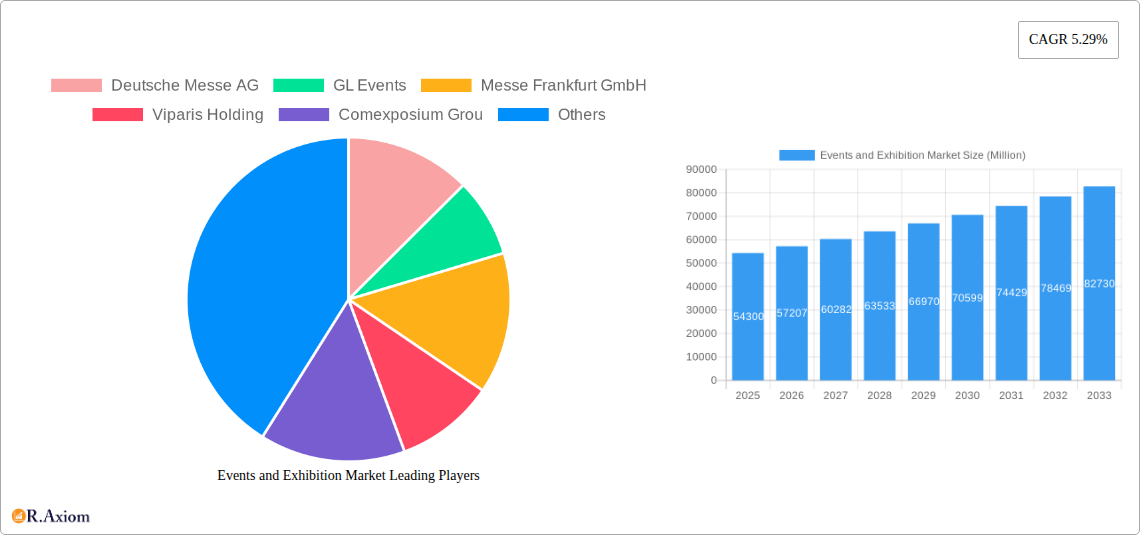
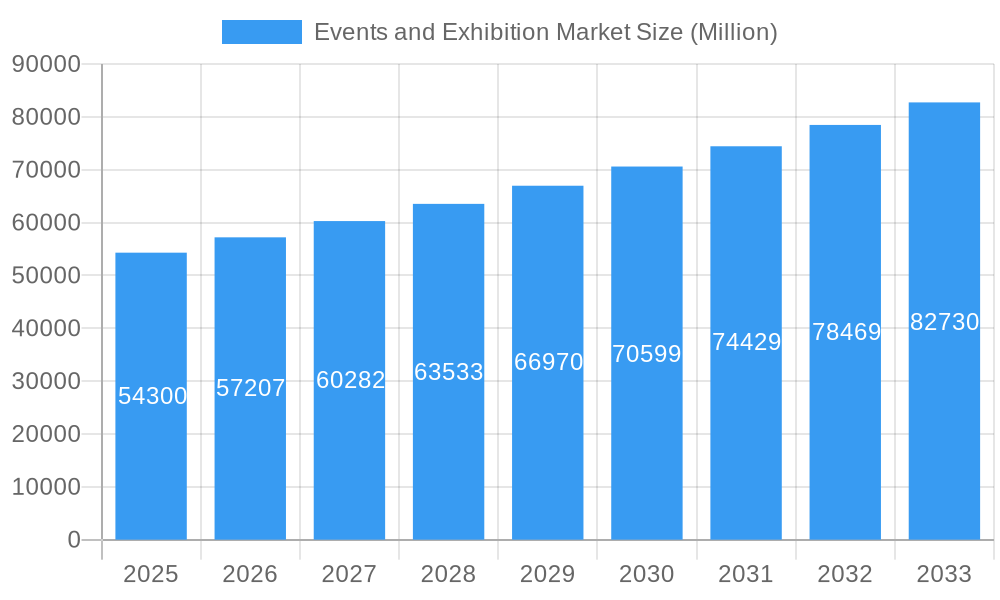
The global events and exhibition market, valued at $54.30 billion in 2025, is projected to experience robust growth, driven by a compound annual growth rate (CAGR) of 5.29% from 2025 to 2033. This expansion is fueled by several key factors. The increasing adoption of hybrid and virtual event formats caters to broader audiences and reduces geographical limitations. Furthermore, the rising need for businesses to network and showcase products, particularly within sectors like consumer goods and retail, automotive, and industrial manufacturing, propels demand for these events. The resurgence of in-person events post-pandemic, coupled with technological advancements improving the attendee experience, further contributes to market growth. While economic fluctuations can pose a restraint, the overall trend points towards sustained expansion across various segments, including B2B, B2C, and hybrid models. Different revenue streams, encompassing exhibitor fees, sponsorship, entrance fees, and ancillary services, contribute to the market's diversity and resilience. Geographical expansion, particularly in rapidly developing economies across Asia-Pacific and South America, presents significant opportunities for growth. Key players like Deutsche Messe AG, Messe Frankfurt GmbH, and Comexposium Group are actively shaping the market through innovation and strategic acquisitions.
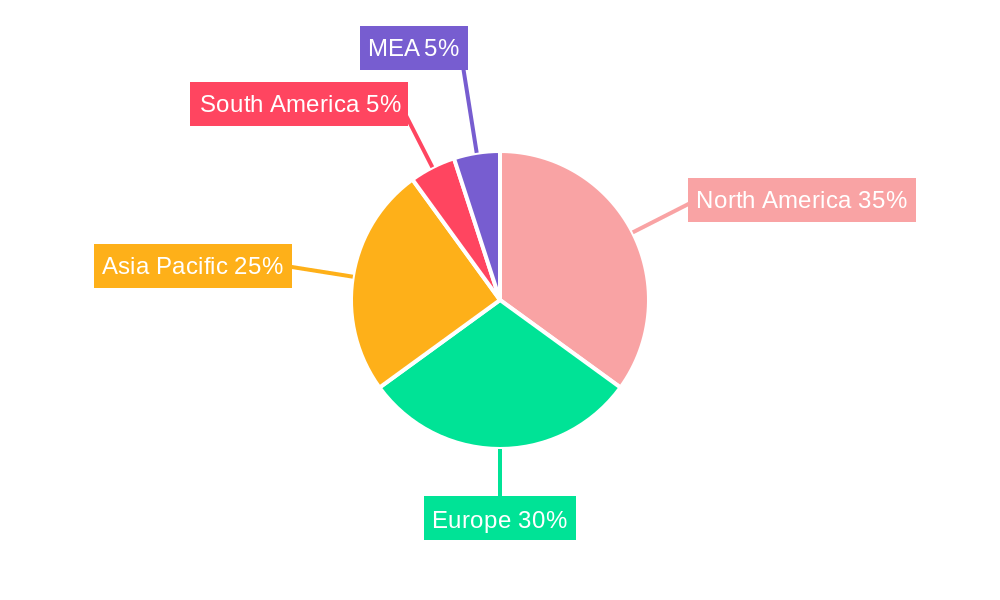
The segmentation of the market reveals key insights into its dynamics. The B2B segment is expected to remain dominant due to the crucial role of trade shows and conferences in business-to-business interactions. However, the B2C segment is also witnessing significant growth fueled by the increasing popularity of consumer expos and festivals. The mixed/hybrid model is gaining traction, combining the benefits of both in-person and virtual participation. From a revenue perspective, exhibitor fees and sponsorship remain the largest contributors, indicating the importance of attracting major companies and securing sponsorships. Analyzing the end-user segments, the consumer goods and retail, automotive, and industrial sectors are significant drivers, reflecting the need for product launches, brand building, and industry networking within these sectors. Regional variations exist, with North America and Europe holding significant market shares initially, but Asia-Pacific is poised for substantial growth due to its expanding economy and increasing participation in international exhibitions. The forecast period (2025-2033) presents significant opportunities for market players to capitalize on these trends through strategic investments and innovative event formats.

This detailed report provides a comprehensive analysis of the global Events and Exhibition Market, encompassing historical data (2019-2024), current estimates (2025), and future forecasts (2025-2033). It delves into market segmentation, key players, growth drivers, challenges, and emerging opportunities, offering actionable insights for industry stakeholders. The study period covers 2019-2033, with 2025 serving as the base year. This report is crucial for understanding the evolving landscape of the events and exhibition industry, valued at xx Million in 2025 and projected to reach xx Million by 2033.

Events and Exhibition Market Research Report - Market Size, Growth & Forecast

Events and Exhibition Market Market Concentration & Innovation

The Events and Exhibition Market is characterized by a moderately concentrated landscape, with a few dominant players commanding significant market share. Deutsche Messe AG, Messe Frankfurt GmbH, and GL Events are among the leading players, collectively accounting for an estimated xx% of the global market share in 2025. However, the market also features numerous smaller, specialized players catering to niche segments.

Market Concentration Metrics (2025):

  • Top 3 Players Market Share: xx%
  • Top 5 Players Market Share: xx%
  • Herfindahl-Hirschman Index (HHI): xx

Innovation within the industry is driven by several factors:

  • Technological advancements: The integration of virtual reality (VR), augmented reality (AR), and artificial intelligence (AI) is transforming event experiences, enhancing engagement, and expanding reach.
  • Sustainable practices: Growing environmental concerns are pushing for eco-friendly event solutions, impacting venue selection, waste management, and transportation.
  • Data analytics: The use of data analytics helps optimize event planning, improve attendee engagement, and personalize experiences.

Regulatory Frameworks and M&A Activity:

Regulatory frameworks vary across regions, impacting licensing, safety regulations, and event permits. The industry has witnessed significant M&A activity in recent years, as companies seek to expand their geographic reach and service offerings. For example, the 2023 merger of EventWorks and Quest Events exemplifies this trend. While precise deal values are not publicly available for all transactions, the total M&A deal value within the sector between 2019 and 2025 is estimated at xx Million.

Events and Exhibition Market Industry Trends & Insights

The global Events and Exhibition Market is experiencing robust growth, driven by several key factors. The increasing preference for experiential marketing and the rising demand for networking opportunities contribute significantly to market expansion. Technological advancements, such as virtual and hybrid events, are broadening market reach and accessibility, creating new revenue streams. The market is also witnessing a shift in consumer preferences towards personalized and interactive experiences.

Key Trends and Insights:

  • Market Growth: The market is projected to exhibit a Compound Annual Growth Rate (CAGR) of xx% during the forecast period (2025-2033).
  • Market Penetration: The market penetration rate for virtual and hybrid events is increasing, expected to reach xx% by 2033.
  • Technological Disruption: The adoption of virtual and hybrid event formats is disrupting traditional models, leading to the evolution of event management platforms and technologies.
  • Consumer Preferences: Consumers increasingly seek unique and engaging experiences, leading event organizers to incorporate interactive elements, personalized content, and gamification.
  • Competitive Dynamics: Intense competition among event organizers is driving innovation and the adoption of effective marketing strategies.
Events and Exhibition Market Growth

Dominant Markets & Segments in Events and Exhibition Market

The North American region is currently the dominant market for events and exhibitions, driven by robust economic activity, developed infrastructure, and a high concentration of major players. Within the segments, B2B events hold the largest market share due to their critical role in business networking and product launches. However, the B2C segment is witnessing significant growth, fueled by rising consumer spending and the demand for entertainment and leisure activities.

Dominant Segments and Drivers:

  • By Type: B2B events dominate due to high corporate spending. Mixed/Hybrid events are exhibiting the fastest growth due to adaptability and broad reach.
  • By Revenue Stream: Exhibitor fees remain the largest revenue source, but sponsorship and entrance fees are also significant. Service revenue is projected to grow, as organizers offer value-added services.
  • By End User: The Consumer Goods and Retail, and Automotive and Transportation sectors are major contributors due to their extensive use of events and exhibitions for marketing, sales, and product launches.

Key Drivers of Regional Dominance:

  • North America: Strong economic conditions, well-developed infrastructure, and a large number of established event organizers.
  • Europe: A large number of established trade fairs and exhibitions, supportive government policies.
  • Asia-Pacific: Rapid economic growth, increasing urbanization, and rising disposable incomes fuel this market's expansion.

Events and Exhibition Market Product Developments

Product innovations are focused on enhancing attendee experience, optimizing event management, and leveraging technology. This includes the development of advanced registration and ticketing systems, interactive platforms for networking and engagement, and virtual event solutions providing seamless online participation. The market is witnessing a trend toward sustainable solutions, focusing on reducing environmental impact through digitalization and eco-friendly materials.

Report Scope & Segmentation Analysis

This report segments the Events and Exhibition Market by type (B2B, B2C, Mixed/Hybrid), revenue stream (exhibitor fee, sponsorship fee, entrance fee, services), and end-user (Consumer Goods and Retail, Automotive and Transportation, Industrial, Entertainment, Real Estate and Property, Hospitality, Other). Each segment's growth projections, market size, and competitive dynamics are thoroughly analyzed. For instance, the B2B segment is predicted to grow at a CAGR of xx%, while the mixed/hybrid segment is expected to show faster growth due to the flexibility and expanded reach it offers. The consumer goods and retail sector remains the largest end-user segment, driven by companies' continued focus on marketing, branding and new product launches.

Key Drivers of Events and Exhibition Market Growth

Several factors drive the Events and Exhibition Market's growth:

  • Technological advancements: Virtual and hybrid events are expanding reach and accessibility.
  • Economic growth: Increased disposable incomes fuel demand for entertainment and networking opportunities.
  • Favorable government policies: Support for the tourism and events sectors boosts industry development.
  • Increased corporate spending: Companies invest in events for marketing, sales, and brand building.

Challenges in the Events and Exhibition Market Sector

Challenges facing the industry include:

  • Economic downturns: Recessions can significantly reduce corporate and consumer spending on events. The impact of this is estimated to be a xx% reduction in market size during economic downturns.
  • Competition: Intense rivalry among event organizers requires innovative strategies to stay competitive.
  • Regulatory hurdles: Varying regulations across regions can complicate event planning and logistics.
  • Supply chain disruptions: Disruptions can impact the availability of venues, equipment, and services.

Emerging Opportunities in Events and Exhibition Market

Emerging opportunities include:

  • Expansion into new markets: Untapped potential exists in developing economies with rising disposable incomes.
  • Adoption of new technologies: VR/AR and AI offer opportunities for enhanced experiences and increased efficiency.
  • Focus on sustainability: Eco-friendly events cater to growing environmental consciousness.
  • Personalization and data analytics: Tailored event experiences and data-driven insights improve engagement.

Leading Players in the Events and Exhibition Market Market

  • Deutsche Messe AG
  • GL Events
  • Messe Frankfurt GmbH
  • Viparis Holding
  • Comexposium Group
  • Koelnmesse GmbH
  • Messe Düsseldorf GmbH
  • Percept Limited
  • Fiera Milano SpA
  • MCH Group AG

Key Developments in Events and Exhibition Market Industry

  • November 2023: Art Design Chicago initiative showcases the city's artistic heritage, boosting local arts and cultural events.
  • November 2023: EventWorks and Quest Events merger expands full-service event offerings in the Southeast US.

Strategic Outlook for Events and Exhibition Market Market

The Events and Exhibition Market is poised for continued growth, driven by technological innovation, economic expansion, and evolving consumer preferences. The adoption of hybrid and virtual models expands market reach, while a focus on sustainability and personalized experiences enhances engagement. Companies that embrace these trends and adapt to the evolving landscape are best positioned for success in this dynamic market.

Events and Exhibition Market Segmentation

  • 1. Type
    • 1.1. B2B
    • 1.2. B2C
    • 1.3. Mixed/Hybrid
  • 2. Revenue Stream
    • 2.1. Exhibitor Fee
    • 2.2. Sponsorship Fee
    • 2.3. Entrance Fee
    • 2.4. Services
  • 3. End User
    • 3.1. Consumer Goods and Retail Sector
    • 3.2. Automotive and Transportation Sector
    • 3.3. Industrial
    • 3.4. Entertainment
    • 3.5. Real Estate and Property
    • 3.6. Hospitality Sector
    • 3.7. Other End Users

Events and Exhibition Market Segmentation By Geography

  • 1. North America
    • 1.1. United States
    • 1.2. Canada
  • 2. Europe
    • 2.1. Germany
    • 2.2. United Kingdom
    • 2.3. France
  • 3. Asia Pacific
    • 3.1. China
    • 3.2. Japan
    • 3.3. India
    • 3.4. South Korea
    • 3.5. Australia and New Zealand
  • 4. Latin America
  • 5. Middle East and Africa
Events and Exhibition Market Regional Share


Events and Exhibition Market REPORT HIGHLIGHTS

AspectsDetails
Study Period 2019-2033
Base Year 2024
Estimated Year 2025
Forecast Period2025-2033
Historical Period2019-2024
Growth RateCAGR of 5.29% from 2019-2033
Segmentation
    • By Type
      • B2B
      • B2C
      • Mixed/Hybrid
    • By Revenue Stream
      • Exhibitor Fee
      • Sponsorship Fee
      • Entrance Fee
      • Services
    • By End User
      • Consumer Goods and Retail Sector
      • Automotive and Transportation Sector
      • Industrial
      • Entertainment
      • Real Estate and Property
      • Hospitality Sector
      • Other End Users
  • By Geography
    • North America
      • United States
      • Canada
    • Europe
      • Germany
      • United Kingdom
      • France
    • Asia Pacific
      • China
      • Japan
      • India
      • South Korea
      • Australia and New Zealand
    • Latin America
    • Middle East and Africa


Table of Contents

  1. 1. Introduction
    • 1.1. Research Scope
    • 1.2. Market Segmentation
    • 1.3. Research Methodology
    • 1.4. Definitions and Assumptions
  2. 2. Executive Summary
    • 2.1. Introduction
  3. 3. Market Dynamics
    • 3.1. Introduction
      • 3.2. Market Drivers
        • 3.2.1. Growing Adoption of Geo-Cloning for Exhibition Organizers; Increasing Growth of Consumer Goods Penetrates the Growth of B2C Exhibition
      • 3.3. Market Restrains
        • 3.3.1. Loss Due to Restrictions of Smaller Players to Participate Owing to Potential Low Turnouts
      • 3.4. Market Trends
        • 3.4.1. Entertainment Sector to Witness Fastest Growth
  4. 4. Market Factor Analysis
    • 4.1. Porters Five Forces
    • 4.2. Supply/Value Chain
    • 4.3. PESTEL analysis
    • 4.4. Market Entropy
    • 4.5. Patent/Trademark Analysis
  5. 5. Global Events and Exhibition Market Analysis, Insights and Forecast, 2019-2031
    • 5.1. Market Analysis, Insights and Forecast - by Type
      • 5.1.1. B2B
      • 5.1.2. B2C
      • 5.1.3. Mixed/Hybrid
    • 5.2. Market Analysis, Insights and Forecast - by Revenue Stream
      • 5.2.1. Exhibitor Fee
      • 5.2.2. Sponsorship Fee
      • 5.2.3. Entrance Fee
      • 5.2.4. Services
    • 5.3. Market Analysis, Insights and Forecast - by End User
      • 5.3.1. Consumer Goods and Retail Sector
      • 5.3.2. Automotive and Transportation Sector
      • 5.3.3. Industrial
      • 5.3.4. Entertainment
      • 5.3.5. Real Estate and Property
      • 5.3.6. Hospitality Sector
      • 5.3.7. Other End Users
    • 5.4. Market Analysis, Insights and Forecast - by Region
      • 5.4.1. North America
      • 5.4.2. Europe
      • 5.4.3. Asia Pacific
      • 5.4.4. Latin America
      • 5.4.5. Middle East and Africa
  6. 6. North America Events and Exhibition Market Analysis, Insights and Forecast, 2019-2031
    • 6.1. Market Analysis, Insights and Forecast - by Type
      • 6.1.1. B2B
      • 6.1.2. B2C
      • 6.1.3. Mixed/Hybrid
    • 6.2. Market Analysis, Insights and Forecast - by Revenue Stream
      • 6.2.1. Exhibitor Fee
      • 6.2.2. Sponsorship Fee
      • 6.2.3. Entrance Fee
      • 6.2.4. Services
    • 6.3. Market Analysis, Insights and Forecast - by End User
      • 6.3.1. Consumer Goods and Retail Sector
      • 6.3.2. Automotive and Transportation Sector
      • 6.3.3. Industrial
      • 6.3.4. Entertainment
      • 6.3.5. Real Estate and Property
      • 6.3.6. Hospitality Sector
      • 6.3.7. Other End Users
  7. 7. Europe Events and Exhibition Market Analysis, Insights and Forecast, 2019-2031
    • 7.1. Market Analysis, Insights and Forecast - by Type
      • 7.1.1. B2B
      • 7.1.2. B2C
      • 7.1.3. Mixed/Hybrid
    • 7.2. Market Analysis, Insights and Forecast - by Revenue Stream
      • 7.2.1. Exhibitor Fee
      • 7.2.2. Sponsorship Fee
      • 7.2.3. Entrance Fee
      • 7.2.4. Services
    • 7.3. Market Analysis, Insights and Forecast - by End User
      • 7.3.1. Consumer Goods and Retail Sector
      • 7.3.2. Automotive and Transportation Sector
      • 7.3.3. Industrial
      • 7.3.4. Entertainment
      • 7.3.5. Real Estate and Property
      • 7.3.6. Hospitality Sector
      • 7.3.7. Other End Users
  8. 8. Asia Pacific Events and Exhibition Market Analysis, Insights and Forecast, 2019-2031
    • 8.1. Market Analysis, Insights and Forecast - by Type
      • 8.1.1. B2B
      • 8.1.2. B2C
      • 8.1.3. Mixed/Hybrid
    • 8.2. Market Analysis, Insights and Forecast - by Revenue Stream
      • 8.2.1. Exhibitor Fee
      • 8.2.2. Sponsorship Fee
      • 8.2.3. Entrance Fee
      • 8.2.4. Services
    • 8.3. Market Analysis, Insights and Forecast - by End User
      • 8.3.1. Consumer Goods and Retail Sector
      • 8.3.2. Automotive and Transportation Sector
      • 8.3.3. Industrial
      • 8.3.4. Entertainment
      • 8.3.5. Real Estate and Property
      • 8.3.6. Hospitality Sector
      • 8.3.7. Other End Users
  9. 9. Latin America Events and Exhibition Market Analysis, Insights and Forecast, 2019-2031
    • 9.1. Market Analysis, Insights and Forecast - by Type
      • 9.1.1. B2B
      • 9.1.2. B2C
      • 9.1.3. Mixed/Hybrid
    • 9.2. Market Analysis, Insights and Forecast - by Revenue Stream
      • 9.2.1. Exhibitor Fee
      • 9.2.2. Sponsorship Fee
      • 9.2.3. Entrance Fee
      • 9.2.4. Services
    • 9.3. Market Analysis, Insights and Forecast - by End User
      • 9.3.1. Consumer Goods and Retail Sector
      • 9.3.2. Automotive and Transportation Sector
      • 9.3.3. Industrial
      • 9.3.4. Entertainment
      • 9.3.5. Real Estate and Property
      • 9.3.6. Hospitality Sector
      • 9.3.7. Other End Users
  10. 10. Middle East and Africa Events and Exhibition Market Analysis, Insights and Forecast, 2019-2031
    • 10.1. Market Analysis, Insights and Forecast - by Type
      • 10.1.1. B2B
      • 10.1.2. B2C
      • 10.1.3. Mixed/Hybrid
    • 10.2. Market Analysis, Insights and Forecast - by Revenue Stream
      • 10.2.1. Exhibitor Fee
      • 10.2.2. Sponsorship Fee
      • 10.2.3. Entrance Fee
      • 10.2.4. Services
    • 10.3. Market Analysis, Insights and Forecast - by End User
      • 10.3.1. Consumer Goods and Retail Sector
      • 10.3.2. Automotive and Transportation Sector
      • 10.3.3. Industrial
      • 10.3.4. Entertainment
      • 10.3.5. Real Estate and Property
      • 10.3.6. Hospitality Sector
      • 10.3.7. Other End Users
  11. 11. North America Events and Exhibition Market Analysis, Insights and Forecast, 2019-2031
      • 11.1. Market Analysis, Insights and Forecast - By Country/Sub-region
        • 11.1.1 United States
        • 11.1.2 Canada
        • 11.1.3 Mexico
  12. 12. Europe Events and Exhibition Market Analysis, Insights and Forecast, 2019-2031
      • 12.1. Market Analysis, Insights and Forecast - By Country/Sub-region
        • 12.1.1 Germany
        • 12.1.2 United Kingdom
        • 12.1.3 France
        • 12.1.4 Spain
        • 12.1.5 Italy
        • 12.1.6 Spain
        • 12.1.7 Belgium
        • 12.1.8 Netherland
        • 12.1.9 Nordics
        • 12.1.10 Rest of Europe
  13. 13. Asia Pacific Events and Exhibition Market Analysis, Insights and Forecast, 2019-2031
      • 13.1. Market Analysis, Insights and Forecast - By Country/Sub-region
        • 13.1.1 China
        • 13.1.2 Japan
        • 13.1.3 India
        • 13.1.4 South Korea
        • 13.1.5 Southeast Asia
        • 13.1.6 Australia
        • 13.1.7 Indonesia
        • 13.1.8 Phillipes
        • 13.1.9 Singapore
        • 13.1.10 Thailandc
        • 13.1.11 Rest of Asia Pacific
  14. 14. South America Events and Exhibition Market Analysis, Insights and Forecast, 2019-2031
      • 14.1. Market Analysis, Insights and Forecast - By Country/Sub-region
        • 14.1.1 Brazil
        • 14.1.2 Argentina
        • 14.1.3 Peru
        • 14.1.4 Chile
        • 14.1.5 Colombia
        • 14.1.6 Ecuador
        • 14.1.7 Venezuela
        • 14.1.8 Rest of South America
  15. 15. North America Events and Exhibition Market Analysis, Insights and Forecast, 2019-2031
      • 15.1. Market Analysis, Insights and Forecast - By Country/Sub-region
        • 15.1.1 United States
        • 15.1.2 Canada
        • 15.1.3 Mexico
  16. 16. MEA Events and Exhibition Market Analysis, Insights and Forecast, 2019-2031
      • 16.1. Market Analysis, Insights and Forecast - By Country/Sub-region
        • 16.1.1 United Arab Emirates
        • 16.1.2 Saudi Arabia
        • 16.1.3 South Africa
        • 16.1.4 Rest of Middle East and Africa
  17. 17. Competitive Analysis
    • 17.1. Global Market Share Analysis 2024
      • 17.2. Company Profiles
        • 17.2.1 Deutsche Messe AG
          • 17.2.1.1. Overview
          • 17.2.1.2. Products
          • 17.2.1.3. SWOT Analysis
          • 17.2.1.4. Recent Developments
          • 17.2.1.5. Financials (Based on Availability)
        • 17.2.2 GL Events
          • 17.2.2.1. Overview
          • 17.2.2.2. Products
          • 17.2.2.3. SWOT Analysis
          • 17.2.2.4. Recent Developments
          • 17.2.2.5. Financials (Based on Availability)
        • 17.2.3 Messe Frankfurt GmbH
          • 17.2.3.1. Overview
          • 17.2.3.2. Products
          • 17.2.3.3. SWOT Analysis
          • 17.2.3.4. Recent Developments
          • 17.2.3.5. Financials (Based on Availability)
        • 17.2.4 Viparis Holding
          • 17.2.4.1. Overview
          • 17.2.4.2. Products
          • 17.2.4.3. SWOT Analysis
          • 17.2.4.4. Recent Developments
          • 17.2.4.5. Financials (Based on Availability)
        • 17.2.5 Comexposium Grou
          • 17.2.5.1. Overview
          • 17.2.5.2. Products
          • 17.2.5.3. SWOT Analysis
          • 17.2.5.4. Recent Developments
          • 17.2.5.5. Financials (Based on Availability)
        • 17.2.6 Koelnmesse GmbH
          • 17.2.6.1. Overview
          • 17.2.6.2. Products
          • 17.2.6.3. SWOT Analysis
          • 17.2.6.4. Recent Developments
          • 17.2.6.5. Financials (Based on Availability)
        • 17.2.7 Messe Dsseldorf GmbH
          • 17.2.7.1. Overview
          • 17.2.7.2. Products
          • 17.2.7.3. SWOT Analysis
          • 17.2.7.4. Recent Developments
          • 17.2.7.5. Financials (Based on Availability)
        • 17.2.8 Percept Limited
          • 17.2.8.1. Overview
          • 17.2.8.2. Products
          • 17.2.8.3. SWOT Analysis
          • 17.2.8.4. Recent Developments
          • 17.2.8.5. Financials (Based on Availability)
        • 17.2.9 Fiera Milano SpA
          • 17.2.9.1. Overview
          • 17.2.9.2. Products
          • 17.2.9.3. SWOT Analysis
          • 17.2.9.4. Recent Developments
          • 17.2.9.5. Financials (Based on Availability)
        • 17.2.10 MCH Group AG
          • 17.2.10.1. Overview
          • 17.2.10.2. Products
          • 17.2.10.3. SWOT Analysis
          • 17.2.10.4. Recent Developments
          • 17.2.10.5. Financials (Based on Availability)

List of Figures

  1. Figure 1: Global Events and Exhibition Market Revenue Breakdown (Million, %) by Region 2024 & 2032
  2. Figure 2: North America Events and Exhibition Market Revenue (Million), by Country 2024 & 2032
  3. Figure 3: North America Events and Exhibition Market Revenue Share (%), by Country 2024 & 2032
  4. Figure 4: Europe Events and Exhibition Market Revenue (Million), by Country 2024 & 2032
  5. Figure 5: Europe Events and Exhibition Market Revenue Share (%), by Country 2024 & 2032
  6. Figure 6: Asia Pacific Events and Exhibition Market Revenue (Million), by Country 2024 & 2032
  7. Figure 7: Asia Pacific Events and Exhibition Market Revenue Share (%), by Country 2024 & 2032
  8. Figure 8: South America Events and Exhibition Market Revenue (Million), by Country 2024 & 2032
  9. Figure 9: South America Events and Exhibition Market Revenue Share (%), by Country 2024 & 2032
  10. Figure 10: North America Events and Exhibition Market Revenue (Million), by Country 2024 & 2032
  11. Figure 11: North America Events and Exhibition Market Revenue Share (%), by Country 2024 & 2032
  12. Figure 12: MEA Events and Exhibition Market Revenue (Million), by Country 2024 & 2032
  13. Figure 13: MEA Events and Exhibition Market Revenue Share (%), by Country 2024 & 2032
  14. Figure 14: North America Events and Exhibition Market Revenue (Million), by Type 2024 & 2032
  15. Figure 15: North America Events and Exhibition Market Revenue Share (%), by Type 2024 & 2032
  16. Figure 16: North America Events and Exhibition Market Revenue (Million), by Revenue Stream 2024 & 2032
  17. Figure 17: North America Events and Exhibition Market Revenue Share (%), by Revenue Stream 2024 & 2032
  18. Figure 18: North America Events and Exhibition Market Revenue (Million), by End User 2024 & 2032
  19. Figure 19: North America Events and Exhibition Market Revenue Share (%), by End User 2024 & 2032
  20. Figure 20: North America Events and Exhibition Market Revenue (Million), by Country 2024 & 2032
  21. Figure 21: North America Events and Exhibition Market Revenue Share (%), by Country 2024 & 2032
  22. Figure 22: Europe Events and Exhibition Market Revenue (Million), by Type 2024 & 2032
  23. Figure 23: Europe Events and Exhibition Market Revenue Share (%), by Type 2024 & 2032
  24. Figure 24: Europe Events and Exhibition Market Revenue (Million), by Revenue Stream 2024 & 2032
  25. Figure 25: Europe Events and Exhibition Market Revenue Share (%), by Revenue Stream 2024 & 2032
  26. Figure 26: Europe Events and Exhibition Market Revenue (Million), by End User 2024 & 2032
  27. Figure 27: Europe Events and Exhibition Market Revenue Share (%), by End User 2024 & 2032
  28. Figure 28: Europe Events and Exhibition Market Revenue (Million), by Country 2024 & 2032
  29. Figure 29: Europe Events and Exhibition Market Revenue Share (%), by Country 2024 & 2032
  30. Figure 30: Asia Pacific Events and Exhibition Market Revenue (Million), by Type 2024 & 2032
  31. Figure 31: Asia Pacific Events and Exhibition Market Revenue Share (%), by Type 2024 & 2032
  32. Figure 32: Asia Pacific Events and Exhibition Market Revenue (Million), by Revenue Stream 2024 & 2032
  33. Figure 33: Asia Pacific Events and Exhibition Market Revenue Share (%), by Revenue Stream 2024 & 2032
  34. Figure 34: Asia Pacific Events and Exhibition Market Revenue (Million), by End User 2024 & 2032
  35. Figure 35: Asia Pacific Events and Exhibition Market Revenue Share (%), by End User 2024 & 2032
  36. Figure 36: Asia Pacific Events and Exhibition Market Revenue (Million), by Country 2024 & 2032
  37. Figure 37: Asia Pacific Events and Exhibition Market Revenue Share (%), by Country 2024 & 2032
  38. Figure 38: Latin America Events and Exhibition Market Revenue (Million), by Type 2024 & 2032
  39. Figure 39: Latin America Events and Exhibition Market Revenue Share (%), by Type 2024 & 2032
  40. Figure 40: Latin America Events and Exhibition Market Revenue (Million), by Revenue Stream 2024 & 2032
  41. Figure 41: Latin America Events and Exhibition Market Revenue Share (%), by Revenue Stream 2024 & 2032
  42. Figure 42: Latin America Events and Exhibition Market Revenue (Million), by End User 2024 & 2032
  43. Figure 43: Latin America Events and Exhibition Market Revenue Share (%), by End User 2024 & 2032
  44. Figure 44: Latin America Events and Exhibition Market Revenue (Million), by Country 2024 & 2032
  45. Figure 45: Latin America Events and Exhibition Market Revenue Share (%), by Country 2024 & 2032
  46. Figure 46: Middle East and Africa Events and Exhibition Market Revenue (Million), by Type 2024 & 2032
  47. Figure 47: Middle East and Africa Events and Exhibition Market Revenue Share (%), by Type 2024 & 2032
  48. Figure 48: Middle East and Africa Events and Exhibition Market Revenue (Million), by Revenue Stream 2024 & 2032
  49. Figure 49: Middle East and Africa Events and Exhibition Market Revenue Share (%), by Revenue Stream 2024 & 2032
  50. Figure 50: Middle East and Africa Events and Exhibition Market Revenue (Million), by End User 2024 & 2032
  51. Figure 51: Middle East and Africa Events and Exhibition Market Revenue Share (%), by End User 2024 & 2032
  52. Figure 52: Middle East and Africa Events and Exhibition Market Revenue (Million), by Country 2024 & 2032
  53. Figure 53: Middle East and Africa Events and Exhibition Market Revenue Share (%), by Country 2024 & 2032

List of Tables

  1. Table 1: Global Events and Exhibition Market Revenue Million Forecast, by Region 2019 & 2032
  2. Table 2: Global Events and Exhibition Market Revenue Million Forecast, by Type 2019 & 2032
  3. Table 3: Global Events and Exhibition Market Revenue Million Forecast, by Revenue Stream 2019 & 2032
  4. Table 4: Global Events and Exhibition Market Revenue Million Forecast, by End User 2019 & 2032
  5. Table 5: Global Events and Exhibition Market Revenue Million Forecast, by Region 2019 & 2032
  6. Table 6: Global Events and Exhibition Market Revenue Million Forecast, by Country 2019 & 2032
  7. Table 7: United States Events and Exhibition Market Revenue (Million) Forecast, by Application 2019 & 2032
  8. Table 8: Canada Events and Exhibition Market Revenue (Million) Forecast, by Application 2019 & 2032
  9. Table 9: Mexico Events and Exhibition Market Revenue (Million) Forecast, by Application 2019 & 2032
  10. Table 10: Global Events and Exhibition Market Revenue Million Forecast, by Country 2019 & 2032
  11. Table 11: Germany Events and Exhibition Market Revenue (Million) Forecast, by Application 2019 & 2032
  12. Table 12: United Kingdom Events and Exhibition Market Revenue (Million) Forecast, by Application 2019 & 2032
  13. Table 13: France Events and Exhibition Market Revenue (Million) Forecast, by Application 2019 & 2032
  14. Table 14: Spain Events and Exhibition Market Revenue (Million) Forecast, by Application 2019 & 2032
  15. Table 15: Italy Events and Exhibition Market Revenue (Million) Forecast, by Application 2019 & 2032
  16. Table 16: Spain Events and Exhibition Market Revenue (Million) Forecast, by Application 2019 & 2032
  17. Table 17: Belgium Events and Exhibition Market Revenue (Million) Forecast, by Application 2019 & 2032
  18. Table 18: Netherland Events and Exhibition Market Revenue (Million) Forecast, by Application 2019 & 2032
  19. Table 19: Nordics Events and Exhibition Market Revenue (Million) Forecast, by Application 2019 & 2032
  20. Table 20: Rest of Europe Events and Exhibition Market Revenue (Million) Forecast, by Application 2019 & 2032
  21. Table 21: Global Events and Exhibition Market Revenue Million Forecast, by Country 2019 & 2032
  22. Table 22: China Events and Exhibition Market Revenue (Million) Forecast, by Application 2019 & 2032
  23. Table 23: Japan Events and Exhibition Market Revenue (Million) Forecast, by Application 2019 & 2032
  24. Table 24: India Events and Exhibition Market Revenue (Million) Forecast, by Application 2019 & 2032
  25. Table 25: South Korea Events and Exhibition Market Revenue (Million) Forecast, by Application 2019 & 2032
  26. Table 26: Southeast Asia Events and Exhibition Market Revenue (Million) Forecast, by Application 2019 & 2032
  27. Table 27: Australia Events and Exhibition Market Revenue (Million) Forecast, by Application 2019 & 2032
  28. Table 28: Indonesia Events and Exhibition Market Revenue (Million) Forecast, by Application 2019 & 2032
  29. Table 29: Phillipes Events and Exhibition Market Revenue (Million) Forecast, by Application 2019 & 2032
  30. Table 30: Singapore Events and Exhibition Market Revenue (Million) Forecast, by Application 2019 & 2032
  31. Table 31: Thailandc Events and Exhibition Market Revenue (Million) Forecast, by Application 2019 & 2032
  32. Table 32: Rest of Asia Pacific Events and Exhibition Market Revenue (Million) Forecast, by Application 2019 & 2032
  33. Table 33: Global Events and Exhibition Market Revenue Million Forecast, by Country 2019 & 2032
  34. Table 34: Brazil Events and Exhibition Market Revenue (Million) Forecast, by Application 2019 & 2032
  35. Table 35: Argentina Events and Exhibition Market Revenue (Million) Forecast, by Application 2019 & 2032
  36. Table 36: Peru Events and Exhibition Market Revenue (Million) Forecast, by Application 2019 & 2032
  37. Table 37: Chile Events and Exhibition Market Revenue (Million) Forecast, by Application 2019 & 2032
  38. Table 38: Colombia Events and Exhibition Market Revenue (Million) Forecast, by Application 2019 & 2032
  39. Table 39: Ecuador Events and Exhibition Market Revenue (Million) Forecast, by Application 2019 & 2032
  40. Table 40: Venezuela Events and Exhibition Market Revenue (Million) Forecast, by Application 2019 & 2032
  41. Table 41: Rest of South America Events and Exhibition Market Revenue (Million) Forecast, by Application 2019 & 2032
  42. Table 42: Global Events and Exhibition Market Revenue Million Forecast, by Country 2019 & 2032
  43. Table 43: United States Events and Exhibition Market Revenue (Million) Forecast, by Application 2019 & 2032
  44. Table 44: Canada Events and Exhibition Market Revenue (Million) Forecast, by Application 2019 & 2032
  45. Table 45: Mexico Events and Exhibition Market Revenue (Million) Forecast, by Application 2019 & 2032
  46. Table 46: Global Events and Exhibition Market Revenue Million Forecast, by Country 2019 & 2032
  47. Table 47: United Arab Emirates Events and Exhibition Market Revenue (Million) Forecast, by Application 2019 & 2032
  48. Table 48: Saudi Arabia Events and Exhibition Market Revenue (Million) Forecast, by Application 2019 & 2032
  49. Table 49: South Africa Events and Exhibition Market Revenue (Million) Forecast, by Application 2019 & 2032
  50. Table 50: Rest of Middle East and Africa Events and Exhibition Market Revenue (Million) Forecast, by Application 2019 & 2032
  51. Table 51: Global Events and Exhibition Market Revenue Million Forecast, by Type 2019 & 2032
  52. Table 52: Global Events and Exhibition Market Revenue Million Forecast, by Revenue Stream 2019 & 2032
  53. Table 53: Global Events and Exhibition Market Revenue Million Forecast, by End User 2019 & 2032
  54. Table 54: Global Events and Exhibition Market Revenue Million Forecast, by Country 2019 & 2032
  55. Table 55: United States Events and Exhibition Market Revenue (Million) Forecast, by Application 2019 & 2032
  56. Table 56: Canada Events and Exhibition Market Revenue (Million) Forecast, by Application 2019 & 2032
  57. Table 57: Global Events and Exhibition Market Revenue Million Forecast, by Type 2019 & 2032
  58. Table 58: Global Events and Exhibition Market Revenue Million Forecast, by Revenue Stream 2019 & 2032
  59. Table 59: Global Events and Exhibition Market Revenue Million Forecast, by End User 2019 & 2032
  60. Table 60: Global Events and Exhibition Market Revenue Million Forecast, by Country 2019 & 2032
  61. Table 61: Germany Events and Exhibition Market Revenue (Million) Forecast, by Application 2019 & 2032
  62. Table 62: United Kingdom Events and Exhibition Market Revenue (Million) Forecast, by Application 2019 & 2032
  63. Table 63: France Events and Exhibition Market Revenue (Million) Forecast, by Application 2019 & 2032
  64. Table 64: Global Events and Exhibition Market Revenue Million Forecast, by Type 2019 & 2032
  65. Table 65: Global Events and Exhibition Market Revenue Million Forecast, by Revenue Stream 2019 & 2032
  66. Table 66: Global Events and Exhibition Market Revenue Million Forecast, by End User 2019 & 2032
  67. Table 67: Global Events and Exhibition Market Revenue Million Forecast, by Country 2019 & 2032
  68. Table 68: China Events and Exhibition Market Revenue (Million) Forecast, by Application 2019 & 2032
  69. Table 69: Japan Events and Exhibition Market Revenue (Million) Forecast, by Application 2019 & 2032
  70. Table 70: India Events and Exhibition Market Revenue (Million) Forecast, by Application 2019 & 2032
  71. Table 71: South Korea Events and Exhibition Market Revenue (Million) Forecast, by Application 2019 & 2032
  72. Table 72: Australia and New Zealand Events and Exhibition Market Revenue (Million) Forecast, by Application 2019 & 2032
  73. Table 73: Global Events and Exhibition Market Revenue Million Forecast, by Type 2019 & 2032
  74. Table 74: Global Events and Exhibition Market Revenue Million Forecast, by Revenue Stream 2019 & 2032
  75. Table 75: Global Events and Exhibition Market Revenue Million Forecast, by End User 2019 & 2032
  76. Table 76: Global Events and Exhibition Market Revenue Million Forecast, by Country 2019 & 2032
  77. Table 77: Global Events and Exhibition Market Revenue Million Forecast, by Type 2019 & 2032
  78. Table 78: Global Events and Exhibition Market Revenue Million Forecast, by Revenue Stream 2019 & 2032
  79. Table 79: Global Events and Exhibition Market Revenue Million Forecast, by End User 2019 & 2032
  80. Table 80: Global Events and Exhibition Market Revenue Million Forecast, by Country 2019 & 2032


Frequently Asked Questions

1. What is the projected Compound Annual Growth Rate (CAGR) of the Events and Exhibition Market?

The projected CAGR is approximately 5.29%.

2. Which companies are prominent players in the Events and Exhibition Market?

Key companies in the market include Deutsche Messe AG, GL Events, Messe Frankfurt GmbH, Viparis Holding, Comexposium Grou, Koelnmesse GmbH, Messe Dsseldorf GmbH, Percept Limited, Fiera Milano SpA, MCH Group AG.

3. What are the main segments of the Events and Exhibition Market?

The market segments include Type, Revenue Stream, End User.

4. Can you provide details about the market size?

The market size is estimated to be USD 54.30 Million as of 2022.

5. What are some drivers contributing to market growth?

Growing Adoption of Geo-Cloning for Exhibition Organizers; Increasing Growth of Consumer Goods Penetrates the Growth of B2C Exhibition.

6. What are the notable trends driving market growth?

Entertainment Sector to Witness Fastest Growth.

7. Are there any restraints impacting market growth?

Loss Due to Restrictions of Smaller Players to Participate Owing to Potential Low Turnouts.

8. Can you provide examples of recent developments in the market?

November 2023 - Art Design Chicago, an initiative of the Terra Foundation for American Art in partnership with local artists and arts organizations, is a citywide collaboration and series of events and exhibitions that highlight the voices and stories that are part of the city's unique artistic heritage and creative communities. Continuing into 2025, more than 50 Chicago-area arts organizations across 30 Chicago neighborhoods and several suburban communities showcase the work of hundreds of artists.

9. What pricing options are available for accessing the report?

Pricing options include single-user, multi-user, and enterprise licenses priced at USD 4750, USD 5250, and USD 8750 respectively.

10. Is the market size provided in terms of value or volume?

The market size is provided in terms of value, measured in Million.

11. Are there any specific market keywords associated with the report?

Yes, the market keyword associated with the report is "Events and Exhibition Market," which aids in identifying and referencing the specific market segment covered.

12. How do I determine which pricing option suits my needs best?

The pricing options vary based on user requirements and access needs. Individual users may opt for single-user licenses, while businesses requiring broader access may choose multi-user or enterprise licenses for cost-effective access to the report.

13. Are there any additional resources or data provided in the Events and Exhibition Market report?

While the report offers comprehensive insights, it's advisable to review the specific contents or supplementary materials provided to ascertain if additional resources or data are available.

14. How can I stay updated on further developments or reports in the Events and Exhibition Market?

To stay informed about further developments, trends, and reports in the Events and Exhibition Market, consider subscribing to industry newsletters, following relevant companies and organizations, or regularly checking reputable industry news sources and publications.


Methodology

Step 1 - Identification of Relevant Samples Size from Population Database

Step Chart
Bar Chart
Method Chart

Step 2 - Approaches for Defining Global Market Size (Value, Volume* & Price*)

Approach Chart
Top-down and bottom-up approaches are used to validate the global market size and estimate the market size for manufactures, regional segments, product, and application.

Note*: In applicable scenarios

Step 3 - Data Sources

Primary Research

  • Web Analytics
  • Survey Reports
  • Research Institute
  • Latest Research Reports
  • Opinion Leaders

Secondary Research

  • Annual Reports
  • White Paper
  • Latest Press Release
  • Industry Association
  • Paid Database
  • Investor Presentations
Analyst Chart

Step 4 - Data Triangulation

Involves using different sources of information in order to increase the validity of a study

These sources are likely to be stakeholders in a program - participants, other researchers, program staff, other community members, and so on.

Then we put all data in single framework & apply various statistical tools to find out the dynamic on the market.

During the analysis stage, feedback from the stakeholder groups would be compared to determine areas of agreement as well as areas of divergence

Additionally, after gathering mixed and scattered data from a wide range of sources, data is triangulated and correlated to come up with estimated figures which are further validated through primary mediums or industry experts, opinion leaders.

About Research Axiom

Research Axiom delivers in-depth market research, industry analysis, and consulting for pharmaceuticals, automotive, IT, and consumer goods. Our reports provide the clarity you need to make informed decisions and drive innovation.

Our team combines primary research, advanced analytics, and sector expertise to deliver actionable intelligence. We offer syndicated reports, custom research, and consulting services tailored to your business needs.

At Research Axiom, we are committed to quality, transparency, and client satisfaction. Every report is rigorously validated to ensure accuracy and relevance. Our global perspective and local expertise help you understand both the big picture and the finer details of your market.

Stay informed with Research Axiom. Subscribe to our newsletter for the latest updates and research highlights, and follow us on social media for real-time insights. Research Axiom – Turning Data into Business Advantage.

artwork spiralartwork spiralRelated Reports
artwork underline

Strategic Insights for Philippines Data Center Server Market Market Growth

Explore the dynamic Philippines Data Center Server Market, featuring a robust CAGR of 19.90% and a projected market size of $1.5 billion by 2025. Discover key drivers like digitalization, cloud adoption, and IT infrastructure expansion, along with market trends and essential segments.

December 2025
Base Year: 2024
No Of Pages: 197
Price: $3800

Unveiling Photodiode Sensors Market Growth Patterns: CAGR Analysis and Forecasts 2025-2033

Explore the dynamic Photodiode Sensors Market forecast (2025-2033), driven by 7.26% CAGR. Discover key drivers, restraints, sensor types, and industry applications, with market size and regional share insights.

December 2025
Base Year: 2024
No Of Pages: 234
Price: $4750

India Engineering Research And Development (ER&D) Services Market Strategic Insights for 2025 and Forecasts to 2033: Market Trends

Explore the India ER&D Services Market analysis, uncovering key insights, market size projections to 2033, drivers, trends, and growth opportunities in engineering research and development services.

December 2025
Base Year: 2024
No Of Pages: 234
Price: $4750

Asia Pacific Mobile Virtual Network Operator (MVNO) Market Analysis Report 2025: Market to Grow by a CAGR of XX to 2033, Driven by Government Incentives, Popularity of Virtual Assistants, and Strategic Partnerships

Explore the dynamic Asia Pacific MVNO market forecast 2025-2033, driven by affordable mobile services and enterprise solutions. Discover market size, CAGR, key trends, and leading companies in this rapidly growing sector.

December 2025
Base Year: 2024
No Of Pages: 234
Price: $4750

Exploring Consumer Shifts in Pipeline Transportation Software Market Market 2025-2033

The size of the Pipeline Transportation Software Market market was valued at USD 96.29 Million in 2024 and is projected to reach USD 166.42 Million by 2033, with an expected CAGR of 8.13% during the forecast period.

December 2025
Base Year: 2024
No Of Pages: 234
Price: $4750

Outsourcing Services Market Is Set To Reach XXX Million By 2033, Growing At A CAGR Of XX

Explore the global Outsourcing Services Market analysis, including market size, CAGR of 6.40%, key drivers, trends, and segments like BPO, ITO, and KPO. Get insights into regional growth and leading companies.

December 2025
Base Year: 2024
No Of Pages: 234
Price: $4750

Exploring Innovations in Passive Biometrics Verification Industry: Market Dynamics 2025-2033

Discover the explosive growth of the Passive Biometrics Verification market, driven by AI, cloud adoption, and the need for seamless security. Explore market size, CAGR, drivers, and leading companies shaping the future of authentication.

December 2025
Base Year: 2024
No Of Pages: 234
Price: $4750

Analyzing Competitor Moves: Africa Data Center Server Market Growth Outlook 2025-2033

The size of the Africa Data Center Server Market market was valued at USD XX Million in 2024 and is projected to reach USD XXX Million by 2033, with an expected CAGR of 15.40% during the forecast period.

December 2025
Base Year: 2024
No Of Pages: 234
Price: $4750

Vietnam Data Center Rack Market Market’s Strategic Roadmap: Insights for 2025-2033

The size of the Vietnam Data Center Rack Market market was valued at USD XX Million in 2024 and is projected to reach USD XXX Million by 2033, with an expected CAGR of 7.70% during the forecast period.

December 2025
Base Year: 2024
No Of Pages: 197
Price: $3800

Professional Microphone Market Industry Analysis and Consumer Behavior

The size of the Professional Microphone Market market was valued at USD XX Million in 2024 and is projected to reach USD XXX Million by 2033, with an expected CAGR of 5.80% during the forecast period.

December 2025
Base Year: 2024
No Of Pages: 234
Price: $4750

Market Deep Dive: Exploring India Industrial Sensors and Transmitters Market Trends 2025-2033

Explore the booming India industrial sensors and transmitters market, projected at $1.25 billion with a 9.37% CAGR. Discover key drivers, trends, and segments fueling this growth.

December 2025
Base Year: 2024
No Of Pages: 197
Price: $3800

Strategic Growth Drivers for Infrastructure Monitoring Market Software Market Market

Explore the dynamic Infrastructure Monitoring Market Software, projected for significant growth driven by digital transformation and smart technologies. Discover key trends, drivers, and regional market share.

December 2025
Base Year: 2024
No Of Pages: 234
Price: $4750

Latin America Smartwatch Industry Market Consumption Trends: Growth Analysis 2025-2033

The size of the Latin America Smartwatch Industry market was valued at USD XX Million in 2024 and is projected to reach USD XXX Million by 2033, with an expected CAGR of 13.40% during the forecast period.

December 2025
Base Year: 2024
No Of Pages: 210
Price: $4750

ANZ Geospatial Analytics Market Market Overview: Growth and Insights

Explore the booming ANZ Geospatial Analytics Market, forecast to reach USD 1.33 billion by 2033 with a 9.13% CAGR. Discover key drivers, trends, and segments shaping this vital industry.

December 2025
Base Year: 2024
No Of Pages: 210
Price: $4750

BLE Beacon Industry Analysis Uncovered: Market Drivers and Forecasts 2025-2033

Explore the booming BLE Beacon market, driven by retail innovation, smart cities, and advanced indoor positioning. Discover market size, CAGR, key drivers, and regional trends shaping this dynamic industry.

December 2025
Base Year: 2024
No Of Pages: 234
Price: $4750

Growth Trajectories in US Electrical Enclosures Industry: Industry Outlook to 2033

The size of the US Electrical Enclosures Industry market was valued at USD 1.95 Million in 2024 and is projected to reach USD 3.32 Million by 2033, with an expected CAGR of 7.91% during the forecast period.

December 2025
Base Year: 2024
No Of Pages: 197
Price: $3800

Exploring Consumer Shifts in US Marketing Analytics Industry Market 2025-2033

The size of the US Marketing Analytics Industry market was valued at USD 4.66 Million in 2024 and is projected to reach USD XXX Million by 2033, with an expected CAGR of 12.73">> 12.73% during the forecast period.

December 2025
Base Year: 2024
No Of Pages: 197
Price: $3800

VCSEL Market Market Expansion: Growth Outlook 2025-2033

Explore the booming VCSEL market, projected for 18.60% CAGR growth through 2033. Discover key drivers like 5G, AI, and autonomous vehicles, and analyze growth in telecom, automotive, and consumer electronics.

December 2025
Base Year: 2024
No Of Pages: 234
Price: $4750

Cone Crushers Industry Market Size and Trends 2025-2033: Comprehensive Outlook

The size of the Cone Crushers Industry market was valued at USD 1.86 Million in 2024 and is projected to reach USD 2.63 Million by 2033, with an expected CAGR of 5.10% during the forecast period.

December 2025
Base Year: 2024
No Of Pages: 234
Price: $4750

Exploring SEA Digital Transformation Market Growth Trajectories: CAGR Insights 2025-2033

Explore the dynamic global digital transformation market, projected to reach $53.96 billion with a 19.51% CAGR. Discover key drivers like XR, IoT, AI, Blockchain, and emerging trends shaping industries from manufacturing to healthcare.

December 2025
Base Year: 2024
No Of Pages: 197
Price: $3800

Albania E-commerce Industry Market’s Consumer Insights and Trends

Explore the booming Albania e-commerce market with a projected CAGR of 11.90%. Discover key drivers, emerging trends in beauty, fashion, and electronics, and expert insights for businesses and consumers.

December 2025
Base Year: 2024
No Of Pages: 197
Price: $3800

M2M Connections Industry Growth Opportunities: Market Size Forecast to 2033

The size of the M2M Connections Industry market was valued at USD 37.30 Million in 2024 and is projected to reach USD 60.84 Million by 2033, with an expected CAGR of 7.24% during the forecast period.

December 2025
Base Year: 2024
No Of Pages: 234
Price: $4750

Market Deep Dive: Exploring Smart Food Logistics Market Trends 2025-2033

Explore the rapidly growing Smart Food Logistics Market, projected to reach $13.80 billion with a 14.61% CAGR. Discover key drivers, technologies like IoT and AI, and market trends impacting food supply chain efficiency and safety.

December 2025
Base Year: 2024
No Of Pages: 234
Price: $4750

Demand Patterns in Latvia Facility Management Market Market: Projections to 2033

Explore the dynamic Latvia Facility Management market analysis, key insights, market size, drivers, and trends from 2019-2033. Discover growth opportunities in integrated FM solutions.

December 2025
Base Year: 2024
No Of Pages: 197
Price: $3800

Future-Forward Strategies for Asia Pacific LED Packaging Market Industry

Explore the dynamic Asia Pacific LED Packaging Market, projected to reach over USD 12,500 million by 2025. Discover key growth drivers, segment insights (COB, SMD, CSP), leading companies, and future trends shaping this 6.70% CAGR market through 2033.

December 2025
Base Year: 2024
No Of Pages: 210
Price: $4750

Strategic Projections for Smart E-Drive Market Market Expansion

Explore the dynamic Smart E-Drive market forecast, drivers, and trends from 2019-2033. Discover key insights, market size, and regional analysis for AC drives, DC drives, and servo drives.

December 2025
Base Year: 2024
No Of Pages: 234
Price: $4750

Smart Garage Door Opener And Controller Market Market Demand Dynamics: Insights 2025-2033

Explore the booming Smart Garage Door Opener and Controller Market trends, driven by security and convenience. Discover market size, CAGR 9.43%, and growth drivers like Wi-Fi and Bluetooth technology.

December 2025
Base Year: 2024
No Of Pages: 234
Price: $4750

Night Vision Cameras Market Insightful Analysis: Trends, Competitor Dynamics, and Opportunities 2025-2033

The size of the Night Vision Cameras Market market was valued at USD 5.82 Million in 2024 and is projected to reach USD 12.69 Million by 2033, with an expected CAGR of 11.78% during the forecast period.

December 2025
Base Year: 2024
No Of Pages: 234
Price: $4750

Kenya ICT Market in Emerging Markets: Analysis and Projections 2025-2033

Explore the booming Kenyan ICT market analysis, highlighting key drivers like digital transformation in BFSI and government. Discover market size, CAGR, trends in cloud, AI, and telecommunication services, and challenges for SMEs.

November 2025
Base Year: 2024
No Of Pages: 197
Price: $3800

MEMS-Based Oscillator Industry: Competitive Landscape and Growth Trends 2025-2033

Explore the rapidly expanding MEMS-Based Oscillator Market, projected to reach over \$1.5 billion by 2033 with a remarkable 28.76% CAGR. Discover key drivers like IoT, automotive ADAS, and consumer electronics, alongside dominant segments and regional growth.

November 2025
Base Year: 2024
No Of Pages: 234
Price: $4750

United Arab Emirates Data Center Networking Market Future-Proofing Growth: Strategic Insights and Analysis 2025-2033

Explore the booming UAE data center networking market, projecting 14.40% CAGR to reach over $500M by 2033. Key drivers include cloud adoption, AI, and smart city initiatives. Get market size, growth, and key trends.

November 2025
Base Year: 2024
No Of Pages: 197
Price: $3800

Understanding Consumer Behavior in Cannabis Lighting Industry Market: 2025-2033

The size of the Cannabis Lighting Industry market was valued at USD XX Million in 2024 and is projected to reach USD XXX Million by 2033, with an expected CAGR of 7.60% during the forecast period.

November 2025
Base Year: 2024
No Of Pages: 234
Price: $4750

Emerging Europe Smart Card Industry Trends and Opportunities

The size of the Europe Smart Card Industry market was valued at USD XX Million in 2024 and is projected to reach USD XXX Million by 2033, with an expected CAGR of 3.80% during the forecast period.

November 2025
Base Year: 2024
No Of Pages: 210
Price: $4750

Strategic Analysis of Push Buttons & Signaling Devices Industry Market Growth 2025-2033

Explore the dynamic Push Buttons & Signaling Devices market, driven by industrial automation and IIoT integration. Discover key insights, growth drivers, and regional trends from 2019-2033.

November 2025
Base Year: 2024
No Of Pages: 234
Price: $4750

Exploring Barriers in Behavioral Biometrics Market Market: Trends and Analysis 2025-2033

The size of the Behavioral Biometrics Market market was valued at USD 2.13 Million in 2024 and is projected to reach USD 11.76 Million by 2033, with an expected CAGR of 27.64% during the forecast period.

November 2025
Base Year: 2024
No Of Pages: 234
Price: $4750

Overcoming Challenges in Nigeria Data Center Market Market: Strategic Insights 2025-2033

The size of the Nigeria Data Center Market market was valued at USD XX Million in 2024 and is projected to reach USD XXX Million by 2033, with an expected CAGR of 21.06% during the forecast period.

November 2025
Base Year: 2024
No Of Pages: 197
Price: $3800

Key Drivers for South Africa Data Center Storage Market Market Growth: Projections 2025-2033

Explore the dynamic South Africa Data Center Storage Market. Uncover key growth drivers, emerging trends like All-Flash and Hybrid Storage, and market size projections up to 2033. Essential insights for IT leaders and investors in this rapidly evolving sector.

November 2025
Base Year: 2024
No Of Pages: 197
Price: $3800

Neuromarketing Market 2025-2033 Trends: Unveiling Growth Opportunities and Competitor Dynamics

Explore the rapidly expanding Neuromarketing market, projected to reach \$1.57 billion by 2025 with an 8.89% CAGR. Discover key drivers, trends, restraints, and leading companies revolutionizing consumer insights across BFSI, retail, and more.

November 2025
Base Year: 2024
No Of Pages: 234
Price: $4750

Strategic Analysis of Global Payroll Services Market Industry Opportunities

Explore the booming Global Payroll Services Market! Discover key insights, market size of USD 26.60 million, and a strong 4.56% CAGR. Understand drivers, trends, restraints, and dominant players like ADP and Workday shaping the future of payroll processing for small, medium, and large businesses.

November 2025
Base Year: 2024
No Of Pages: 234
Price: $4750

Consumer Trends in Biometrics-as-a-Service Industry Market 2025-2033

The size of the Biometrics-as-a-Service Industry market was valued at USD XX Million in 2024 and is projected to reach USD XXX Million by 2033, with an expected CAGR of 22.76% during the forecast period.

November 2025
Base Year: 2024
No Of Pages: 234
Price: $4750

Spain Data Center Physical Security Market XX CAGR Growth Analysis 2025-2033

Explore the dynamic Spain Data Center Physical Security Market. Discover key insights, growth drivers, and trends shaping the €30.60M market with a 15.90% CAGR through 2033. Leading solutions include video surveillance and access control.

November 2025
Base Year: 2024
No Of Pages: 197
Price: $3800

Asia Pacific Smartphone Camera Lens Market Market’s Technological Evolution: Trends and Analysis 2025-2033

Explore the dynamic Asia Pacific smartphone camera lens market, driven by innovation and demand for advanced mobile photography. Discover key insights, market size, CAGR, drivers, restraints, and leading companies shaping the future of smartphone optics.

November 2025
Base Year: 2024
No Of Pages: 210
Price: $4750

Latin America Wireless Sensors Industry Analysis 2025 and Forecasts 2033: Unveiling Growth Opportunities

The size of the Latin America Wireless Sensors Industry market was valued at USD XX Million in 2024 and is projected to reach USD XXX Million by 2033, with an expected CAGR of 18.50% during the forecast period.

November 2025
Base Year: 2024
No Of Pages: 197
Price: $3800

Strategic Growth Drivers for UK E-Commerce Industry Market

Explore the booming UK E-Commerce market forecast: £280.55M by 2025 with a 21.76% CAGR. Discover key drivers, trends, restraints, and top companies shaping online retail in the UK.

November 2025
Base Year: 2024
No Of Pages: 197
Price: $3800

Unveiling APAC LiDAR Industry Growth Patterns: CAGR Analysis and Forecasts 2025-2033

Explore the booming APAC LiDAR market: Drivers, trends, key players, and projections for autonomous driving, engineering, and industrial applications. Get detailed market size and growth forecasts for 2025-2033.

November 2025
Base Year: 2024
No Of Pages: 197
Price: $3800

Robots Market for Commercial Buildings Soars to XXX Million, witnessing a CAGR of XX during the forecast period 2025-2033

Explore the booming Robots Market for Commercial Buildings, projected to reach $25.18 billion by 2033 with a staggering 25.70% CAGR. Discover key drivers, segment insights, and regional growth.

November 2025
Base Year: 2024
No Of Pages: 234
Price: $4750

Automated 3D Printing Market Growth Opportunities: Market Size Forecast to 2033

The size of the Automated 3D Printing Market market was valued at USD 2.13 Million in 2024 and is projected to reach USD 18.80 Million by 2033, with an expected CAGR of 36.49% during the forecast period.

November 2025
Base Year: 2024
No Of Pages: 234
Price: $4750

Analyzing Competitor Moves: X Ray Machine Manufacturing Industry Growth Outlook 2025-2033

Explore the dynamic X-ray machine manufacturing industry forecast (2025-2033) with a CAGR of 5.69%. Discover market size, growth drivers, key segments (digital X-ray, portable X-ray), leading companies, and regional trends in healthcare and beyond.

November 2025
Base Year: 2024
No Of Pages: 234
Price: $4750

Market Deep Dive: Exploring Romania Cybersecurity Market Trends 2025-2033

Explore the booming Romanian cybersecurity market, projected to reach USD 175.15 million by 2025 with a 10.89% CAGR. Discover key drivers, growth trends, and leading segments in this vital industry.

November 2025
Base Year: 2024
No Of Pages: 197
Price: $3800

Comprehensive Overview of User Activity Monitoring Industry Trends: 2025-2033

The size of the User Activity Monitoring Industry market was valued at USD XX Million in 2024 and is projected to reach USD XXX Million by 2033, with an expected CAGR of 22.10% during the forecast period.

November 2025
Base Year: 2024
No Of Pages: 234
Price: $4750
  • Home
  • About Us
  • Industries
    • Packaging
    • Retail
    • Hospitality and Tourism
    • Agriculture
    • Manufacturing Products and Services
    • Healthcare
    • Logistics
    • Aerospace & Defense
    • Chemicals & Materials
    • Professional and Commercial Services
    • Financial Services and Investment Intelligence
    • Food & Beverage
    • Consumer Goods and Services
    • Animal Nutrition & Wellness
    • Technology, Media and Telecom
    • Real Estate and Construction
    • Automotive
    • Home and Property Improvement
    • Energy & Power
  • Services
  • Contact
Main Logo
  • Home
  • About Us
  • Industries
    • Packaging
    • Retail
    • Hospitality and Tourism
    • Agriculture
    • Manufacturing Products and Services
    • Healthcare
    • Logistics
    • Aerospace & Defense
    • Chemicals & Materials
    • Professional and Commercial Services
    • Financial Services and Investment Intelligence
    • Food & Beverage
    • Consumer Goods and Services
    • Animal Nutrition & Wellness
    • Technology, Media and Telecom
    • Real Estate and Construction
    • Automotive
    • Home and Property Improvement
    • Energy & Power
  • Services
  • Contact
+17162654855
[email protected]

+17162654855

[email protected]

Business Address

Head Office

Ansec House 3 rd floor Tank Road, Yerwada, Pune, Maharashtra 411014

Contact Information

Craig Francis

Business Development Head

+17162654855

[email protected]

Secure Payment Partners

payment image
RetailPackagingLogisticsHealthcareAutomotiveAgricultureEnergy & PowerFood & BeverageAerospace & DefenseChemicals & MaterialsHospitality and TourismConsumer Goods and ServicesAnimal Nutrition & WellnessReal Estate and ConstructionTechnology, Media and TelecomHome and Property ImprovementManufacturing Products and ServicesFinancial Services and Investment Intelligence

© 2025 PRDUA Research & Media Private Limited, All rights reserved

Privacy Policy
Terms and Conditions
FAQ