Key Insights
The Explosive Trace Detector (ETD) market is experiencing significant expansion, driven by heightened global security imperatives and the widespread integration of advanced detection technologies across diverse sectors. The market, valued at approximately $1.71 billion in its base year of 2025, is projected to grow at a Compound Annual Growth Rate (CAGR) of 8.57% through 2033. Key growth catalysts include increasing incidents of terrorism, necessitating robust security at transportation hubs, airports, and public venues. Technological advancements, such as the development of more sensitive and portable ETDs, are enhancing detection accuracy and user-friendliness, fostering broader adoption. The evolving threat landscape, characterized by increasingly sophisticated explosives, also fuels continuous innovation in detection solutions. Government investments in homeland security and defense, particularly in North America and Europe, further bolster market growth. While handheld ETDs currently lead due to portability, the portable/movable segment is anticipated to see substantial growth with advanced large-area screening capabilities.
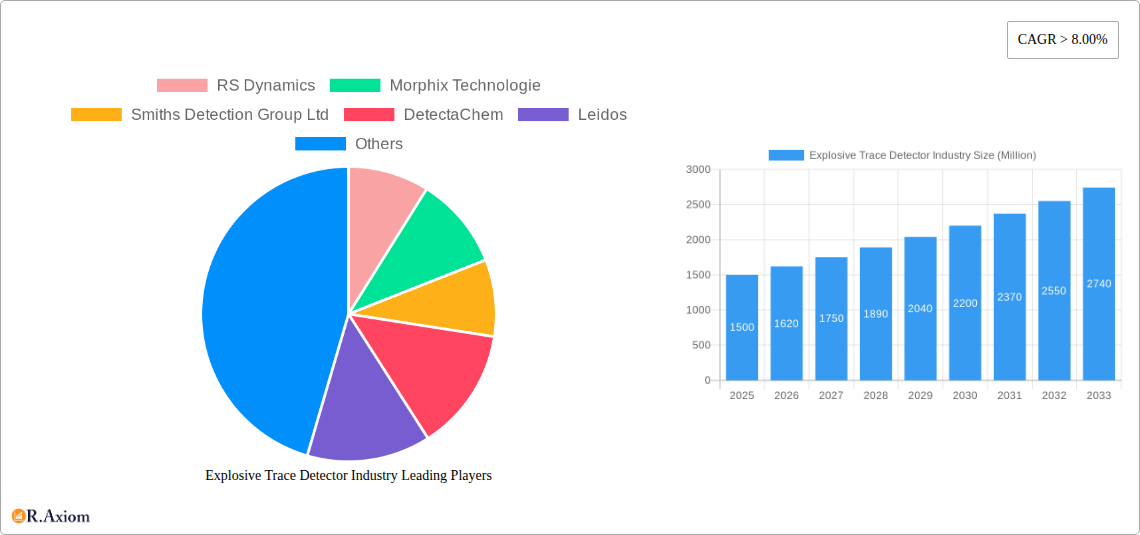
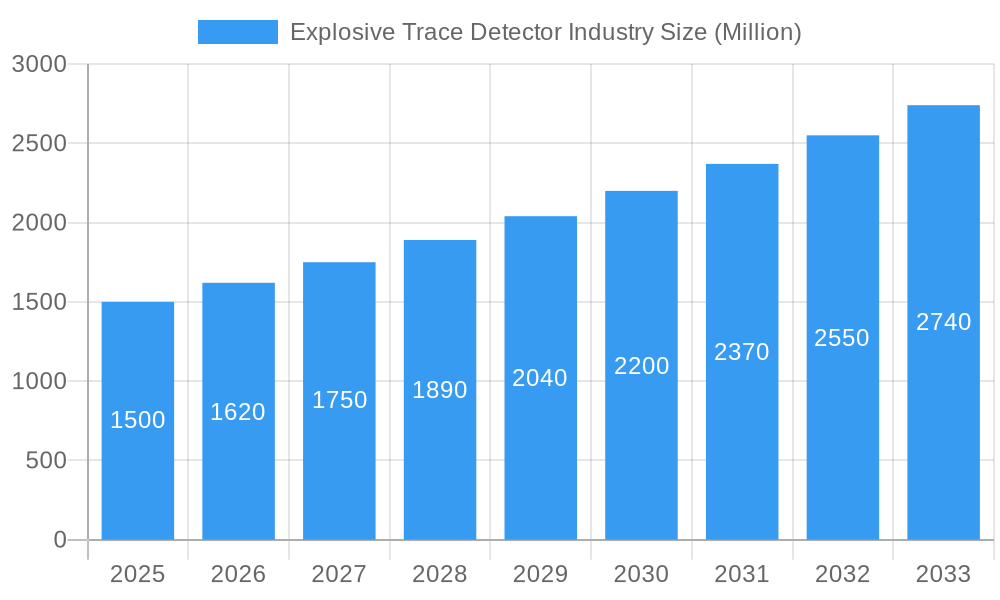
Explosive Trace Detector Industry Market Size (In Billion)
The competitive ETD market features both established leaders and agile emerging companies. Prominent players like Smiths Detection, Bruker, and FLIR are capitalizing on their technological prowess and established distribution channels. However, new entrants are introducing innovative solutions, intensifying market competition. Geographic expansion is expected globally, with North America and Europe retaining significant market shares owing to mature security infrastructures and regulations. The Asia-Pacific region, however, is poised for rapid growth driven by economic development and escalating security investments. Potential restraints, such as high initial investment costs for advanced ETD systems and regulatory complexities, are mitigated by the persistent demand for enhanced security and ongoing technological progress in explosive detection.
Explosive Trace Detector Industry Company Market Share
This comprehensive report delivers in-depth analysis of the Explosive Trace Detector (ETD) industry, providing critical insights for stakeholders navigating this evolving market. Covering the forecast period of 2025-2033, with 2025 as the base year, the report meticulously examines market size, growth drivers, challenges, and opportunities across various segments. Extensive primary and secondary research, including data from key industry participants and expert analysis, informs the actionable intelligence presented.
Explosive Trace Detector Industry Market Concentration & Innovation
The ETD market exhibits a moderately concentrated landscape, with key players such as Smiths Detection Group Ltd, Leidos, and Bruker holding significant market share. However, the presence of several smaller, specialized companies like DetectaChem and RS Dynamics fosters innovation and competition. Market share data indicates that Smiths Detection Group Ltd holds approximately xx% of the market, followed by Leidos at xx% and Bruker at xx% as of 2025. Innovation is driven by the constant need for enhanced sensitivity, faster detection times, and portability. Regulatory frameworks, such as those set by Homeland Security agencies globally, significantly influence product development and market access. Product substitutes, although limited, include advanced screening technologies like millimeter-wave scanners. End-user trends are shifting towards increased demand for handheld and portable devices for rapid on-site screening, particularly within law enforcement and public safety segments. M&A activity in the sector is relatively low; however, strategic partnerships and joint ventures are becoming increasingly common to access new technologies and markets. Recent M&A deal values have averaged around xx Million, primarily involving smaller acquisitions aimed at consolidating specific technologies or expanding geographical reach.
- Market Share (2025 Estimate): Smiths Detection Group Ltd (xx%), Leidos (xx%), Bruker (xx%)
- Average M&A Deal Value (2019-2024): xx Million
- Key Innovation Drivers: Enhanced Sensitivity, Faster Detection Times, Portability, Ease of Use
Explosive Trace Detector Industry Industry Trends & Insights
The global ETD market is experiencing robust growth, driven by escalating security concerns, particularly in the wake of terrorist attacks and rising crime rates. The industry's compound annual growth rate (CAGR) from 2025-2033 is projected at xx%, reflecting a significant expansion in market size from xx Million in 2025 to xx Million by 2033. Technological disruptions, such as the incorporation of advanced sensor technologies (e.g., ion mobility spectrometry) and improved data analytics, are enhancing detection accuracy and efficiency. Consumer preferences are trending towards user-friendly devices with intuitive interfaces and reduced false-positive rates. Competitive dynamics are characterized by a blend of technological innovation, strategic partnerships, and ongoing efforts to improve cost-effectiveness. Market penetration is highest in developed nations with robust security infrastructure, though emerging economies are witnessing rapid growth due to increasing investments in public safety and security.
Dominant Markets & Segments in Explosive Trace Detector Industry
The North American region currently dominates the ETD market, driven by substantial investments in homeland security and robust regulatory frameworks. Within this region, the United States accounts for a significant proportion of the market share.
End-Use Segment Dominance: The Defense segment holds the largest market share, followed by the Others (Public safety, Law Enforcement, Homeland Security) segment, demonstrating the high demand for ETDs in security-sensitive applications.
Product Segment Dominance: Handheld ETDs account for the largest market share due to their portability and ease of use in various settings.
Key Drivers for North American Dominance:
- Strong government funding for security and defense initiatives
- Stringent security regulations and protocols
- Well-established infrastructure for distribution and maintenance
- High level of technological advancement and innovation
Detailed Dominance Analysis: The high market share of the North American region is attributed to a combination of factors including strong government spending on security and defense, stringent security regulations, and a well-established market infrastructure. The Defense segment benefits from significant military budgets and ongoing demand for robust security solutions. The high share of handheld devices is due to their suitability for various deployment scenarios and ease of use.
Explosive Trace Detector Industry Product Developments
Recent product innovations focus on improving sensitivity, reducing false positives, and enhancing portability. Miniaturization of detectors and the integration of advanced algorithms for data analysis are key technological trends. New applications are emerging in areas like cargo screening, public transportation security, and infrastructure protection. Companies are differentiating themselves through improved user interfaces, advanced data analytics capabilities, and faster detection speeds. Market fit is achieved by providing solutions tailored to specific end-user needs and regulatory requirements.
Report Scope & Segmentation Analysis
This report segments the ETD market based on end-use (Commercial, Defense, Others – including public safety, law enforcement, and homeland security) and product type (Handheld, Portable/Movable, Fixed). Each segment's growth projection, market size, and competitive dynamics are analyzed in detail.
End-Use: The "Others" segment, encompassing public safety, law enforcement, and homeland security, is projected to exhibit the highest CAGR due to increasing investments in security infrastructure globally. The Commercial segment is experiencing steady growth, driven by the need for security in airports, transportation hubs, and other public places. The Defense segment maintains a large market size but is characterized by a more stable growth trajectory.
Product: The Handheld segment dominates in terms of market size, while Portable/Movable systems are projected to exhibit significant growth due to the increasing demand for versatile detection solutions. The Fixed segment caters to high-throughput applications such as airport baggage screening but is characterized by slower growth.
Key Drivers of Explosive Trace Detector Industry Growth
The ETD market's growth is fueled by several factors: increasing global security concerns post-9/11 and subsequent terrorist attacks; stringent regulatory requirements imposed by governments worldwide; advancements in sensor technology, leading to improved detection accuracy and reduced false positives; rising disposable incomes in developing countries, leading to greater investment in security infrastructure; and the growing adoption of ETDs across various sectors, including airports, transportation hubs, and public events.
Challenges in the Explosive Trace Detector Industry Sector
Challenges include the high cost of advanced ETD systems, potential supply chain disruptions affecting the availability of critical components, and intense competition among established and emerging players. Regulatory hurdles and varying international standards can complicate market entry and expansion. Furthermore, the need for continuous technological upgrades to counter evolving threats poses a considerable challenge. These factors can collectively impact the market’s growth trajectory, potentially leading to pricing pressure and reduced profit margins for some players. The estimated impact of these challenges on overall market growth is approximately xx%.
Emerging Opportunities in Explosive Trace Detector Industry
Emerging opportunities lie in the development of more sensitive, faster, and cost-effective ETDs. The integration of artificial intelligence and machine learning for enhanced data analysis and threat assessment presents a significant opportunity. Expanding into new markets in developing nations, especially those investing in security infrastructure, holds substantial potential. There's also an increasing focus on developing user-friendly devices with improved portability and ease of maintenance. The development of ETDs capable of detecting a wider range of explosives also presents a substantial opportunity.
Leading Players in the Explosive Trace Detector Industry Market
- Smiths Detection Group Ltd
- Leidos
- Bruker
- DetectaChem
- RS Dynamics
- Morphix Technologie
- Analogic Corporation
- OSI Systems Inc
- Autoclear LLC
- Teledyne FLIR LLC
Key Developments in Explosive Trace Detector Industry Industry
- January 2023: Smiths Detection launched a new handheld ETD with improved sensitivity and reduced false positives.
- June 2022: Leidos secured a major contract for ETD deployment at a major international airport.
- November 2021: A strategic partnership was formed between Bruker and a leading sensor technology company to develop next-generation ETDs.
- Further developments will be included in the final report.
Strategic Outlook for Explosive Trace Detector Industry Market
The ETD market is poised for continued growth, driven by persistent security concerns and technological advancements. The focus on developing smaller, faster, more sensitive, and cost-effective devices will shape future market dynamics. The integration of AI and machine learning will further enhance the capabilities of ETDs, creating new opportunities for market expansion. Emerging markets in developing countries will play a significant role in driving future growth. Strategic partnerships and collaborations will be key to success in this competitive landscape.
Explosive Trace Detector Industry Segmentation
-
1. Product
- 1.1. Handheld
- 1.2. Portable/Movable
- 1.3. Fixed
-
2. End Use
- 2.1. Commercial
- 2.2. Defense
- 2.3. Others (
Explosive Trace Detector Industry Segmentation By Geography
-
1. North America
- 1.1. United States
- 1.2. Canada
-
2. Europe
- 2.1. Germany
- 2.2. United Kingdom
- 2.3. France
- 2.4. Russia
- 2.5. Rest of Europe
-
3. Asia Pacific
- 3.1. India
- 3.2. China
- 3.3. Japan
- 3.4. South Korea
- 3.5. Rest of Asia Pacific
-
4. Latin America
- 4.1. Brazil
- 4.2. Rest of Latin America
-
5. Middle East and Africa
- 5.1. United Arab Emirates
- 5.2. Saudi Arabia
- 5.3. Egypt
- 5.4. Rest of Middle East and Africa
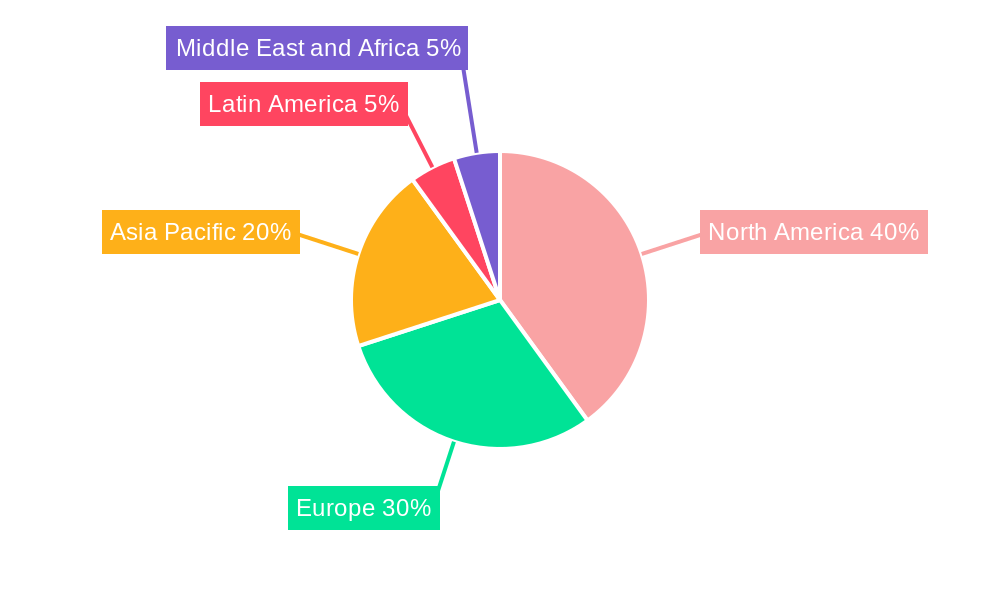
Explosive Trace Detector Industry Regional Market Share
Geographic Coverage of Explosive Trace Detector Industry
Explosive Trace Detector Industry REPORT HIGHLIGHTS
| Aspects | Details |
|---|---|
| Study Period | 2020-2034 |
| Base Year | 2025 |
| Estimated Year | 2026 |
| Forecast Period | 2026-2034 |
| Historical Period | 2020-2025 |
| Growth Rate | CAGR of 8.57% from 2020-2034 |
| Segmentation |
|
Table of Contents
- 1. Introduction
- 1.1. Research Scope
- 1.2. Market Segmentation
- 1.3. Research Objective
- 1.4. Definitions and Assumptions
- 2. Executive Summary
- 2.1. Market Snapshot
- 3. Market Dynamics
- 3.1. Market Drivers
- 3.2. Market Restrains
- 3.3. Market Trends
- 3.4. Market Opportunities
- 4. Market Factor Analysis
- 4.1. Porters Five Forces
- 4.1.1. Bargaining Power of Suppliers
- 4.1.2. Bargaining Power of Buyers
- 4.1.3. Threat of New Entrants
- 4.1.4. Threat of Substitutes
- 4.1.5. Competitive Rivalry
- 4.2. PESTEL analysis
- 4.3. BCG Analysis
- 4.3.1. Stars (High Growth, High Market Share)
- 4.3.2. Cash Cows (Low Growth, High Market Share)
- 4.3.3. Question Mark (High Growth, Low Market Share)
- 4.3.4. Dogs (Low Growth, Low Market Share)
- 4.4. Ansoff Matrix Analysis
- 4.5. Supply Chain Analysis
- 4.6. Regulatory Landscape
- 4.7. Current Market Potential and Opportunity Assessment (TAM–SAM–SOM Framework)
- 4.8. RAX Analyst Note
- 4.1. Porters Five Forces
- 5. Market Analysis, Insights and Forecast 2021-2033
- 5.1. Market Analysis, Insights and Forecast - by Product
- 5.1.1. Handheld
- 5.1.2. Portable/Movable
- 5.1.3. Fixed
- 5.2. Market Analysis, Insights and Forecast - by End Use
- 5.2.1. Commercial
- 5.2.2. Defense
- 5.2.3. Others (
- 5.3. Market Analysis, Insights and Forecast - by Region
- 5.3.1. North America
- 5.3.2. Europe
- 5.3.3. Asia Pacific
- 5.3.4. Latin America
- 5.3.5. Middle East and Africa
- 5.1. Market Analysis, Insights and Forecast - by Product
- 6. Global Explosive Trace Detector Industry Analysis, Insights and Forecast, 2021-2033
- 6.1. Market Analysis, Insights and Forecast - by Product
- 6.1.1. Handheld
- 6.1.2. Portable/Movable
- 6.1.3. Fixed
- 6.2. Market Analysis, Insights and Forecast - by End Use
- 6.2.1. Commercial
- 6.2.2. Defense
- 6.2.3. Others (
- 6.1. Market Analysis, Insights and Forecast - by Product
- 7. North America Explosive Trace Detector Industry Analysis, Insights and Forecast, 2020-2032
- 7.1. Market Analysis, Insights and Forecast - by Product
- 7.1.1. Handheld
- 7.1.2. Portable/Movable
- 7.1.3. Fixed
- 7.2. Market Analysis, Insights and Forecast - by End Use
- 7.2.1. Commercial
- 7.2.2. Defense
- 7.2.3. Others (
- 7.1. Market Analysis, Insights and Forecast - by Product
- 8. Europe Explosive Trace Detector Industry Analysis, Insights and Forecast, 2020-2032
- 8.1. Market Analysis, Insights and Forecast - by Product
- 8.1.1. Handheld
- 8.1.2. Portable/Movable
- 8.1.3. Fixed
- 8.2. Market Analysis, Insights and Forecast - by End Use
- 8.2.1. Commercial
- 8.2.2. Defense
- 8.2.3. Others (
- 8.1. Market Analysis, Insights and Forecast - by Product
- 9. Asia Pacific Explosive Trace Detector Industry Analysis, Insights and Forecast, 2020-2032
- 9.1. Market Analysis, Insights and Forecast - by Product
- 9.1.1. Handheld
- 9.1.2. Portable/Movable
- 9.1.3. Fixed
- 9.2. Market Analysis, Insights and Forecast - by End Use
- 9.2.1. Commercial
- 9.2.2. Defense
- 9.2.3. Others (
- 9.1. Market Analysis, Insights and Forecast - by Product
- 10. Latin America Explosive Trace Detector Industry Analysis, Insights and Forecast, 2020-2032
- 10.1. Market Analysis, Insights and Forecast - by Product
- 10.1.1. Handheld
- 10.1.2. Portable/Movable
- 10.1.3. Fixed
- 10.2. Market Analysis, Insights and Forecast - by End Use
- 10.2.1. Commercial
- 10.2.2. Defense
- 10.2.3. Others (
- 10.1. Market Analysis, Insights and Forecast - by Product
- 11. Middle East and Africa Explosive Trace Detector Industry Analysis, Insights and Forecast, 2020-2032
- 11.1. Market Analysis, Insights and Forecast - by Product
- 11.1.1. Handheld
- 11.1.2. Portable/Movable
- 11.1.3. Fixed
- 11.2. Market Analysis, Insights and Forecast - by End Use
- 11.2.1. Commercial
- 11.2.2. Defense
- 11.2.3. Others (
- 11.1. Market Analysis, Insights and Forecast - by Product
- 12. Competitive Analysis
- 12.1. Company Profiles
- 12.1.1 RS Dynamics
- 12.1.1.1. Company Overview
- 12.1.1.2. Products
- 12.1.1.3. Company Financials
- 12.1.1.4. SWOT Analysis
- 12.1.2 Morphix Technologie
- 12.1.2.1. Company Overview
- 12.1.2.2. Products
- 12.1.2.3. Company Financials
- 12.1.2.4. SWOT Analysis
- 12.1.3 Smiths Detection Group Ltd
- 12.1.3.1. Company Overview
- 12.1.3.2. Products
- 12.1.3.3. Company Financials
- 12.1.3.4. SWOT Analysis
- 12.1.4 DetectaChem
- 12.1.4.1. Company Overview
- 12.1.4.2. Products
- 12.1.4.3. Company Financials
- 12.1.4.4. SWOT Analysis
- 12.1.5 Leidos
- 12.1.5.1. Company Overview
- 12.1.5.2. Products
- 12.1.5.3. Company Financials
- 12.1.5.4. SWOT Analysis
- 12.1.6 Bruker
- 12.1.6.1. Company Overview
- 12.1.6.2. Products
- 12.1.6.3. Company Financials
- 12.1.6.4. SWOT Analysis
- 12.1.7 Analogic Corporation
- 12.1.7.1. Company Overview
- 12.1.7.2. Products
- 12.1.7.3. Company Financials
- 12.1.7.4. SWOT Analysis
- 12.1.8 OSI Systems Inc
- 12.1.8.1. Company Overview
- 12.1.8.2. Products
- 12.1.8.3. Company Financials
- 12.1.8.4. SWOT Analysis
- 12.1.9 Autoclear LLC
- 12.1.9.1. Company Overview
- 12.1.9.2. Products
- 12.1.9.3. Company Financials
- 12.1.9.4. SWOT Analysis
- 12.1.10 Teledyne FLIR LLC
- 12.1.10.1. Company Overview
- 12.1.10.2. Products
- 12.1.10.3. Company Financials
- 12.1.10.4. SWOT Analysis
- 12.1.1 RS Dynamics
- 12.2. Market Entropy
- 12.2.1 Company's Key Areas Served
- 12.2.2 Recent Developments
- 12.3. Company Market Share Analysis 2025
- 12.3.1 Top 5 Companies Market Share Analysis
- 12.3.2 Top 3 Companies Market Share Analysis
- 12.4. List of Potential Customers
- 13. Research Methodology
List of Figures
- Figure 1: Global Explosive Trace Detector Industry Revenue Breakdown (billion, %) by Region 2025 & 2033
- Figure 2: North America Explosive Trace Detector Industry Revenue (billion), by Product 2025 & 2033
- Figure 3: North America Explosive Trace Detector Industry Revenue Share (%), by Product 2025 & 2033
- Figure 4: North America Explosive Trace Detector Industry Revenue (billion), by End Use 2025 & 2033
- Figure 5: North America Explosive Trace Detector Industry Revenue Share (%), by End Use 2025 & 2033
- Figure 6: North America Explosive Trace Detector Industry Revenue (billion), by Country 2025 & 2033
- Figure 7: North America Explosive Trace Detector Industry Revenue Share (%), by Country 2025 & 2033
- Figure 8: Europe Explosive Trace Detector Industry Revenue (billion), by Product 2025 & 2033
- Figure 9: Europe Explosive Trace Detector Industry Revenue Share (%), by Product 2025 & 2033
- Figure 10: Europe Explosive Trace Detector Industry Revenue (billion), by End Use 2025 & 2033
- Figure 11: Europe Explosive Trace Detector Industry Revenue Share (%), by End Use 2025 & 2033
- Figure 12: Europe Explosive Trace Detector Industry Revenue (billion), by Country 2025 & 2033
- Figure 13: Europe Explosive Trace Detector Industry Revenue Share (%), by Country 2025 & 2033
- Figure 14: Asia Pacific Explosive Trace Detector Industry Revenue (billion), by Product 2025 & 2033
- Figure 15: Asia Pacific Explosive Trace Detector Industry Revenue Share (%), by Product 2025 & 2033
- Figure 16: Asia Pacific Explosive Trace Detector Industry Revenue (billion), by End Use 2025 & 2033
- Figure 17: Asia Pacific Explosive Trace Detector Industry Revenue Share (%), by End Use 2025 & 2033
- Figure 18: Asia Pacific Explosive Trace Detector Industry Revenue (billion), by Country 2025 & 2033
- Figure 19: Asia Pacific Explosive Trace Detector Industry Revenue Share (%), by Country 2025 & 2033
- Figure 20: Latin America Explosive Trace Detector Industry Revenue (billion), by Product 2025 & 2033
- Figure 21: Latin America Explosive Trace Detector Industry Revenue Share (%), by Product 2025 & 2033
- Figure 22: Latin America Explosive Trace Detector Industry Revenue (billion), by End Use 2025 & 2033
- Figure 23: Latin America Explosive Trace Detector Industry Revenue Share (%), by End Use 2025 & 2033
- Figure 24: Latin America Explosive Trace Detector Industry Revenue (billion), by Country 2025 & 2033
- Figure 25: Latin America Explosive Trace Detector Industry Revenue Share (%), by Country 2025 & 2033
- Figure 26: Middle East and Africa Explosive Trace Detector Industry Revenue (billion), by Product 2025 & 2033
- Figure 27: Middle East and Africa Explosive Trace Detector Industry Revenue Share (%), by Product 2025 & 2033
- Figure 28: Middle East and Africa Explosive Trace Detector Industry Revenue (billion), by End Use 2025 & 2033
- Figure 29: Middle East and Africa Explosive Trace Detector Industry Revenue Share (%), by End Use 2025 & 2033
- Figure 30: Middle East and Africa Explosive Trace Detector Industry Revenue (billion), by Country 2025 & 2033
- Figure 31: Middle East and Africa Explosive Trace Detector Industry Revenue Share (%), by Country 2025 & 2033
List of Tables
- Table 1: Global Explosive Trace Detector Industry Revenue billion Forecast, by Product 2020 & 2033
- Table 2: Global Explosive Trace Detector Industry Revenue billion Forecast, by End Use 2020 & 2033
- Table 3: Global Explosive Trace Detector Industry Revenue billion Forecast, by Region 2020 & 2033
- Table 4: Global Explosive Trace Detector Industry Revenue billion Forecast, by Product 2020 & 2033
- Table 5: Global Explosive Trace Detector Industry Revenue billion Forecast, by End Use 2020 & 2033
- Table 6: Global Explosive Trace Detector Industry Revenue billion Forecast, by Country 2020 & 2033
- Table 7: United States Explosive Trace Detector Industry Revenue (billion) Forecast, by Application 2020 & 2033
- Table 8: Canada Explosive Trace Detector Industry Revenue (billion) Forecast, by Application 2020 & 2033
- Table 9: Global Explosive Trace Detector Industry Revenue billion Forecast, by Product 2020 & 2033
- Table 10: Global Explosive Trace Detector Industry Revenue billion Forecast, by End Use 2020 & 2033
- Table 11: Global Explosive Trace Detector Industry Revenue billion Forecast, by Country 2020 & 2033
- Table 12: Germany Explosive Trace Detector Industry Revenue (billion) Forecast, by Application 2020 & 2033
- Table 13: United Kingdom Explosive Trace Detector Industry Revenue (billion) Forecast, by Application 2020 & 2033
- Table 14: France Explosive Trace Detector Industry Revenue (billion) Forecast, by Application 2020 & 2033
- Table 15: Russia Explosive Trace Detector Industry Revenue (billion) Forecast, by Application 2020 & 2033
- Table 16: Rest of Europe Explosive Trace Detector Industry Revenue (billion) Forecast, by Application 2020 & 2033
- Table 17: Global Explosive Trace Detector Industry Revenue billion Forecast, by Product 2020 & 2033
- Table 18: Global Explosive Trace Detector Industry Revenue billion Forecast, by End Use 2020 & 2033
- Table 19: Global Explosive Trace Detector Industry Revenue billion Forecast, by Country 2020 & 2033
- Table 20: India Explosive Trace Detector Industry Revenue (billion) Forecast, by Application 2020 & 2033
- Table 21: China Explosive Trace Detector Industry Revenue (billion) Forecast, by Application 2020 & 2033
- Table 22: Japan Explosive Trace Detector Industry Revenue (billion) Forecast, by Application 2020 & 2033
- Table 23: South Korea Explosive Trace Detector Industry Revenue (billion) Forecast, by Application 2020 & 2033
- Table 24: Rest of Asia Pacific Explosive Trace Detector Industry Revenue (billion) Forecast, by Application 2020 & 2033
- Table 25: Global Explosive Trace Detector Industry Revenue billion Forecast, by Product 2020 & 2033
- Table 26: Global Explosive Trace Detector Industry Revenue billion Forecast, by End Use 2020 & 2033
- Table 27: Global Explosive Trace Detector Industry Revenue billion Forecast, by Country 2020 & 2033
- Table 28: Brazil Explosive Trace Detector Industry Revenue (billion) Forecast, by Application 2020 & 2033
- Table 29: Rest of Latin America Explosive Trace Detector Industry Revenue (billion) Forecast, by Application 2020 & 2033
- Table 30: Global Explosive Trace Detector Industry Revenue billion Forecast, by Product 2020 & 2033
- Table 31: Global Explosive Trace Detector Industry Revenue billion Forecast, by End Use 2020 & 2033
- Table 32: Global Explosive Trace Detector Industry Revenue billion Forecast, by Country 2020 & 2033
- Table 33: United Arab Emirates Explosive Trace Detector Industry Revenue (billion) Forecast, by Application 2020 & 2033
- Table 34: Saudi Arabia Explosive Trace Detector Industry Revenue (billion) Forecast, by Application 2020 & 2033
- Table 35: Egypt Explosive Trace Detector Industry Revenue (billion) Forecast, by Application 2020 & 2033
- Table 36: Rest of Middle East and Africa Explosive Trace Detector Industry Revenue (billion) Forecast, by Application 2020 & 2033
Frequently Asked Questions
1. What is the projected Compound Annual Growth Rate (CAGR) of the Explosive Trace Detector Industry?
The projected CAGR is approximately 8.57%.
2. Which companies are prominent players in the Explosive Trace Detector Industry?
Key companies in the market include RS Dynamics, Morphix Technologie, Smiths Detection Group Ltd, DetectaChem, Leidos, Bruker, Analogic Corporation, OSI Systems Inc, Autoclear LLC, Teledyne FLIR LLC.
3. What are the main segments of the Explosive Trace Detector Industry?
The market segments include Product, End Use.
4. Can you provide details about the market size?
The market size is estimated to be USD 1.71 billion as of 2022.
5. What are some drivers contributing to market growth?
N/A
6. What are the notable trends driving market growth?
Commercial Segment is Projected to Show Significant Growth During the Forecast Period.
7. Are there any restraints impacting market growth?
N/A
8. Can you provide examples of recent developments in the market?
N/A
9. What pricing options are available for accessing the report?
Pricing options include single-user, multi-user, and enterprise licenses priced at USD 4750, USD 5250, and USD 8750 respectively.
10. Is the market size provided in terms of value or volume?
The market size is provided in terms of value, measured in billion.
11. Are there any specific market keywords associated with the report?
Yes, the market keyword associated with the report is "Explosive Trace Detector Industry," which aids in identifying and referencing the specific market segment covered.
12. How do I determine which pricing option suits my needs best?
The pricing options vary based on user requirements and access needs. Individual users may opt for single-user licenses, while businesses requiring broader access may choose multi-user or enterprise licenses for cost-effective access to the report.
13. Are there any additional resources or data provided in the Explosive Trace Detector Industry report?
While the report offers comprehensive insights, it's advisable to review the specific contents or supplementary materials provided to ascertain if additional resources or data are available.
14. How can I stay updated on further developments or reports in the Explosive Trace Detector Industry?
To stay informed about further developments, trends, and reports in the Explosive Trace Detector Industry, consider subscribing to industry newsletters, following relevant companies and organizations, or regularly checking reputable industry news sources and publications.
Methodology
Step 1 - Identification of Relevant Samples Size from Population Database


Step 2 - Approaches for Defining Global Market Size (Value, Volume* & Price*)

Note*: In applicable scenarios
Step 3 - Data Sources
Primary Research
- Web Analytics
- Survey Reports
- Research Institute
- Latest Research Reports
- Opinion Leaders
Secondary Research
- Annual Reports
- White Paper
- Latest Press Release
- Industry Association
- Paid Database
- Investor Presentations

Step 4 - Data Triangulation
Involves using different sources of information in order to increase the validity of a study
These sources are likely to be stakeholders in a program - participants, other researchers, program staff, other community members, and so on.
Then we put all data in single framework & apply various statistical tools to find out the dynamic on the market.
During the analysis stage, feedback from the stakeholder groups would be compared to determine areas of agreement as well as areas of divergence

