
Key Insights
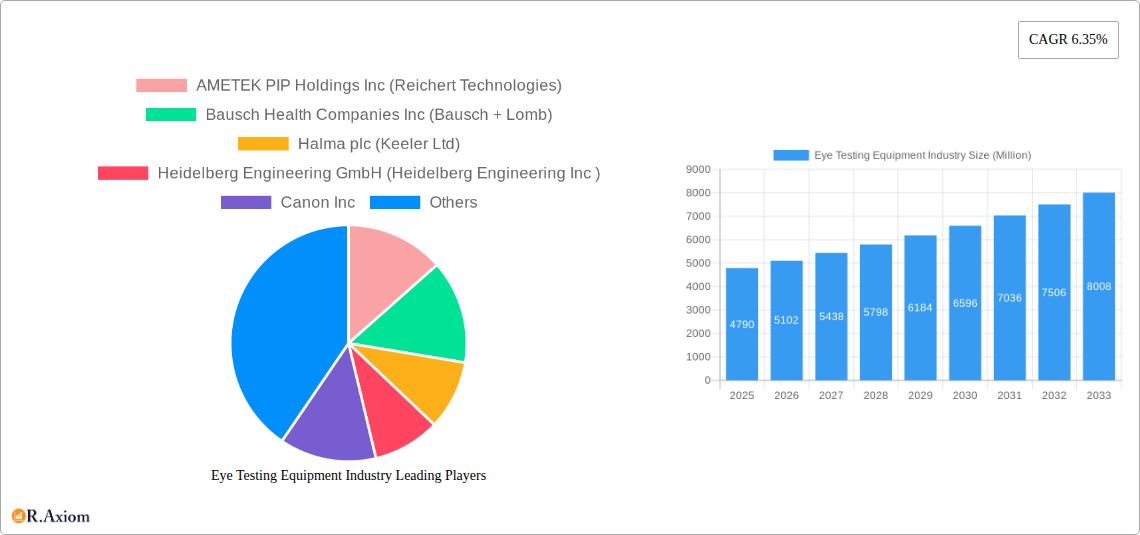
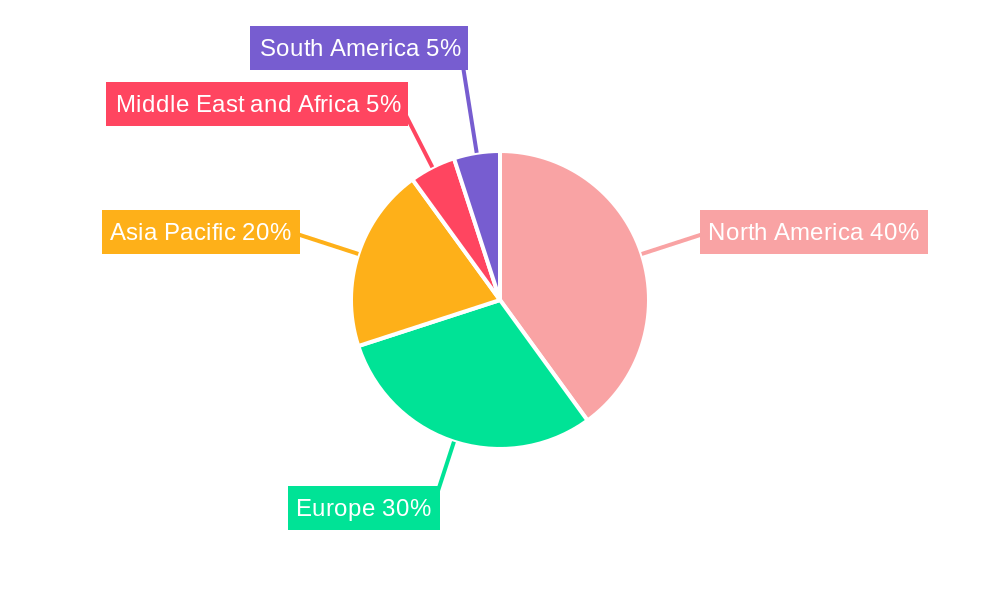
The global eye testing equipment market, valued at $4.79 billion in 2025, is projected to experience robust growth, driven by a rising prevalence of eye diseases like glaucoma, cataracts, and diabetic retinopathy, coupled with an aging global population. Technological advancements, such as the integration of artificial intelligence and improved imaging techniques (like OCT and optical coherence tomography angiography), are significantly enhancing diagnostic capabilities and driving market expansion. The increasing adoption of minimally invasive procedures and a growing preference for early detection and preventive care further contribute to market growth. Growth is segmented across various examination types, including retina and cornea examinations, with retina examinations currently holding a larger market share due to the widespread prevalence of related diseases. Hospitals and eye clinics remain the primary end-users, although the market is witnessing gradual expansion into smaller clinics and optometry practices. North America and Europe currently dominate the market, owing to well-established healthcare infrastructure and high healthcare expenditure. However, Asia-Pacific is expected to witness significant growth in the coming years, fueled by rising disposable incomes and increasing healthcare awareness. Competitive dynamics are characterized by the presence of both established players, like AMETEK, Bausch + Lomb, and Carl Zeiss Meditec, and emerging innovative companies. These companies are constantly investing in R&D to develop advanced and user-friendly equipment.
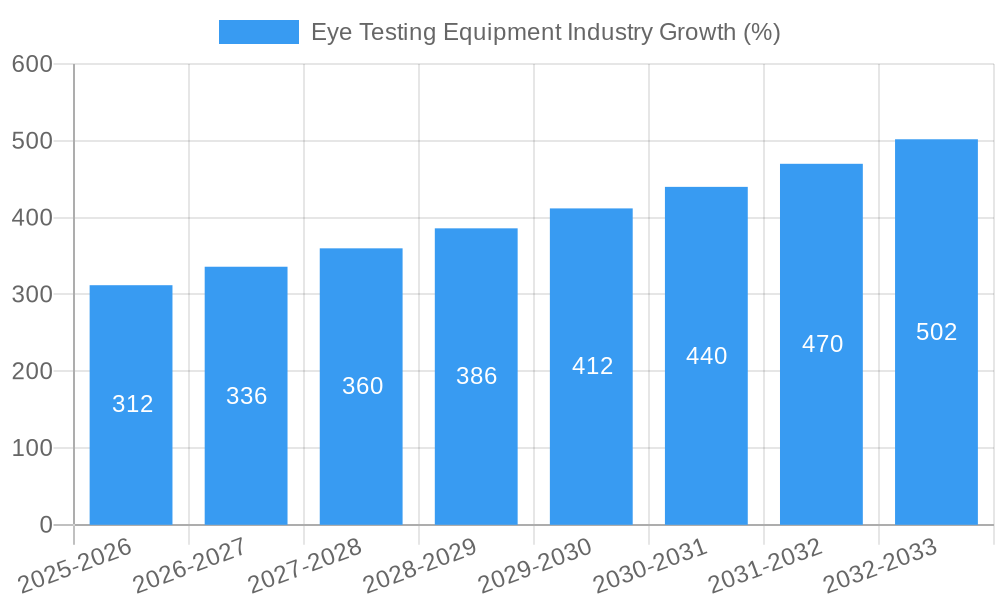
The market's growth trajectory is expected to maintain a Compound Annual Growth Rate (CAGR) of 6.35% from 2025 to 2033. This sustained growth is anticipated to be influenced by factors such as government initiatives promoting eye health, expanding access to affordable healthcare, and the increasing adoption of teleophthalmology, which facilitates remote eye examinations. While the market faces challenges such as high equipment costs and a scarcity of skilled professionals in certain regions, the overall outlook remains positive, with significant opportunities for market expansion, particularly in developing countries with rising awareness of eye health and increasing healthcare infrastructure investments. The continuous development of more sophisticated and portable eye testing equipment will further contribute to market growth and accessibility.
Eye Testing Equipment Industry Market Report: 2019-2033
This comprehensive report provides an in-depth analysis of the Eye Testing Equipment industry, encompassing market size, growth projections, competitive landscape, and future trends. The study period covers 2019-2033, with 2025 as the base and estimated year, and a forecast period of 2025-2033. The historical period analyzed is 2019-2024. This report is crucial for industry stakeholders, investors, and market entrants seeking a clear understanding of this dynamic sector.
Eye Testing Equipment Industry Market Concentration & Innovation
The Eye Testing Equipment market exhibits a moderately concentrated structure, with key players like AMETEK PIP Holdings Inc (Reichert Technologies), Bausch Health Companies Inc (Bausch + Lomb), and Carl Zeiss Meditec AG holding significant market share. However, the presence of numerous smaller players and emerging innovators indicates a dynamic competitive landscape. Market share estimates for 2025 place the top three players at approximately xx%, xx%, and xx%, respectively, with the remaining share distributed among other competitors.
Innovation Drivers:
- Technological advancements in imaging, such as the introduction of handheld fundus cameras like Epipole's epiCam, are driving innovation.
- Miniaturization and portability of equipment are improving accessibility and usability.
- Artificial intelligence (AI) integration for automated analysis and diagnosis is emerging as a key innovation.
Regulatory Frameworks:
Stringent regulatory approvals for medical devices influence market entry and product development. Compliance with standards like FDA regulations in the US and CE marking in Europe is crucial for market success.
Product Substitutes:
While there are no direct substitutes for core eye testing equipment, advancements in remote monitoring technologies and telemedicine could potentially reduce reliance on traditional in-person examinations in certain contexts.
End-User Trends:
Growing prevalence of eye diseases, increasing demand for advanced diagnostic tools, and a shift toward minimally invasive procedures are driving end-user demand. The rise in the aging population globally is another significant factor.
M&A Activities:
The industry has witnessed a moderate level of M&A activity in recent years, with deal values ranging from xx Million to xx Million. These transactions primarily focus on consolidating market share and expanding product portfolios. Examples include (but are not limited to) recent strategic partnerships and acquisitions by established players to enhance their product offerings and market reach.
Eye Testing Equipment Industry Industry Trends & Insights
The global Eye Testing Equipment market is projected to experience substantial growth during the forecast period (2025-2033), with a Compound Annual Growth Rate (CAGR) estimated at xx%. This growth is driven by several key factors.
Rising prevalence of eye diseases globally contributes significantly to market expansion. Technological advancements, such as the development of high-resolution imaging systems and AI-powered diagnostic tools, enhance diagnostic accuracy and efficiency, further boosting market growth. Improved healthcare infrastructure, particularly in developing economies, and increased healthcare expenditure are driving market penetration. Consumer preferences are shifting towards advanced, portable, and user-friendly equipment. Furthermore, the increasing integration of telemedicine and remote patient monitoring is expanding market opportunities.
Competitive dynamics are shaped by factors including technological innovation, product differentiation, and strategic partnerships. Established players are constantly striving to improve existing technologies and introduce new products to maintain a competitive edge. The entry of new players with innovative solutions is also influencing market competition. The growing adoption of AI and machine learning algorithms in eye testing equipment is improving efficiency and precision.
Dominant Markets & Segments in Eye Testing Equipment Industry
The North American region currently holds a dominant position in the Eye Testing Equipment market, driven by factors including advanced healthcare infrastructure, high healthcare expenditure, and a significant prevalence of eye-related diseases.
Key Drivers:
- Economic Policies: Government initiatives supporting healthcare infrastructure development and disease prevention programs contribute to market expansion.
- Infrastructure: Well-established healthcare systems and a high density of eye clinics and hospitals facilitate widespread adoption.
Dominance Analysis:
The Retina Examination segment holds a significant share of the market due to its critical role in diagnosing a wide range of retinal diseases. The Eye Clinic end-user segment represents the largest share due to the high concentration of eye testing activities within these facilities.
- Retina Examination: Demand is driven by the rising prevalence of age-related macular degeneration (AMD), diabetic retinopathy, and glaucoma.
- Retinoscope: Cornea Examination: This segment is growing due to the increasing need for accurate corneal mapping and refractive error correction.
- Other Cornea Examinations: General Examination: This segment comprises a wide range of tests, and demand is driven by the overall need for comprehensive eye care.
- Eye Clinic: This segment dominates due to the high volume of eye examinations conducted in these facilities.
- Hospital: Demand for advanced eye testing equipment in hospitals is driven by the growing complexity of cases and the integration of ophthalmology departments.
- Other End Users: This segment includes optometrists' offices and mobile eye care units.
Eye Testing Equipment Industry Product Developments
Recent product innovations include handheld, portable fundus cameras with improved image quality and wireless connectivity. These devices are designed for ease of use, enhanced portability, and integration with electronic health records (EHRs). New software solutions with AI-powered image analysis capabilities are improving diagnostic accuracy and efficiency. These advancements cater to the growing need for cost-effective, accessible, and accurate eye testing solutions.
Report Scope & Segmentation Analysis
This report segments the Eye Testing Equipment market based on Type of Examination (Retina Examination, Retinoscope: Cornea Examination, Other Cornea Examinations: General Examination) and End User (Eye Clinic, Hospital, Other End Users). Each segment's growth projections, market size estimates, and competitive landscape are analyzed to provide comprehensive market insights.
Type of Examination: Each segment shows varying growth rates based on technological advancements and prevalence of specific eye diseases. For example, the Retina Examination segment, fueled by increasing prevalence of AMD and diabetic retinopathy, is expected to witness a significant growth during the forecast period.
End User: The Eye Clinic segment is expected to dominate owing to the concentration of eye care professionals and the volume of eye examinations performed. The Hospital segment is also anticipated to grow, driven by the increasing complexity of eye care cases and the presence of advanced diagnostic tools in these settings. The "Other End Users" segment, comprising mobile eye care units and optometrist offices, is expected to show modest growth due to factors such as increasing access to eye care services and ongoing technological enhancements.
Key Drivers of Eye Testing Equipment Industry Growth
Several factors are driving growth in the Eye Testing Equipment industry. The rising prevalence of age-related eye diseases, such as glaucoma and macular degeneration, necessitates increased demand for sophisticated diagnostic tools. Technological advancements, including miniaturization, wireless connectivity, and AI-powered image analysis, have enhanced efficiency and accuracy. Government initiatives and healthcare reforms aimed at improving eye care access further fuel market growth.
Challenges in the Eye Testing Equipment Industry Sector
Significant challenges include stringent regulatory approvals, which can cause delays in product launches and increase costs. Supply chain disruptions and rising material costs are impacting profitability. Intense competition from established and emerging players requires continuous innovation and product differentiation to maintain market share. The high cost of advanced equipment can limit accessibility in certain regions.
Emerging Opportunities in Eye Testing Equipment Industry
Emerging opportunities include the development of AI-powered diagnostic tools, expansion into teleophthalmology, and the integration of cloud-based solutions for remote patient monitoring. Focus on developing cost-effective, portable, and user-friendly devices is crucial for expanding market reach in underserved areas. The development of point-of-care diagnostic tests for common eye diseases presents significant growth potential.
Leading Players in the Eye Testing Equipment Industry Market
- AMETEK PIP Holdings Inc (Reichert Technologies)
- Bausch Health Companies Inc (Bausch + Lomb)
- Halma plc (Keeler Ltd)
- Heidelberg Engineering GmbH (Heidelberg Engineering Inc)
- Canon Inc
- Carl Zeiss Meditec AG
- Revenio Group PLC (iCare Finland OY)
- Oculus Inc
- Nidek Co Ltd
- Johnson & Johnson
- Alcon
- Essilor Luxottica (Essilor International SA)
- HEINE Optotechnik
Key Developments in Eye Testing Equipment Industry Industry
- July 2022: Sightsavers launched a mobile eye care van in Delhi-NCR, equipped with ophthalmoscopes, retinoscopes, and other testing tools, to provide services to the truckers' community.
- March 2022: Epipole launched its epiCam fundus camera at Vision Expo East 2022, introducing a high-powered, ultra-portable, wireless fundus camera using VDO technology.
Strategic Outlook for Eye Testing Equipment Industry Market
The Eye Testing Equipment market is poised for continued growth, driven by technological advancements, increasing prevalence of eye diseases, and expanding healthcare infrastructure. Opportunities lie in developing innovative, cost-effective solutions for improved accessibility and remote monitoring. Strategic partnerships and collaborations will be crucial for expanding market reach and maintaining a competitive edge in this dynamic sector.
Eye Testing Equipment Industry Segmentation
-
1. Type of Examination
-
1.1. Retina Examination
- 1.1.1. OCT Scanner
- 1.1.2. Fundus Camera
- 1.1.3. Visual Field Analyzer
- 1.1.4. Ophthalmoscope
- 1.1.5. Retinoscope
-
1.2. Cornea Examination
- 1.2.1. Wavefront Aberrometer
- 1.2.2. Specular Microscope
- 1.2.3. Other Cornea Examinations
-
1.3. General Examination
- 1.3.1. Autorefractor
- 1.3.2. Ophthalmic Ultrasound System
- 1.3.3. Tonometer
- 1.3.4. Phoropter
- 1.3.5. Keratometer
- 1.3.6. Lensometer
- 1.3.7. Other General Examinations
-
1.1. Retina Examination
-
2. End User
- 2.1. Eye Clinic
- 2.2. Hospital
- 2.3. Other End Users
Eye Testing Equipment Industry Segmentation By Geography
-
1. North America
- 1.1. United States
- 1.2. Canada
- 1.3. Mexico
-
2. Europe
- 2.1. Germany
- 2.2. United Kingdom
- 2.3. France
- 2.4. Italy
- 2.5. Spain
- 2.6. Rest of Europe
-
3. Asia Pacific
- 3.1. China
- 3.2. Japan
- 3.3. India
- 3.4. Australia
- 3.5. South Korea
- 3.6. Rest of Asia Pacific
-
4. Middle East and Africa
- 4.1. GCC
- 4.2. South Africa
- 4.3. Rest of Middle East and Africa
-
5. South America
- 5.1. Brazil
- 5.2. Argentina
- 5.3. Rest of South America
Eye Testing Equipment Industry REPORT HIGHLIGHTS
| Aspects | Details |
|---|---|
| Study Period | 2019-2033 |
| Base Year | 2024 |
| Estimated Year | 2025 |
| Forecast Period | 2025-2033 |
| Historical Period | 2019-2024 |
| Growth Rate | CAGR of 6.35% from 2019-2033 |
| Segmentation |
|
Table of Contents
- 1. Introduction
- 1.1. Research Scope
- 1.2. Market Segmentation
- 1.3. Research Methodology
- 1.4. Definitions and Assumptions
- 2. Executive Summary
- 2.1. Introduction
- 3. Market Dynamics
- 3.1. Introduction
- 3.2. Market Drivers
- 3.2.1. Rising Prevalence of Eye Diseases; Technological Advancements in Ophthalmic Devices; Increasing Government Initiatives to Control Visual Impairment
- 3.3. Market Restrains
- 3.3.1. High Cost of Eye Examination Equipment; Lack of Awareness and Low Accessibility to Eye Care in Low-income Economies
- 3.4. Market Trends
- 3.4.1. OCT Scanner Segment is Expected to Hold Significant Market Share Over the Forecast Period
- 4. Market Factor Analysis
- 4.1. Porters Five Forces
- 4.2. Supply/Value Chain
- 4.3. PESTEL analysis
- 4.4. Market Entropy
- 4.5. Patent/Trademark Analysis
- 5. Global Eye Testing Equipment Industry Analysis, Insights and Forecast, 2019-2031
- 5.1. Market Analysis, Insights and Forecast - by Type of Examination
- 5.1.1. Retina Examination
- 5.1.1.1. OCT Scanner
- 5.1.1.2. Fundus Camera
- 5.1.1.3. Visual Field Analyzer
- 5.1.1.4. Ophthalmoscope
- 5.1.1.5. Retinoscope
- 5.1.2. Cornea Examination
- 5.1.2.1. Wavefront Aberrometer
- 5.1.2.2. Specular Microscope
- 5.1.2.3. Other Cornea Examinations
- 5.1.3. General Examination
- 5.1.3.1. Autorefractor
- 5.1.3.2. Ophthalmic Ultrasound System
- 5.1.3.3. Tonometer
- 5.1.3.4. Phoropter
- 5.1.3.5. Keratometer
- 5.1.3.6. Lensometer
- 5.1.3.7. Other General Examinations
- 5.1.1. Retina Examination
- 5.2. Market Analysis, Insights and Forecast - by End User
- 5.2.1. Eye Clinic
- 5.2.2. Hospital
- 5.2.3. Other End Users
- 5.3. Market Analysis, Insights and Forecast - by Region
- 5.3.1. North America
- 5.3.2. Europe
- 5.3.3. Asia Pacific
- 5.3.4. Middle East and Africa
- 5.3.5. South America
- 5.1. Market Analysis, Insights and Forecast - by Type of Examination
- 6. North America Eye Testing Equipment Industry Analysis, Insights and Forecast, 2019-2031
- 6.1. Market Analysis, Insights and Forecast - by Type of Examination
- 6.1.1. Retina Examination
- 6.1.1.1. OCT Scanner
- 6.1.1.2. Fundus Camera
- 6.1.1.3. Visual Field Analyzer
- 6.1.1.4. Ophthalmoscope
- 6.1.1.5. Retinoscope
- 6.1.2. Cornea Examination
- 6.1.2.1. Wavefront Aberrometer
- 6.1.2.2. Specular Microscope
- 6.1.2.3. Other Cornea Examinations
- 6.1.3. General Examination
- 6.1.3.1. Autorefractor
- 6.1.3.2. Ophthalmic Ultrasound System
- 6.1.3.3. Tonometer
- 6.1.3.4. Phoropter
- 6.1.3.5. Keratometer
- 6.1.3.6. Lensometer
- 6.1.3.7. Other General Examinations
- 6.1.1. Retina Examination
- 6.2. Market Analysis, Insights and Forecast - by End User
- 6.2.1. Eye Clinic
- 6.2.2. Hospital
- 6.2.3. Other End Users
- 6.1. Market Analysis, Insights and Forecast - by Type of Examination
- 7. Europe Eye Testing Equipment Industry Analysis, Insights and Forecast, 2019-2031
- 7.1. Market Analysis, Insights and Forecast - by Type of Examination
- 7.1.1. Retina Examination
- 7.1.1.1. OCT Scanner
- 7.1.1.2. Fundus Camera
- 7.1.1.3. Visual Field Analyzer
- 7.1.1.4. Ophthalmoscope
- 7.1.1.5. Retinoscope
- 7.1.2. Cornea Examination
- 7.1.2.1. Wavefront Aberrometer
- 7.1.2.2. Specular Microscope
- 7.1.2.3. Other Cornea Examinations
- 7.1.3. General Examination
- 7.1.3.1. Autorefractor
- 7.1.3.2. Ophthalmic Ultrasound System
- 7.1.3.3. Tonometer
- 7.1.3.4. Phoropter
- 7.1.3.5. Keratometer
- 7.1.3.6. Lensometer
- 7.1.3.7. Other General Examinations
- 7.1.1. Retina Examination
- 7.2. Market Analysis, Insights and Forecast - by End User
- 7.2.1. Eye Clinic
- 7.2.2. Hospital
- 7.2.3. Other End Users
- 7.1. Market Analysis, Insights and Forecast - by Type of Examination
- 8. Asia Pacific Eye Testing Equipment Industry Analysis, Insights and Forecast, 2019-2031
- 8.1. Market Analysis, Insights and Forecast - by Type of Examination
- 8.1.1. Retina Examination
- 8.1.1.1. OCT Scanner
- 8.1.1.2. Fundus Camera
- 8.1.1.3. Visual Field Analyzer
- 8.1.1.4. Ophthalmoscope
- 8.1.1.5. Retinoscope
- 8.1.2. Cornea Examination
- 8.1.2.1. Wavefront Aberrometer
- 8.1.2.2. Specular Microscope
- 8.1.2.3. Other Cornea Examinations
- 8.1.3. General Examination
- 8.1.3.1. Autorefractor
- 8.1.3.2. Ophthalmic Ultrasound System
- 8.1.3.3. Tonometer
- 8.1.3.4. Phoropter
- 8.1.3.5. Keratometer
- 8.1.3.6. Lensometer
- 8.1.3.7. Other General Examinations
- 8.1.1. Retina Examination
- 8.2. Market Analysis, Insights and Forecast - by End User
- 8.2.1. Eye Clinic
- 8.2.2. Hospital
- 8.2.3. Other End Users
- 8.1. Market Analysis, Insights and Forecast - by Type of Examination
- 9. Middle East and Africa Eye Testing Equipment Industry Analysis, Insights and Forecast, 2019-2031
- 9.1. Market Analysis, Insights and Forecast - by Type of Examination
- 9.1.1. Retina Examination
- 9.1.1.1. OCT Scanner
- 9.1.1.2. Fundus Camera
- 9.1.1.3. Visual Field Analyzer
- 9.1.1.4. Ophthalmoscope
- 9.1.1.5. Retinoscope
- 9.1.2. Cornea Examination
- 9.1.2.1. Wavefront Aberrometer
- 9.1.2.2. Specular Microscope
- 9.1.2.3. Other Cornea Examinations
- 9.1.3. General Examination
- 9.1.3.1. Autorefractor
- 9.1.3.2. Ophthalmic Ultrasound System
- 9.1.3.3. Tonometer
- 9.1.3.4. Phoropter
- 9.1.3.5. Keratometer
- 9.1.3.6. Lensometer
- 9.1.3.7. Other General Examinations
- 9.1.1. Retina Examination
- 9.2. Market Analysis, Insights and Forecast - by End User
- 9.2.1. Eye Clinic
- 9.2.2. Hospital
- 9.2.3. Other End Users
- 9.1. Market Analysis, Insights and Forecast - by Type of Examination
- 10. South America Eye Testing Equipment Industry Analysis, Insights and Forecast, 2019-2031
- 10.1. Market Analysis, Insights and Forecast - by Type of Examination
- 10.1.1. Retina Examination
- 10.1.1.1. OCT Scanner
- 10.1.1.2. Fundus Camera
- 10.1.1.3. Visual Field Analyzer
- 10.1.1.4. Ophthalmoscope
- 10.1.1.5. Retinoscope
- 10.1.2. Cornea Examination
- 10.1.2.1. Wavefront Aberrometer
- 10.1.2.2. Specular Microscope
- 10.1.2.3. Other Cornea Examinations
- 10.1.3. General Examination
- 10.1.3.1. Autorefractor
- 10.1.3.2. Ophthalmic Ultrasound System
- 10.1.3.3. Tonometer
- 10.1.3.4. Phoropter
- 10.1.3.5. Keratometer
- 10.1.3.6. Lensometer
- 10.1.3.7. Other General Examinations
- 10.1.1. Retina Examination
- 10.2. Market Analysis, Insights and Forecast - by End User
- 10.2.1. Eye Clinic
- 10.2.2. Hospital
- 10.2.3. Other End Users
- 10.1. Market Analysis, Insights and Forecast - by Type of Examination
- 11. North America Eye Testing Equipment Industry Analysis, Insights and Forecast, 2019-2031
- 11.1. Market Analysis, Insights and Forecast - By Country/Sub-region
- 11.1.1 United States
- 11.1.2 Canada
- 11.1.3 Mexico
- 12. Europe Eye Testing Equipment Industry Analysis, Insights and Forecast, 2019-2031
- 12.1. Market Analysis, Insights and Forecast - By Country/Sub-region
- 12.1.1 Germany
- 12.1.2 United Kingdom
- 12.1.3 France
- 12.1.4 Italy
- 12.1.5 Spain
- 12.1.6 Rest of Europe
- 13. Asia Pacific Eye Testing Equipment Industry Analysis, Insights and Forecast, 2019-2031
- 13.1. Market Analysis, Insights and Forecast - By Country/Sub-region
- 13.1.1 China
- 13.1.2 Japan
- 13.1.3 India
- 13.1.4 Australia
- 13.1.5 South Korea
- 13.1.6 Rest of Asia Pacific
- 14. Middle East and Africa Eye Testing Equipment Industry Analysis, Insights and Forecast, 2019-2031
- 14.1. Market Analysis, Insights and Forecast - By Country/Sub-region
- 14.1.1 GCC
- 14.1.2 South Africa
- 14.1.3 Rest of Middle East and Africa
- 15. South America Eye Testing Equipment Industry Analysis, Insights and Forecast, 2019-2031
- 15.1. Market Analysis, Insights and Forecast - By Country/Sub-region
- 15.1.1 Brazil
- 15.1.2 Argentina
- 15.1.3 Rest of South America
- 16. Competitive Analysis
- 16.1. Global Market Share Analysis 2024
- 16.2. Company Profiles
- 16.2.1 AMETEK PIP Holdings Inc (Reichert Technologies)
- 16.2.1.1. Overview
- 16.2.1.2. Products
- 16.2.1.3. SWOT Analysis
- 16.2.1.4. Recent Developments
- 16.2.1.5. Financials (Based on Availability)
- 16.2.2 Bausch Health Companies Inc (Bausch + Lomb)
- 16.2.2.1. Overview
- 16.2.2.2. Products
- 16.2.2.3. SWOT Analysis
- 16.2.2.4. Recent Developments
- 16.2.2.5. Financials (Based on Availability)
- 16.2.3 Halma plc (Keeler Ltd)
- 16.2.3.1. Overview
- 16.2.3.2. Products
- 16.2.3.3. SWOT Analysis
- 16.2.3.4. Recent Developments
- 16.2.3.5. Financials (Based on Availability)
- 16.2.4 Heidelberg Engineering GmbH (Heidelberg Engineering Inc )
- 16.2.4.1. Overview
- 16.2.4.2. Products
- 16.2.4.3. SWOT Analysis
- 16.2.4.4. Recent Developments
- 16.2.4.5. Financials (Based on Availability)
- 16.2.5 Canon Inc
- 16.2.5.1. Overview
- 16.2.5.2. Products
- 16.2.5.3. SWOT Analysis
- 16.2.5.4. Recent Developments
- 16.2.5.5. Financials (Based on Availability)
- 16.2.6 Carl Zeiss Meditec AG
- 16.2.6.1. Overview
- 16.2.6.2. Products
- 16.2.6.3. SWOT Analysis
- 16.2.6.4. Recent Developments
- 16.2.6.5. Financials (Based on Availability)
- 16.2.7 Revenio Group PLC (iCare Finland OY)
- 16.2.7.1. Overview
- 16.2.7.2. Products
- 16.2.7.3. SWOT Analysis
- 16.2.7.4. Recent Developments
- 16.2.7.5. Financials (Based on Availability)
- 16.2.8 Oculus Inc
- 16.2.8.1. Overview
- 16.2.8.2. Products
- 16.2.8.3. SWOT Analysis
- 16.2.8.4. Recent Developments
- 16.2.8.5. Financials (Based on Availability)
- 16.2.9 Nidek Co Ltd
- 16.2.9.1. Overview
- 16.2.9.2. Products
- 16.2.9.3. SWOT Analysis
- 16.2.9.4. Recent Developments
- 16.2.9.5. Financials (Based on Availability)
- 16.2.10 Johnson & Johnson
- 16.2.10.1. Overview
- 16.2.10.2. Products
- 16.2.10.3. SWOT Analysis
- 16.2.10.4. Recent Developments
- 16.2.10.5. Financials (Based on Availability)
- 16.2.11 Alcon
- 16.2.11.1. Overview
- 16.2.11.2. Products
- 16.2.11.3. SWOT Analysis
- 16.2.11.4. Recent Developments
- 16.2.11.5. Financials (Based on Availability)
- 16.2.12 Essilor Luxottica (Essilor International SA)
- 16.2.12.1. Overview
- 16.2.12.2. Products
- 16.2.12.3. SWOT Analysis
- 16.2.12.4. Recent Developments
- 16.2.12.5. Financials (Based on Availability)
- 16.2.13 HEINE Optotechnik
- 16.2.13.1. Overview
- 16.2.13.2. Products
- 16.2.13.3. SWOT Analysis
- 16.2.13.4. Recent Developments
- 16.2.13.5. Financials (Based on Availability)
- 16.2.1 AMETEK PIP Holdings Inc (Reichert Technologies)
List of Figures
- Figure 1: Global Eye Testing Equipment Industry Revenue Breakdown (Million, %) by Region 2024 & 2032
- Figure 2: Global Eye Testing Equipment Industry Volume Breakdown (K Unit, %) by Region 2024 & 2032
- Figure 3: North America Eye Testing Equipment Industry Revenue (Million), by Country 2024 & 2032
- Figure 4: North America Eye Testing Equipment Industry Volume (K Unit), by Country 2024 & 2032
- Figure 5: North America Eye Testing Equipment Industry Revenue Share (%), by Country 2024 & 2032
- Figure 6: North America Eye Testing Equipment Industry Volume Share (%), by Country 2024 & 2032
- Figure 7: Europe Eye Testing Equipment Industry Revenue (Million), by Country 2024 & 2032
- Figure 8: Europe Eye Testing Equipment Industry Volume (K Unit), by Country 2024 & 2032
- Figure 9: Europe Eye Testing Equipment Industry Revenue Share (%), by Country 2024 & 2032
- Figure 10: Europe Eye Testing Equipment Industry Volume Share (%), by Country 2024 & 2032
- Figure 11: Asia Pacific Eye Testing Equipment Industry Revenue (Million), by Country 2024 & 2032
- Figure 12: Asia Pacific Eye Testing Equipment Industry Volume (K Unit), by Country 2024 & 2032
- Figure 13: Asia Pacific Eye Testing Equipment Industry Revenue Share (%), by Country 2024 & 2032
- Figure 14: Asia Pacific Eye Testing Equipment Industry Volume Share (%), by Country 2024 & 2032
- Figure 15: Middle East and Africa Eye Testing Equipment Industry Revenue (Million), by Country 2024 & 2032
- Figure 16: Middle East and Africa Eye Testing Equipment Industry Volume (K Unit), by Country 2024 & 2032
- Figure 17: Middle East and Africa Eye Testing Equipment Industry Revenue Share (%), by Country 2024 & 2032
- Figure 18: Middle East and Africa Eye Testing Equipment Industry Volume Share (%), by Country 2024 & 2032
- Figure 19: South America Eye Testing Equipment Industry Revenue (Million), by Country 2024 & 2032
- Figure 20: South America Eye Testing Equipment Industry Volume (K Unit), by Country 2024 & 2032
- Figure 21: South America Eye Testing Equipment Industry Revenue Share (%), by Country 2024 & 2032
- Figure 22: South America Eye Testing Equipment Industry Volume Share (%), by Country 2024 & 2032
- Figure 23: North America Eye Testing Equipment Industry Revenue (Million), by Type of Examination 2024 & 2032
- Figure 24: North America Eye Testing Equipment Industry Volume (K Unit), by Type of Examination 2024 & 2032
- Figure 25: North America Eye Testing Equipment Industry Revenue Share (%), by Type of Examination 2024 & 2032
- Figure 26: North America Eye Testing Equipment Industry Volume Share (%), by Type of Examination 2024 & 2032
- Figure 27: North America Eye Testing Equipment Industry Revenue (Million), by End User 2024 & 2032
- Figure 28: North America Eye Testing Equipment Industry Volume (K Unit), by End User 2024 & 2032
- Figure 29: North America Eye Testing Equipment Industry Revenue Share (%), by End User 2024 & 2032
- Figure 30: North America Eye Testing Equipment Industry Volume Share (%), by End User 2024 & 2032
- Figure 31: North America Eye Testing Equipment Industry Revenue (Million), by Country 2024 & 2032
- Figure 32: North America Eye Testing Equipment Industry Volume (K Unit), by Country 2024 & 2032
- Figure 33: North America Eye Testing Equipment Industry Revenue Share (%), by Country 2024 & 2032
- Figure 34: North America Eye Testing Equipment Industry Volume Share (%), by Country 2024 & 2032
- Figure 35: Europe Eye Testing Equipment Industry Revenue (Million), by Type of Examination 2024 & 2032
- Figure 36: Europe Eye Testing Equipment Industry Volume (K Unit), by Type of Examination 2024 & 2032
- Figure 37: Europe Eye Testing Equipment Industry Revenue Share (%), by Type of Examination 2024 & 2032
- Figure 38: Europe Eye Testing Equipment Industry Volume Share (%), by Type of Examination 2024 & 2032
- Figure 39: Europe Eye Testing Equipment Industry Revenue (Million), by End User 2024 & 2032
- Figure 40: Europe Eye Testing Equipment Industry Volume (K Unit), by End User 2024 & 2032
- Figure 41: Europe Eye Testing Equipment Industry Revenue Share (%), by End User 2024 & 2032
- Figure 42: Europe Eye Testing Equipment Industry Volume Share (%), by End User 2024 & 2032
- Figure 43: Europe Eye Testing Equipment Industry Revenue (Million), by Country 2024 & 2032
- Figure 44: Europe Eye Testing Equipment Industry Volume (K Unit), by Country 2024 & 2032
- Figure 45: Europe Eye Testing Equipment Industry Revenue Share (%), by Country 2024 & 2032
- Figure 46: Europe Eye Testing Equipment Industry Volume Share (%), by Country 2024 & 2032
- Figure 47: Asia Pacific Eye Testing Equipment Industry Revenue (Million), by Type of Examination 2024 & 2032
- Figure 48: Asia Pacific Eye Testing Equipment Industry Volume (K Unit), by Type of Examination 2024 & 2032
- Figure 49: Asia Pacific Eye Testing Equipment Industry Revenue Share (%), by Type of Examination 2024 & 2032
- Figure 50: Asia Pacific Eye Testing Equipment Industry Volume Share (%), by Type of Examination 2024 & 2032
- Figure 51: Asia Pacific Eye Testing Equipment Industry Revenue (Million), by End User 2024 & 2032
- Figure 52: Asia Pacific Eye Testing Equipment Industry Volume (K Unit), by End User 2024 & 2032
- Figure 53: Asia Pacific Eye Testing Equipment Industry Revenue Share (%), by End User 2024 & 2032
- Figure 54: Asia Pacific Eye Testing Equipment Industry Volume Share (%), by End User 2024 & 2032
- Figure 55: Asia Pacific Eye Testing Equipment Industry Revenue (Million), by Country 2024 & 2032
- Figure 56: Asia Pacific Eye Testing Equipment Industry Volume (K Unit), by Country 2024 & 2032
- Figure 57: Asia Pacific Eye Testing Equipment Industry Revenue Share (%), by Country 2024 & 2032
- Figure 58: Asia Pacific Eye Testing Equipment Industry Volume Share (%), by Country 2024 & 2032
- Figure 59: Middle East and Africa Eye Testing Equipment Industry Revenue (Million), by Type of Examination 2024 & 2032
- Figure 60: Middle East and Africa Eye Testing Equipment Industry Volume (K Unit), by Type of Examination 2024 & 2032
- Figure 61: Middle East and Africa Eye Testing Equipment Industry Revenue Share (%), by Type of Examination 2024 & 2032
- Figure 62: Middle East and Africa Eye Testing Equipment Industry Volume Share (%), by Type of Examination 2024 & 2032
- Figure 63: Middle East and Africa Eye Testing Equipment Industry Revenue (Million), by End User 2024 & 2032
- Figure 64: Middle East and Africa Eye Testing Equipment Industry Volume (K Unit), by End User 2024 & 2032
- Figure 65: Middle East and Africa Eye Testing Equipment Industry Revenue Share (%), by End User 2024 & 2032
- Figure 66: Middle East and Africa Eye Testing Equipment Industry Volume Share (%), by End User 2024 & 2032
- Figure 67: Middle East and Africa Eye Testing Equipment Industry Revenue (Million), by Country 2024 & 2032
- Figure 68: Middle East and Africa Eye Testing Equipment Industry Volume (K Unit), by Country 2024 & 2032
- Figure 69: Middle East and Africa Eye Testing Equipment Industry Revenue Share (%), by Country 2024 & 2032
- Figure 70: Middle East and Africa Eye Testing Equipment Industry Volume Share (%), by Country 2024 & 2032
- Figure 71: South America Eye Testing Equipment Industry Revenue (Million), by Type of Examination 2024 & 2032
- Figure 72: South America Eye Testing Equipment Industry Volume (K Unit), by Type of Examination 2024 & 2032
- Figure 73: South America Eye Testing Equipment Industry Revenue Share (%), by Type of Examination 2024 & 2032
- Figure 74: South America Eye Testing Equipment Industry Volume Share (%), by Type of Examination 2024 & 2032
- Figure 75: South America Eye Testing Equipment Industry Revenue (Million), by End User 2024 & 2032
- Figure 76: South America Eye Testing Equipment Industry Volume (K Unit), by End User 2024 & 2032
- Figure 77: South America Eye Testing Equipment Industry Revenue Share (%), by End User 2024 & 2032
- Figure 78: South America Eye Testing Equipment Industry Volume Share (%), by End User 2024 & 2032
- Figure 79: South America Eye Testing Equipment Industry Revenue (Million), by Country 2024 & 2032
- Figure 80: South America Eye Testing Equipment Industry Volume (K Unit), by Country 2024 & 2032
- Figure 81: South America Eye Testing Equipment Industry Revenue Share (%), by Country 2024 & 2032
- Figure 82: South America Eye Testing Equipment Industry Volume Share (%), by Country 2024 & 2032
List of Tables
- Table 1: Global Eye Testing Equipment Industry Revenue Million Forecast, by Region 2019 & 2032
- Table 2: Global Eye Testing Equipment Industry Volume K Unit Forecast, by Region 2019 & 2032
- Table 3: Global Eye Testing Equipment Industry Revenue Million Forecast, by Type of Examination 2019 & 2032
- Table 4: Global Eye Testing Equipment Industry Volume K Unit Forecast, by Type of Examination 2019 & 2032
- Table 5: Global Eye Testing Equipment Industry Revenue Million Forecast, by End User 2019 & 2032
- Table 6: Global Eye Testing Equipment Industry Volume K Unit Forecast, by End User 2019 & 2032
- Table 7: Global Eye Testing Equipment Industry Revenue Million Forecast, by Region 2019 & 2032
- Table 8: Global Eye Testing Equipment Industry Volume K Unit Forecast, by Region 2019 & 2032
- Table 9: Global Eye Testing Equipment Industry Revenue Million Forecast, by Country 2019 & 2032
- Table 10: Global Eye Testing Equipment Industry Volume K Unit Forecast, by Country 2019 & 2032
- Table 11: United States Eye Testing Equipment Industry Revenue (Million) Forecast, by Application 2019 & 2032
- Table 12: United States Eye Testing Equipment Industry Volume (K Unit) Forecast, by Application 2019 & 2032
- Table 13: Canada Eye Testing Equipment Industry Revenue (Million) Forecast, by Application 2019 & 2032
- Table 14: Canada Eye Testing Equipment Industry Volume (K Unit) Forecast, by Application 2019 & 2032
- Table 15: Mexico Eye Testing Equipment Industry Revenue (Million) Forecast, by Application 2019 & 2032
- Table 16: Mexico Eye Testing Equipment Industry Volume (K Unit) Forecast, by Application 2019 & 2032
- Table 17: Global Eye Testing Equipment Industry Revenue Million Forecast, by Country 2019 & 2032
- Table 18: Global Eye Testing Equipment Industry Volume K Unit Forecast, by Country 2019 & 2032
- Table 19: Germany Eye Testing Equipment Industry Revenue (Million) Forecast, by Application 2019 & 2032
- Table 20: Germany Eye Testing Equipment Industry Volume (K Unit) Forecast, by Application 2019 & 2032
- Table 21: United Kingdom Eye Testing Equipment Industry Revenue (Million) Forecast, by Application 2019 & 2032
- Table 22: United Kingdom Eye Testing Equipment Industry Volume (K Unit) Forecast, by Application 2019 & 2032
- Table 23: France Eye Testing Equipment Industry Revenue (Million) Forecast, by Application 2019 & 2032
- Table 24: France Eye Testing Equipment Industry Volume (K Unit) Forecast, by Application 2019 & 2032
- Table 25: Italy Eye Testing Equipment Industry Revenue (Million) Forecast, by Application 2019 & 2032
- Table 26: Italy Eye Testing Equipment Industry Volume (K Unit) Forecast, by Application 2019 & 2032
- Table 27: Spain Eye Testing Equipment Industry Revenue (Million) Forecast, by Application 2019 & 2032
- Table 28: Spain Eye Testing Equipment Industry Volume (K Unit) Forecast, by Application 2019 & 2032
- Table 29: Rest of Europe Eye Testing Equipment Industry Revenue (Million) Forecast, by Application 2019 & 2032
- Table 30: Rest of Europe Eye Testing Equipment Industry Volume (K Unit) Forecast, by Application 2019 & 2032
- Table 31: Global Eye Testing Equipment Industry Revenue Million Forecast, by Country 2019 & 2032
- Table 32: Global Eye Testing Equipment Industry Volume K Unit Forecast, by Country 2019 & 2032
- Table 33: China Eye Testing Equipment Industry Revenue (Million) Forecast, by Application 2019 & 2032
- Table 34: China Eye Testing Equipment Industry Volume (K Unit) Forecast, by Application 2019 & 2032
- Table 35: Japan Eye Testing Equipment Industry Revenue (Million) Forecast, by Application 2019 & 2032
- Table 36: Japan Eye Testing Equipment Industry Volume (K Unit) Forecast, by Application 2019 & 2032
- Table 37: India Eye Testing Equipment Industry Revenue (Million) Forecast, by Application 2019 & 2032
- Table 38: India Eye Testing Equipment Industry Volume (K Unit) Forecast, by Application 2019 & 2032
- Table 39: Australia Eye Testing Equipment Industry Revenue (Million) Forecast, by Application 2019 & 2032
- Table 40: Australia Eye Testing Equipment Industry Volume (K Unit) Forecast, by Application 2019 & 2032
- Table 41: South Korea Eye Testing Equipment Industry Revenue (Million) Forecast, by Application 2019 & 2032
- Table 42: South Korea Eye Testing Equipment Industry Volume (K Unit) Forecast, by Application 2019 & 2032
- Table 43: Rest of Asia Pacific Eye Testing Equipment Industry Revenue (Million) Forecast, by Application 2019 & 2032
- Table 44: Rest of Asia Pacific Eye Testing Equipment Industry Volume (K Unit) Forecast, by Application 2019 & 2032
- Table 45: Global Eye Testing Equipment Industry Revenue Million Forecast, by Country 2019 & 2032
- Table 46: Global Eye Testing Equipment Industry Volume K Unit Forecast, by Country 2019 & 2032
- Table 47: GCC Eye Testing Equipment Industry Revenue (Million) Forecast, by Application 2019 & 2032
- Table 48: GCC Eye Testing Equipment Industry Volume (K Unit) Forecast, by Application 2019 & 2032
- Table 49: South Africa Eye Testing Equipment Industry Revenue (Million) Forecast, by Application 2019 & 2032
- Table 50: South Africa Eye Testing Equipment Industry Volume (K Unit) Forecast, by Application 2019 & 2032
- Table 51: Rest of Middle East and Africa Eye Testing Equipment Industry Revenue (Million) Forecast, by Application 2019 & 2032
- Table 52: Rest of Middle East and Africa Eye Testing Equipment Industry Volume (K Unit) Forecast, by Application 2019 & 2032
- Table 53: Global Eye Testing Equipment Industry Revenue Million Forecast, by Country 2019 & 2032
- Table 54: Global Eye Testing Equipment Industry Volume K Unit Forecast, by Country 2019 & 2032
- Table 55: Brazil Eye Testing Equipment Industry Revenue (Million) Forecast, by Application 2019 & 2032
- Table 56: Brazil Eye Testing Equipment Industry Volume (K Unit) Forecast, by Application 2019 & 2032
- Table 57: Argentina Eye Testing Equipment Industry Revenue (Million) Forecast, by Application 2019 & 2032
- Table 58: Argentina Eye Testing Equipment Industry Volume (K Unit) Forecast, by Application 2019 & 2032
- Table 59: Rest of South America Eye Testing Equipment Industry Revenue (Million) Forecast, by Application 2019 & 2032
- Table 60: Rest of South America Eye Testing Equipment Industry Volume (K Unit) Forecast, by Application 2019 & 2032
- Table 61: Global Eye Testing Equipment Industry Revenue Million Forecast, by Type of Examination 2019 & 2032
- Table 62: Global Eye Testing Equipment Industry Volume K Unit Forecast, by Type of Examination 2019 & 2032
- Table 63: Global Eye Testing Equipment Industry Revenue Million Forecast, by End User 2019 & 2032
- Table 64: Global Eye Testing Equipment Industry Volume K Unit Forecast, by End User 2019 & 2032
- Table 65: Global Eye Testing Equipment Industry Revenue Million Forecast, by Country 2019 & 2032
- Table 66: Global Eye Testing Equipment Industry Volume K Unit Forecast, by Country 2019 & 2032
- Table 67: United States Eye Testing Equipment Industry Revenue (Million) Forecast, by Application 2019 & 2032
- Table 68: United States Eye Testing Equipment Industry Volume (K Unit) Forecast, by Application 2019 & 2032
- Table 69: Canada Eye Testing Equipment Industry Revenue (Million) Forecast, by Application 2019 & 2032
- Table 70: Canada Eye Testing Equipment Industry Volume (K Unit) Forecast, by Application 2019 & 2032
- Table 71: Mexico Eye Testing Equipment Industry Revenue (Million) Forecast, by Application 2019 & 2032
- Table 72: Mexico Eye Testing Equipment Industry Volume (K Unit) Forecast, by Application 2019 & 2032
- Table 73: Global Eye Testing Equipment Industry Revenue Million Forecast, by Type of Examination 2019 & 2032
- Table 74: Global Eye Testing Equipment Industry Volume K Unit Forecast, by Type of Examination 2019 & 2032
- Table 75: Global Eye Testing Equipment Industry Revenue Million Forecast, by End User 2019 & 2032
- Table 76: Global Eye Testing Equipment Industry Volume K Unit Forecast, by End User 2019 & 2032
- Table 77: Global Eye Testing Equipment Industry Revenue Million Forecast, by Country 2019 & 2032
- Table 78: Global Eye Testing Equipment Industry Volume K Unit Forecast, by Country 2019 & 2032
- Table 79: Germany Eye Testing Equipment Industry Revenue (Million) Forecast, by Application 2019 & 2032
- Table 80: Germany Eye Testing Equipment Industry Volume (K Unit) Forecast, by Application 2019 & 2032
- Table 81: United Kingdom Eye Testing Equipment Industry Revenue (Million) Forecast, by Application 2019 & 2032
- Table 82: United Kingdom Eye Testing Equipment Industry Volume (K Unit) Forecast, by Application 2019 & 2032
- Table 83: France Eye Testing Equipment Industry Revenue (Million) Forecast, by Application 2019 & 2032
- Table 84: France Eye Testing Equipment Industry Volume (K Unit) Forecast, by Application 2019 & 2032
- Table 85: Italy Eye Testing Equipment Industry Revenue (Million) Forecast, by Application 2019 & 2032
- Table 86: Italy Eye Testing Equipment Industry Volume (K Unit) Forecast, by Application 2019 & 2032
- Table 87: Spain Eye Testing Equipment Industry Revenue (Million) Forecast, by Application 2019 & 2032
- Table 88: Spain Eye Testing Equipment Industry Volume (K Unit) Forecast, by Application 2019 & 2032
- Table 89: Rest of Europe Eye Testing Equipment Industry Revenue (Million) Forecast, by Application 2019 & 2032
- Table 90: Rest of Europe Eye Testing Equipment Industry Volume (K Unit) Forecast, by Application 2019 & 2032
- Table 91: Global Eye Testing Equipment Industry Revenue Million Forecast, by Type of Examination 2019 & 2032
- Table 92: Global Eye Testing Equipment Industry Volume K Unit Forecast, by Type of Examination 2019 & 2032
- Table 93: Global Eye Testing Equipment Industry Revenue Million Forecast, by End User 2019 & 2032
- Table 94: Global Eye Testing Equipment Industry Volume K Unit Forecast, by End User 2019 & 2032
- Table 95: Global Eye Testing Equipment Industry Revenue Million Forecast, by Country 2019 & 2032
- Table 96: Global Eye Testing Equipment Industry Volume K Unit Forecast, by Country 2019 & 2032
- Table 97: China Eye Testing Equipment Industry Revenue (Million) Forecast, by Application 2019 & 2032
- Table 98: China Eye Testing Equipment Industry Volume (K Unit) Forecast, by Application 2019 & 2032
- Table 99: Japan Eye Testing Equipment Industry Revenue (Million) Forecast, by Application 2019 & 2032
- Table 100: Japan Eye Testing Equipment Industry Volume (K Unit) Forecast, by Application 2019 & 2032
- Table 101: India Eye Testing Equipment Industry Revenue (Million) Forecast, by Application 2019 & 2032
- Table 102: India Eye Testing Equipment Industry Volume (K Unit) Forecast, by Application 2019 & 2032
- Table 103: Australia Eye Testing Equipment Industry Revenue (Million) Forecast, by Application 2019 & 2032
- Table 104: Australia Eye Testing Equipment Industry Volume (K Unit) Forecast, by Application 2019 & 2032
- Table 105: South Korea Eye Testing Equipment Industry Revenue (Million) Forecast, by Application 2019 & 2032
- Table 106: South Korea Eye Testing Equipment Industry Volume (K Unit) Forecast, by Application 2019 & 2032
- Table 107: Rest of Asia Pacific Eye Testing Equipment Industry Revenue (Million) Forecast, by Application 2019 & 2032
- Table 108: Rest of Asia Pacific Eye Testing Equipment Industry Volume (K Unit) Forecast, by Application 2019 & 2032
- Table 109: Global Eye Testing Equipment Industry Revenue Million Forecast, by Type of Examination 2019 & 2032
- Table 110: Global Eye Testing Equipment Industry Volume K Unit Forecast, by Type of Examination 2019 & 2032
- Table 111: Global Eye Testing Equipment Industry Revenue Million Forecast, by End User 2019 & 2032
- Table 112: Global Eye Testing Equipment Industry Volume K Unit Forecast, by End User 2019 & 2032
- Table 113: Global Eye Testing Equipment Industry Revenue Million Forecast, by Country 2019 & 2032
- Table 114: Global Eye Testing Equipment Industry Volume K Unit Forecast, by Country 2019 & 2032
- Table 115: GCC Eye Testing Equipment Industry Revenue (Million) Forecast, by Application 2019 & 2032
- Table 116: GCC Eye Testing Equipment Industry Volume (K Unit) Forecast, by Application 2019 & 2032
- Table 117: South Africa Eye Testing Equipment Industry Revenue (Million) Forecast, by Application 2019 & 2032
- Table 118: South Africa Eye Testing Equipment Industry Volume (K Unit) Forecast, by Application 2019 & 2032
- Table 119: Rest of Middle East and Africa Eye Testing Equipment Industry Revenue (Million) Forecast, by Application 2019 & 2032
- Table 120: Rest of Middle East and Africa Eye Testing Equipment Industry Volume (K Unit) Forecast, by Application 2019 & 2032
- Table 121: Global Eye Testing Equipment Industry Revenue Million Forecast, by Type of Examination 2019 & 2032
- Table 122: Global Eye Testing Equipment Industry Volume K Unit Forecast, by Type of Examination 2019 & 2032
- Table 123: Global Eye Testing Equipment Industry Revenue Million Forecast, by End User 2019 & 2032
- Table 124: Global Eye Testing Equipment Industry Volume K Unit Forecast, by End User 2019 & 2032
- Table 125: Global Eye Testing Equipment Industry Revenue Million Forecast, by Country 2019 & 2032
- Table 126: Global Eye Testing Equipment Industry Volume K Unit Forecast, by Country 2019 & 2032
- Table 127: Brazil Eye Testing Equipment Industry Revenue (Million) Forecast, by Application 2019 & 2032
- Table 128: Brazil Eye Testing Equipment Industry Volume (K Unit) Forecast, by Application 2019 & 2032
- Table 129: Argentina Eye Testing Equipment Industry Revenue (Million) Forecast, by Application 2019 & 2032
- Table 130: Argentina Eye Testing Equipment Industry Volume (K Unit) Forecast, by Application 2019 & 2032
- Table 131: Rest of South America Eye Testing Equipment Industry Revenue (Million) Forecast, by Application 2019 & 2032
- Table 132: Rest of South America Eye Testing Equipment Industry Volume (K Unit) Forecast, by Application 2019 & 2032
Frequently Asked Questions
1. What is the projected Compound Annual Growth Rate (CAGR) of the Eye Testing Equipment Industry?
The projected CAGR is approximately 6.35%.
2. Which companies are prominent players in the Eye Testing Equipment Industry?
Key companies in the market include AMETEK PIP Holdings Inc (Reichert Technologies), Bausch Health Companies Inc (Bausch + Lomb), Halma plc (Keeler Ltd), Heidelberg Engineering GmbH (Heidelberg Engineering Inc ), Canon Inc, Carl Zeiss Meditec AG, Revenio Group PLC (iCare Finland OY), Oculus Inc , Nidek Co Ltd, Johnson & Johnson, Alcon, Essilor Luxottica (Essilor International SA), HEINE Optotechnik.
3. What are the main segments of the Eye Testing Equipment Industry?
The market segments include Type of Examination, End User.
4. Can you provide details about the market size?
The market size is estimated to be USD 4.79 Million as of 2022.
5. What are some drivers contributing to market growth?
Rising Prevalence of Eye Diseases; Technological Advancements in Ophthalmic Devices; Increasing Government Initiatives to Control Visual Impairment.
6. What are the notable trends driving market growth?
OCT Scanner Segment is Expected to Hold Significant Market Share Over the Forecast Period.
7. Are there any restraints impacting market growth?
High Cost of Eye Examination Equipment; Lack of Awareness and Low Accessibility to Eye Care in Low-income Economies.
8. Can you provide examples of recent developments in the market?
In July 2022, a mobile van was launched by Sightsavers under its National Truckers Eye Health Programme with the support of Cholamandalam Investment and Finance Company Limited (Chola) in Delhi-NCR to provide eye care services to the truckers' community. The van is equipped with the necessary tools and supplies, specifically an ophthalmoscope, a retinoscope, trial lenses, trial frames, a lensometer, vision charts, an occluder, and a drum for vision testing.
9. What pricing options are available for accessing the report?
Pricing options include single-user, multi-user, and enterprise licenses priced at USD 4750, USD 5250, and USD 8750 respectively.
10. Is the market size provided in terms of value or volume?
The market size is provided in terms of value, measured in Million and volume, measured in K Unit.
11. Are there any specific market keywords associated with the report?
Yes, the market keyword associated with the report is "Eye Testing Equipment Industry," which aids in identifying and referencing the specific market segment covered.
12. How do I determine which pricing option suits my needs best?
The pricing options vary based on user requirements and access needs. Individual users may opt for single-user licenses, while businesses requiring broader access may choose multi-user or enterprise licenses for cost-effective access to the report.
13. Are there any additional resources or data provided in the Eye Testing Equipment Industry report?
While the report offers comprehensive insights, it's advisable to review the specific contents or supplementary materials provided to ascertain if additional resources or data are available.
14. How can I stay updated on further developments or reports in the Eye Testing Equipment Industry?
To stay informed about further developments, trends, and reports in the Eye Testing Equipment Industry, consider subscribing to industry newsletters, following relevant companies and organizations, or regularly checking reputable industry news sources and publications.
Methodology
Step 1 - Identification of Relevant Samples Size from Population Database


Step 2 - Approaches for Defining Global Market Size (Value, Volume* & Price*)

Note*: In applicable scenarios
Step 3 - Data Sources
Primary Research
- Web Analytics
- Survey Reports
- Research Institute
- Latest Research Reports
- Opinion Leaders
Secondary Research
- Annual Reports
- White Paper
- Latest Press Release
- Industry Association
- Paid Database
- Investor Presentations

Step 4 - Data Triangulation
Involves using different sources of information in order to increase the validity of a study
These sources are likely to be stakeholders in a program - participants, other researchers, program staff, other community members, and so on.
Then we put all data in single framework & apply various statistical tools to find out the dynamic on the market.
During the analysis stage, feedback from the stakeholder groups would be compared to determine areas of agreement as well as areas of divergence


