

Key Insights
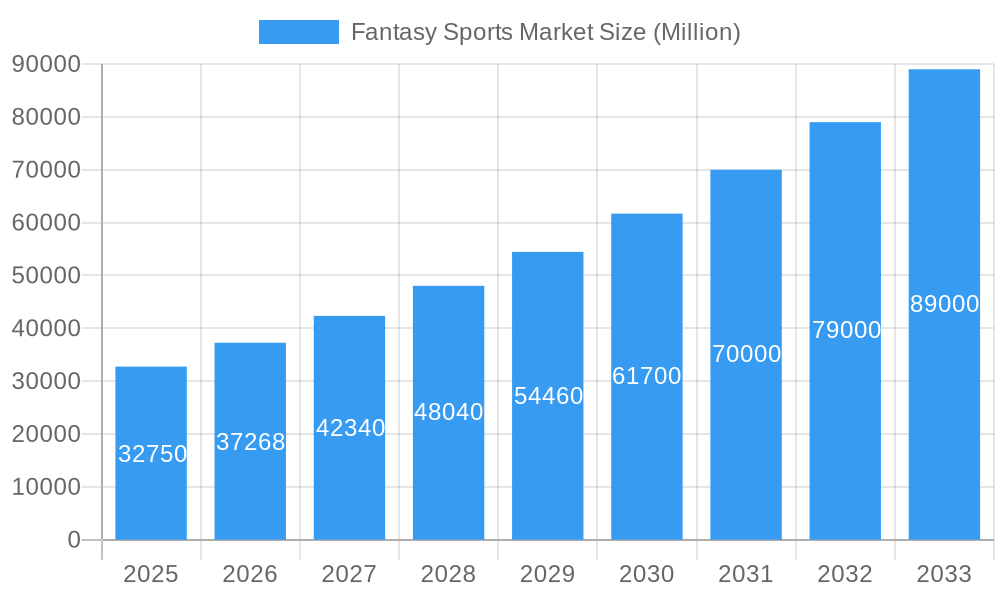
The global fantasy sports market is experiencing robust growth, projected to reach \$32.75 billion in 2025 and exhibiting a Compound Annual Growth Rate (CAGR) of 13.83% from 2025 to 2033. This expansion is fueled by several key factors. Increased smartphone penetration and readily available high-speed internet access have significantly broadened the market's reach, allowing participation across diverse demographics and geographic locations. The engaging nature of fantasy sports, combining strategic decision-making with the excitement of real-world sporting events, fosters high user retention and attracts new players. Furthermore, the continuous innovation within the fantasy sports industry, such as the introduction of daily fantasy sports formats and enhanced user interfaces, keeps the experience fresh and exciting. Strategic partnerships between fantasy sports platforms and major sports leagues and media organizations further amplify the market's visibility and attract a wider audience. The integration of advanced analytics and data-driven insights into the platforms enhances the user experience and encourages more strategic gameplay.
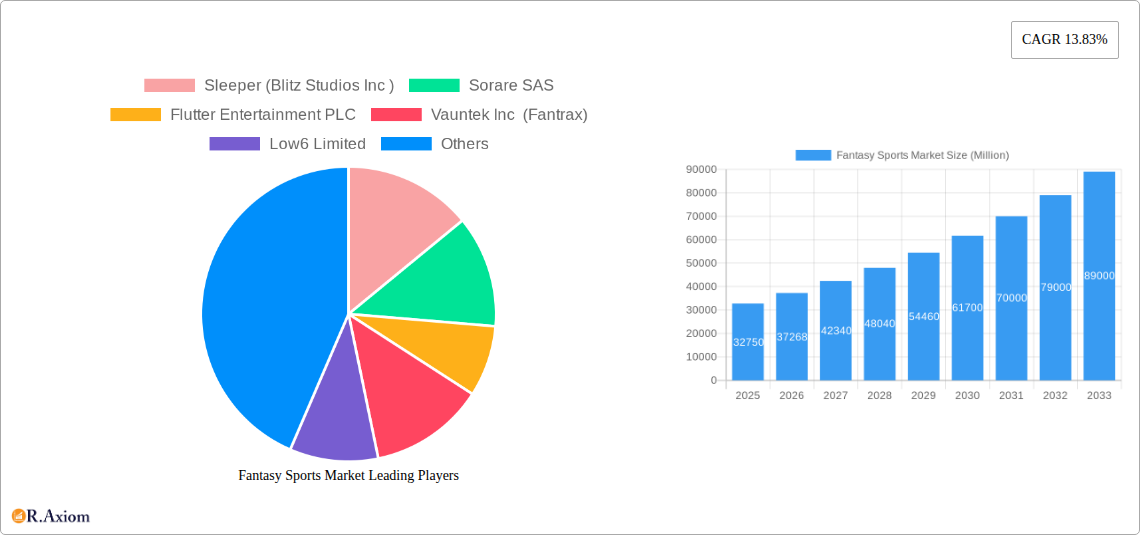
Fantasy Sports Market Market Size (In Billion)
Market segmentation reveals a strong preference for mobile applications as the primary platform for engagement, showcasing the industry's effective adaptation to mobile technology. The "Under 25 Years" demographic represents a significant segment, reflecting the increasing popularity of fantasy sports among younger generations. While individual competitions remain dominant, the growth of team competitions indicates a shifting trend toward collaborative engagement. Popular sports like football, baseball, and cricket continue to drive the market, however, the inclusion of diverse sports like basketball and car racing signifies diversification and the potential for growth in untapped segments. Geographic analysis indicates that North America currently holds a substantial market share, but Asia Pacific and other regions are demonstrating rapid growth potential, fueled by rising internet usage and increasing disposable incomes. The competitive landscape is dynamic, featuring established players like DraftKings and FanDuel, alongside emerging innovative platforms. This competition is fostering innovation and ultimately benefiting consumers through enhanced products and services.
Fantasy Sports Market Company Market Share
This detailed report provides a comprehensive analysis of the Fantasy Sports Market, covering market size, segmentation, key players, growth drivers, challenges, and future outlook. The study period spans from 2019 to 2033, with 2025 serving as the base and estimated year. The forecast period extends from 2025 to 2033, encompassing historical data from 2019 to 2024. This report is invaluable for industry stakeholders, investors, and anyone seeking a deep understanding of this dynamic market.
Fantasy Sports Market Market Concentration & Innovation
The Fantasy Sports Market exhibits a moderately concentrated landscape, with a few dominant players controlling significant market share. However, the market is characterized by continuous innovation, fueled by technological advancements and evolving consumer preferences. Market concentration is influenced by factors such as brand recognition, technological capabilities, and marketing reach. While precise market share data for each company requires further proprietary research, industry estimates suggest that DraftKings Inc. and FanDuel Group hold substantial market share. The M&A activity in the sector has been significant, with deal values ranging from tens of millions to hundreds of millions of USD. For instance, the Fantasy Akhada deal in January 2023 was valued at an estimated USD 160-175 Million.
- Key Players and Estimated Market Share (2025): DraftKings Inc. (xx%), FanDuel Group (xx%), Dream Sports Group (xx%), Yahoo Fantasy Sports LLC (xx%), Others (xx%). These percentages are estimates.
- M&A Activity: The market has witnessed significant consolidation through mergers and acquisitions, driven by the need to expand market reach, enhance technological capabilities, and access new customer segments. Total M&A deal value in the last 5 years is estimated at $xx Billion (an estimate).
- Innovation Drivers: The industry's growth is driven by advancements in mobile technology, data analytics, and the increasing popularity of daily fantasy sports. The integration of augmented and virtual reality (AR/VR) offers further potential for innovation.
- Regulatory Frameworks: Varying regulatory landscapes across different jurisdictions pose challenges and opportunities. Stricter regulations in some regions might limit growth, while lenient ones could boost market expansion.
- Product Substitutes: Traditional sports betting and other forms of online gaming compete for consumer attention, thus impacting market penetration.
- End-User Trends: The growing popularity of fantasy sports among millennials and Gen Z is a key driver, while increasing usage of mobile apps is transforming consumer engagement.
Fantasy Sports Market Industry Trends & Insights
The Fantasy Sports Market is experiencing robust growth, driven by factors such as rising smartphone penetration, increasing internet accessibility, and a surge in the popularity of online gaming. The market is anticipated to register a Compound Annual Growth Rate (CAGR) of xx% during the forecast period (2025-2033). Technological disruptions, particularly in mobile app development and data analytics, are significantly impacting market dynamics. Consumers increasingly prefer platforms offering personalized experiences, advanced analytics, and engaging social features. Competitive dynamics are intense, with companies investing heavily in marketing, product innovation, and strategic partnerships to gain a competitive edge. Market penetration is highest in North America, with Europe and Asia-Pacific regions exhibiting strong growth potential.
Dominant Markets & Segments in Fantasy Sports Market
- Leading Region: North America currently dominates the Fantasy Sports Market, driven by high internet penetration, a strong sports culture, and a large base of active fantasy sports players. However, Asia-Pacific is emerging as a high-growth region.
- Dominant Segment by Application: Team competition currently dominates, but individual competition is gaining traction, especially among younger demographics.
- Dominant Segment by Type: Football (American and Soccer) enjoys the largest market share due to its immense global popularity and extensive media coverage. Baseball, cricket, and basketball also hold significant market positions.
- Dominant Segment by Platform: Mobile applications are rapidly overtaking websites as the preferred platform for fantasy sports engagement due to their convenience and accessibility.
- Dominant Segment by Demographics: The 25-40 age group currently represents the largest segment, but the under-25 group is exhibiting rapid growth.
Key Drivers:
- North America: Strong sports culture, high disposable incomes, and developed technological infrastructure.
- Asia-Pacific: Rapidly growing internet and smartphone penetration, rising disposable incomes, and expanding interest in fantasy sports.
- Europe: Established sports leagues and a growing fan base for online gaming and fantasy sports.
Fantasy Sports Market Product Developments
Recent product innovations focus on enhancing user experience through advanced analytics, personalized recommendations, and improved social features. The integration of artificial intelligence (AI) and machine learning (ML) is enhancing the predictive capabilities of fantasy sports platforms. This enables more accurate player projections and personalized team optimization tools. These innovations improve user engagement and enhance the overall fantasy sports experience, creating a competitive advantage for platforms that adopt them.
Report Scope & Segmentation Analysis
This report segments the Fantasy Sports Market by application (Individual Competition, Team Competition), type (Football, Baseball, Cricket, Basketball, Car Racing, Others), platform (Website, Mobile Application), and demographics (Under 25 Years, Between 25 and 40 Years, Above 40 Years). Each segment is analyzed based on historical data, current market size, growth projections, and competitive dynamics. Market sizes and growth projections for each segment are detailed within the full report, which requires proprietary research to accurately assess these specific metrics.
Key Drivers of Fantasy Sports Market Growth
The growth of the Fantasy Sports Market is propelled by several key factors: the increasing popularity of mobile gaming, the rise of social media integration within fantasy sports platforms, the continuous improvement in data analytics and predictive modeling to enhance user experience, and ongoing technological advancements like AI/ML. Furthermore, the expansion of legal and regulated online sports betting in various jurisdictions adds to the market’s growth potential.
Challenges in the Fantasy Sports Market Sector
The Fantasy Sports Market faces several challenges including regulatory uncertainty in different jurisdictions, concerns about responsible gaming and preventing gambling addiction, intense competition among established and emerging players, and maintaining data security and user privacy. These factors can significantly impact the market's growth trajectory. The precise quantitative impact requires further specific research for accurate estimation.
Emerging Opportunities in Fantasy Sports Market
Emerging opportunities include the expansion into new geographical markets, especially in developing economies with growing internet and smartphone penetration. The integration of virtual reality (VR) and augmented reality (AR) technologies offers significant potential for enhanced engagement. Personalized user experiences, customized fantasy leagues, and innovative game formats are also expected to drive future growth.
Leading Players in the Fantasy Sports Market Market
- Sleeper (Blitz Studios Inc)
- Sorare SAS
- Flutter Entertainment PLC
- Vauntek Inc (Fantrax)
- Low6 Limited
- FanDuel Group
- NFL Enterprises LLC
- ESPN Sports Media Ltd
- RealTime Fantasy Sports Inc
- CBS Sports Digital
- Bovada
- DraftKings Inc
- Dream Sports Group
- Yahoo Fantasy Sports LLC
Key Developments in Fantasy Sports Market Industry
- March 2023: DraftKings Inc. expands its online sportsbook to Massachusetts, boosting its market presence and revenue potential.
- January 2023: Fantasy Akhada secures significant investment, indicating investor confidence and potential market expansion.
- May 2022: FSport partners with TV4, expanding its reach and creating new free-to-play opportunities. These developments signify market growth and the increasing adoption of innovative strategies by key players.
Strategic Outlook for Fantasy Sports Market Market
The Fantasy Sports Market is poised for sustained growth, driven by technological advancements, increasing consumer engagement, and expansion into new markets. The focus on personalized experiences, enhanced analytics, and responsible gaming practices will be crucial for companies to succeed. The market's future potential hinges on effectively navigating regulatory challenges and capitalizing on emerging technological opportunities. The adoption of new technologies like AR/VR and the expansion into esports fantasy leagues present significant opportunities for growth in the coming years.
Fantasy Sports Market Segmentation
-
1. Type
- 1.1. Football
- 1.2. Baseball
- 1.3. Cricket
- 1.4. Basketball
- 1.5. Car Racing
- 1.6. Other Types
-
2. Platform
- 2.1. Website
- 2.2. Mobile Application
-
3. Demographics
- 3.1. Under 25 Years
- 3.2. Between 25 and 40 Years
- 3.3. Above 40 Years
-
4. Application
- 4.1. Individual Competition
- 4.2. Team Competition
Fantasy Sports Market Segmentation By Geography
- 1. North America
- 2. Europe
- 3. Asia
- 4. Australia and New Zealand
- 5. Latin America
- 6. Middle East and Africa
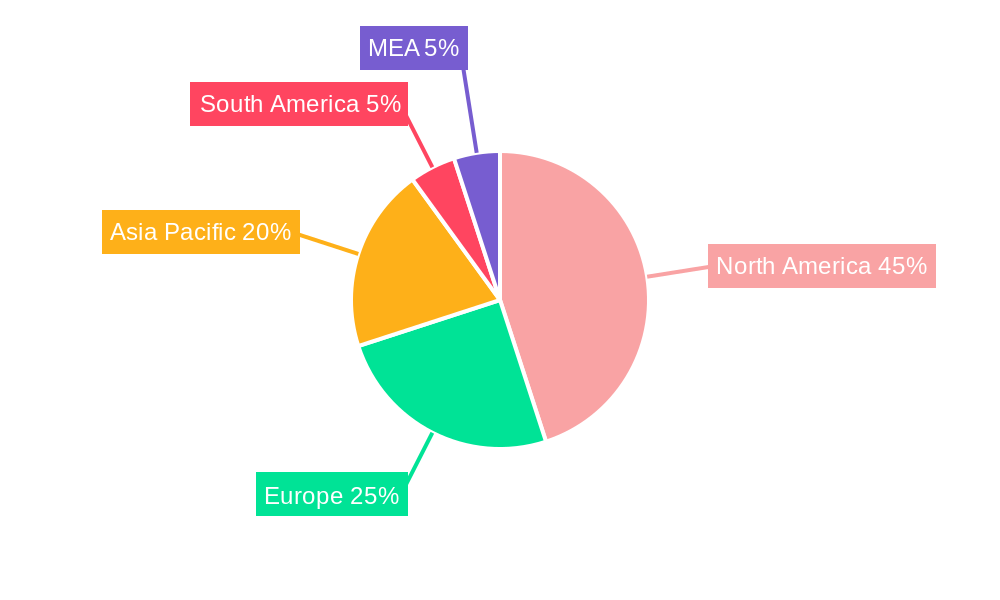
Fantasy Sports Market Regional Market Share
Geographic Coverage of Fantasy Sports Market
Fantasy Sports Market REPORT HIGHLIGHTS
| Aspects | Details |
|---|---|
| Study Period | 2020-2034 |
| Base Year | 2025 |
| Estimated Year | 2026 |
| Forecast Period | 2026-2034 |
| Historical Period | 2020-2025 |
| Growth Rate | CAGR of 13.83% from 2020-2034 |
| Segmentation |
|
Table of Contents
- 1. Introduction
- 1.1. Research Scope
- 1.2. Market Segmentation
- 1.3. Research Objective
- 1.4. Definitions and Assumptions
- 2. Executive Summary
- 2.1. Market Snapshot
- 3. Market Dynamics
- 3.1. Market Drivers
- 3.2. Market Restrains
- 3.3. Market Trends
- 3.4. Market Opportunities
- 4. Market Factor Analysis
- 4.1. Porters Five Forces
- 4.1.1. Bargaining Power of Suppliers
- 4.1.2. Bargaining Power of Buyers
- 4.1.3. Threat of New Entrants
- 4.1.4. Threat of Substitutes
- 4.1.5. Competitive Rivalry
- 4.2. PESTEL analysis
- 4.3. BCG Analysis
- 4.3.1. Stars (High Growth, High Market Share)
- 4.3.2. Cash Cows (Low Growth, High Market Share)
- 4.3.3. Question Mark (High Growth, Low Market Share)
- 4.3.4. Dogs (Low Growth, Low Market Share)
- 4.4. Ansoff Matrix Analysis
- 4.5. Supply Chain Analysis
- 4.6. Regulatory Landscape
- 4.7. Current Market Potential and Opportunity Assessment (TAM–SAM–SOM Framework)
- 4.8. RAX Analyst Note
- 4.1. Porters Five Forces
- 5. Market Analysis, Insights and Forecast 2021-2033
- 5.1. Market Analysis, Insights and Forecast - by Type
- 5.1.1. Football
- 5.1.2. Baseball
- 5.1.3. Cricket
- 5.1.4. Basketball
- 5.1.5. Car Racing
- 5.1.6. Other Types
- 5.2. Market Analysis, Insights and Forecast - by Platform
- 5.2.1. Website
- 5.2.2. Mobile Application
- 5.3. Market Analysis, Insights and Forecast - by Demographics
- 5.3.1. Under 25 Years
- 5.3.2. Between 25 and 40 Years
- 5.3.3. Above 40 Years
- 5.4. Market Analysis, Insights and Forecast - by Application
- 5.4.1. Individual Competition
- 5.4.2. Team Competition
- 5.5. Market Analysis, Insights and Forecast - by Region
- 5.5.1. North America
- 5.5.2. Europe
- 5.5.3. Asia
- 5.5.4. Australia and New Zealand
- 5.5.5. Latin America
- 5.5.6. Middle East and Africa
- 5.1. Market Analysis, Insights and Forecast - by Type
- 6. Global Fantasy Sports Market Analysis, Insights and Forecast, 2021-2033
- 6.1. Market Analysis, Insights and Forecast - by Type
- 6.1.1. Football
- 6.1.2. Baseball
- 6.1.3. Cricket
- 6.1.4. Basketball
- 6.1.5. Car Racing
- 6.1.6. Other Types
- 6.2. Market Analysis, Insights and Forecast - by Platform
- 6.2.1. Website
- 6.2.2. Mobile Application
- 6.3. Market Analysis, Insights and Forecast - by Demographics
- 6.3.1. Under 25 Years
- 6.3.2. Between 25 and 40 Years
- 6.3.3. Above 40 Years
- 6.4. Market Analysis, Insights and Forecast - by Application
- 6.4.1. Individual Competition
- 6.4.2. Team Competition
- 6.1. Market Analysis, Insights and Forecast - by Type
- 7. North America Fantasy Sports Market Analysis, Insights and Forecast, 2020-2032
- 7.1. Market Analysis, Insights and Forecast - by Type
- 7.1.1. Football
- 7.1.2. Baseball
- 7.1.3. Cricket
- 7.1.4. Basketball
- 7.1.5. Car Racing
- 7.1.6. Other Types
- 7.2. Market Analysis, Insights and Forecast - by Platform
- 7.2.1. Website
- 7.2.2. Mobile Application
- 7.3. Market Analysis, Insights and Forecast - by Demographics
- 7.3.1. Under 25 Years
- 7.3.2. Between 25 and 40 Years
- 7.3.3. Above 40 Years
- 7.4. Market Analysis, Insights and Forecast - by Application
- 7.4.1. Individual Competition
- 7.4.2. Team Competition
- 7.1. Market Analysis, Insights and Forecast - by Type
- 8. Europe Fantasy Sports Market Analysis, Insights and Forecast, 2020-2032
- 8.1. Market Analysis, Insights and Forecast - by Type
- 8.1.1. Football
- 8.1.2. Baseball
- 8.1.3. Cricket
- 8.1.4. Basketball
- 8.1.5. Car Racing
- 8.1.6. Other Types
- 8.2. Market Analysis, Insights and Forecast - by Platform
- 8.2.1. Website
- 8.2.2. Mobile Application
- 8.3. Market Analysis, Insights and Forecast - by Demographics
- 8.3.1. Under 25 Years
- 8.3.2. Between 25 and 40 Years
- 8.3.3. Above 40 Years
- 8.4. Market Analysis, Insights and Forecast - by Application
- 8.4.1. Individual Competition
- 8.4.2. Team Competition
- 8.1. Market Analysis, Insights and Forecast - by Type
- 9. Asia Fantasy Sports Market Analysis, Insights and Forecast, 2020-2032
- 9.1. Market Analysis, Insights and Forecast - by Type
- 9.1.1. Football
- 9.1.2. Baseball
- 9.1.3. Cricket
- 9.1.4. Basketball
- 9.1.5. Car Racing
- 9.1.6. Other Types
- 9.2. Market Analysis, Insights and Forecast - by Platform
- 9.2.1. Website
- 9.2.2. Mobile Application
- 9.3. Market Analysis, Insights and Forecast - by Demographics
- 9.3.1. Under 25 Years
- 9.3.2. Between 25 and 40 Years
- 9.3.3. Above 40 Years
- 9.4. Market Analysis, Insights and Forecast - by Application
- 9.4.1. Individual Competition
- 9.4.2. Team Competition
- 9.1. Market Analysis, Insights and Forecast - by Type
- 10. Australia and New Zealand Fantasy Sports Market Analysis, Insights and Forecast, 2020-2032
- 10.1. Market Analysis, Insights and Forecast - by Type
- 10.1.1. Football
- 10.1.2. Baseball
- 10.1.3. Cricket
- 10.1.4. Basketball
- 10.1.5. Car Racing
- 10.1.6. Other Types
- 10.2. Market Analysis, Insights and Forecast - by Platform
- 10.2.1. Website
- 10.2.2. Mobile Application
- 10.3. Market Analysis, Insights and Forecast - by Demographics
- 10.3.1. Under 25 Years
- 10.3.2. Between 25 and 40 Years
- 10.3.3. Above 40 Years
- 10.4. Market Analysis, Insights and Forecast - by Application
- 10.4.1. Individual Competition
- 10.4.2. Team Competition
- 10.1. Market Analysis, Insights and Forecast - by Type
- 11. Latin America Fantasy Sports Market Analysis, Insights and Forecast, 2020-2032
- 11.1. Market Analysis, Insights and Forecast - by Type
- 11.1.1. Football
- 11.1.2. Baseball
- 11.1.3. Cricket
- 11.1.4. Basketball
- 11.1.5. Car Racing
- 11.1.6. Other Types
- 11.2. Market Analysis, Insights and Forecast - by Platform
- 11.2.1. Website
- 11.2.2. Mobile Application
- 11.3. Market Analysis, Insights and Forecast - by Demographics
- 11.3.1. Under 25 Years
- 11.3.2. Between 25 and 40 Years
- 11.3.3. Above 40 Years
- 11.4. Market Analysis, Insights and Forecast - by Application
- 11.4.1. Individual Competition
- 11.4.2. Team Competition
- 11.1. Market Analysis, Insights and Forecast - by Type
- 12. Middle East and Africa Fantasy Sports Market Analysis, Insights and Forecast, 2020-2032
- 12.1. Market Analysis, Insights and Forecast - by Type
- 12.1.1. Football
- 12.1.2. Baseball
- 12.1.3. Cricket
- 12.1.4. Basketball
- 12.1.5. Car Racing
- 12.1.6. Other Types
- 12.2. Market Analysis, Insights and Forecast - by Platform
- 12.2.1. Website
- 12.2.2. Mobile Application
- 12.3. Market Analysis, Insights and Forecast - by Demographics
- 12.3.1. Under 25 Years
- 12.3.2. Between 25 and 40 Years
- 12.3.3. Above 40 Years
- 12.4. Market Analysis, Insights and Forecast - by Application
- 12.4.1. Individual Competition
- 12.4.2. Team Competition
- 12.1. Market Analysis, Insights and Forecast - by Type
- 13. Competitive Analysis
- 13.1. Company Profiles
- 13.1.1 Sleeper (Blitz Studios Inc )
- 13.1.1.1. Company Overview
- 13.1.1.2. Products
- 13.1.1.3. Company Financials
- 13.1.1.4. SWOT Analysis
- 13.1.2 Sorare SAS
- 13.1.2.1. Company Overview
- 13.1.2.2. Products
- 13.1.2.3. Company Financials
- 13.1.2.4. SWOT Analysis
- 13.1.3 Flutter Entertainment PLC
- 13.1.3.1. Company Overview
- 13.1.3.2. Products
- 13.1.3.3. Company Financials
- 13.1.3.4. SWOT Analysis
- 13.1.4 Vauntek Inc (Fantrax)
- 13.1.4.1. Company Overview
- 13.1.4.2. Products
- 13.1.4.3. Company Financials
- 13.1.4.4. SWOT Analysis
- 13.1.5 Low6 Limited
- 13.1.5.1. Company Overview
- 13.1.5.2. Products
- 13.1.5.3. Company Financials
- 13.1.5.4. SWOT Analysis
- 13.1.6 FanDuel Group
- 13.1.6.1. Company Overview
- 13.1.6.2. Products
- 13.1.6.3. Company Financials
- 13.1.6.4. SWOT Analysis
- 13.1.7 NFL Enterprises LLC
- 13.1.7.1. Company Overview
- 13.1.7.2. Products
- 13.1.7.3. Company Financials
- 13.1.7.4. SWOT Analysis
- 13.1.8 ESPN Sports Media Ltd
- 13.1.8.1. Company Overview
- 13.1.8.2. Products
- 13.1.8.3. Company Financials
- 13.1.8.4. SWOT Analysis
- 13.1.9 RealTime Fantasy Sports Inc
- 13.1.9.1. Company Overview
- 13.1.9.2. Products
- 13.1.9.3. Company Financials
- 13.1.9.4. SWOT Analysis
- 13.1.10 CBS Sports Digital
- 13.1.10.1. Company Overview
- 13.1.10.2. Products
- 13.1.10.3. Company Financials
- 13.1.10.4. SWOT Analysis
- 13.1.11 Bovada
- 13.1.11.1. Company Overview
- 13.1.11.2. Products
- 13.1.11.3. Company Financials
- 13.1.11.4. SWOT Analysis
- 13.1.12 DraftKings Inc
- 13.1.12.1. Company Overview
- 13.1.12.2. Products
- 13.1.12.3. Company Financials
- 13.1.12.4. SWOT Analysis
- 13.1.13 Dream Sports Group
- 13.1.13.1. Company Overview
- 13.1.13.2. Products
- 13.1.13.3. Company Financials
- 13.1.13.4. SWOT Analysis
- 13.1.14 Yahoo Fantasy Sports LLC
- 13.1.14.1. Company Overview
- 13.1.14.2. Products
- 13.1.14.3. Company Financials
- 13.1.14.4. SWOT Analysis
- 13.1.1 Sleeper (Blitz Studios Inc )
- 13.2. Market Entropy
- 13.2.1 Company's Key Areas Served
- 13.2.2 Recent Developments
- 13.3. Company Market Share Analysis 2025
- 13.3.1 Top 5 Companies Market Share Analysis
- 13.3.2 Top 3 Companies Market Share Analysis
- 13.4. List of Potential Customers
- 14. Research Methodology
List of Figures
- Figure 1: Global Fantasy Sports Market Revenue Breakdown (Million, %) by Region 2025 & 2033
- Figure 2: Global Fantasy Sports Market Volume Breakdown (K Unit, %) by Region 2025 & 2033
- Figure 3: North America Fantasy Sports Market Revenue (Million), by Type 2025 & 2033
- Figure 4: North America Fantasy Sports Market Volume (K Unit), by Type 2025 & 2033
- Figure 5: North America Fantasy Sports Market Revenue Share (%), by Type 2025 & 2033
- Figure 6: North America Fantasy Sports Market Volume Share (%), by Type 2025 & 2033
- Figure 7: North America Fantasy Sports Market Revenue (Million), by Platform 2025 & 2033
- Figure 8: North America Fantasy Sports Market Volume (K Unit), by Platform 2025 & 2033
- Figure 9: North America Fantasy Sports Market Revenue Share (%), by Platform 2025 & 2033
- Figure 10: North America Fantasy Sports Market Volume Share (%), by Platform 2025 & 2033
- Figure 11: North America Fantasy Sports Market Revenue (Million), by Demographics 2025 & 2033
- Figure 12: North America Fantasy Sports Market Volume (K Unit), by Demographics 2025 & 2033
- Figure 13: North America Fantasy Sports Market Revenue Share (%), by Demographics 2025 & 2033
- Figure 14: North America Fantasy Sports Market Volume Share (%), by Demographics 2025 & 2033
- Figure 15: North America Fantasy Sports Market Revenue (Million), by Application 2025 & 2033
- Figure 16: North America Fantasy Sports Market Volume (K Unit), by Application 2025 & 2033
- Figure 17: North America Fantasy Sports Market Revenue Share (%), by Application 2025 & 2033
- Figure 18: North America Fantasy Sports Market Volume Share (%), by Application 2025 & 2033
- Figure 19: North America Fantasy Sports Market Revenue (Million), by Country 2025 & 2033
- Figure 20: North America Fantasy Sports Market Volume (K Unit), by Country 2025 & 2033
- Figure 21: North America Fantasy Sports Market Revenue Share (%), by Country 2025 & 2033
- Figure 22: North America Fantasy Sports Market Volume Share (%), by Country 2025 & 2033
- Figure 23: Europe Fantasy Sports Market Revenue (Million), by Type 2025 & 2033
- Figure 24: Europe Fantasy Sports Market Volume (K Unit), by Type 2025 & 2033
- Figure 25: Europe Fantasy Sports Market Revenue Share (%), by Type 2025 & 2033
- Figure 26: Europe Fantasy Sports Market Volume Share (%), by Type 2025 & 2033
- Figure 27: Europe Fantasy Sports Market Revenue (Million), by Platform 2025 & 2033
- Figure 28: Europe Fantasy Sports Market Volume (K Unit), by Platform 2025 & 2033
- Figure 29: Europe Fantasy Sports Market Revenue Share (%), by Platform 2025 & 2033
- Figure 30: Europe Fantasy Sports Market Volume Share (%), by Platform 2025 & 2033
- Figure 31: Europe Fantasy Sports Market Revenue (Million), by Demographics 2025 & 2033
- Figure 32: Europe Fantasy Sports Market Volume (K Unit), by Demographics 2025 & 2033
- Figure 33: Europe Fantasy Sports Market Revenue Share (%), by Demographics 2025 & 2033
- Figure 34: Europe Fantasy Sports Market Volume Share (%), by Demographics 2025 & 2033
- Figure 35: Europe Fantasy Sports Market Revenue (Million), by Application 2025 & 2033
- Figure 36: Europe Fantasy Sports Market Volume (K Unit), by Application 2025 & 2033
- Figure 37: Europe Fantasy Sports Market Revenue Share (%), by Application 2025 & 2033
- Figure 38: Europe Fantasy Sports Market Volume Share (%), by Application 2025 & 2033
- Figure 39: Europe Fantasy Sports Market Revenue (Million), by Country 2025 & 2033
- Figure 40: Europe Fantasy Sports Market Volume (K Unit), by Country 2025 & 2033
- Figure 41: Europe Fantasy Sports Market Revenue Share (%), by Country 2025 & 2033
- Figure 42: Europe Fantasy Sports Market Volume Share (%), by Country 2025 & 2033
- Figure 43: Asia Fantasy Sports Market Revenue (Million), by Type 2025 & 2033
- Figure 44: Asia Fantasy Sports Market Volume (K Unit), by Type 2025 & 2033
- Figure 45: Asia Fantasy Sports Market Revenue Share (%), by Type 2025 & 2033
- Figure 46: Asia Fantasy Sports Market Volume Share (%), by Type 2025 & 2033
- Figure 47: Asia Fantasy Sports Market Revenue (Million), by Platform 2025 & 2033
- Figure 48: Asia Fantasy Sports Market Volume (K Unit), by Platform 2025 & 2033
- Figure 49: Asia Fantasy Sports Market Revenue Share (%), by Platform 2025 & 2033
- Figure 50: Asia Fantasy Sports Market Volume Share (%), by Platform 2025 & 2033
- Figure 51: Asia Fantasy Sports Market Revenue (Million), by Demographics 2025 & 2033
- Figure 52: Asia Fantasy Sports Market Volume (K Unit), by Demographics 2025 & 2033
- Figure 53: Asia Fantasy Sports Market Revenue Share (%), by Demographics 2025 & 2033
- Figure 54: Asia Fantasy Sports Market Volume Share (%), by Demographics 2025 & 2033
- Figure 55: Asia Fantasy Sports Market Revenue (Million), by Application 2025 & 2033
- Figure 56: Asia Fantasy Sports Market Volume (K Unit), by Application 2025 & 2033
- Figure 57: Asia Fantasy Sports Market Revenue Share (%), by Application 2025 & 2033
- Figure 58: Asia Fantasy Sports Market Volume Share (%), by Application 2025 & 2033
- Figure 59: Asia Fantasy Sports Market Revenue (Million), by Country 2025 & 2033
- Figure 60: Asia Fantasy Sports Market Volume (K Unit), by Country 2025 & 2033
- Figure 61: Asia Fantasy Sports Market Revenue Share (%), by Country 2025 & 2033
- Figure 62: Asia Fantasy Sports Market Volume Share (%), by Country 2025 & 2033
- Figure 63: Australia and New Zealand Fantasy Sports Market Revenue (Million), by Type 2025 & 2033
- Figure 64: Australia and New Zealand Fantasy Sports Market Volume (K Unit), by Type 2025 & 2033
- Figure 65: Australia and New Zealand Fantasy Sports Market Revenue Share (%), by Type 2025 & 2033
- Figure 66: Australia and New Zealand Fantasy Sports Market Volume Share (%), by Type 2025 & 2033
- Figure 67: Australia and New Zealand Fantasy Sports Market Revenue (Million), by Platform 2025 & 2033
- Figure 68: Australia and New Zealand Fantasy Sports Market Volume (K Unit), by Platform 2025 & 2033
- Figure 69: Australia and New Zealand Fantasy Sports Market Revenue Share (%), by Platform 2025 & 2033
- Figure 70: Australia and New Zealand Fantasy Sports Market Volume Share (%), by Platform 2025 & 2033
- Figure 71: Australia and New Zealand Fantasy Sports Market Revenue (Million), by Demographics 2025 & 2033
- Figure 72: Australia and New Zealand Fantasy Sports Market Volume (K Unit), by Demographics 2025 & 2033
- Figure 73: Australia and New Zealand Fantasy Sports Market Revenue Share (%), by Demographics 2025 & 2033
- Figure 74: Australia and New Zealand Fantasy Sports Market Volume Share (%), by Demographics 2025 & 2033
- Figure 75: Australia and New Zealand Fantasy Sports Market Revenue (Million), by Application 2025 & 2033
- Figure 76: Australia and New Zealand Fantasy Sports Market Volume (K Unit), by Application 2025 & 2033
- Figure 77: Australia and New Zealand Fantasy Sports Market Revenue Share (%), by Application 2025 & 2033
- Figure 78: Australia and New Zealand Fantasy Sports Market Volume Share (%), by Application 2025 & 2033
- Figure 79: Australia and New Zealand Fantasy Sports Market Revenue (Million), by Country 2025 & 2033
- Figure 80: Australia and New Zealand Fantasy Sports Market Volume (K Unit), by Country 2025 & 2033
- Figure 81: Australia and New Zealand Fantasy Sports Market Revenue Share (%), by Country 2025 & 2033
- Figure 82: Australia and New Zealand Fantasy Sports Market Volume Share (%), by Country 2025 & 2033
- Figure 83: Latin America Fantasy Sports Market Revenue (Million), by Type 2025 & 2033
- Figure 84: Latin America Fantasy Sports Market Volume (K Unit), by Type 2025 & 2033
- Figure 85: Latin America Fantasy Sports Market Revenue Share (%), by Type 2025 & 2033
- Figure 86: Latin America Fantasy Sports Market Volume Share (%), by Type 2025 & 2033
- Figure 87: Latin America Fantasy Sports Market Revenue (Million), by Platform 2025 & 2033
- Figure 88: Latin America Fantasy Sports Market Volume (K Unit), by Platform 2025 & 2033
- Figure 89: Latin America Fantasy Sports Market Revenue Share (%), by Platform 2025 & 2033
- Figure 90: Latin America Fantasy Sports Market Volume Share (%), by Platform 2025 & 2033
- Figure 91: Latin America Fantasy Sports Market Revenue (Million), by Demographics 2025 & 2033
- Figure 92: Latin America Fantasy Sports Market Volume (K Unit), by Demographics 2025 & 2033
- Figure 93: Latin America Fantasy Sports Market Revenue Share (%), by Demographics 2025 & 2033
- Figure 94: Latin America Fantasy Sports Market Volume Share (%), by Demographics 2025 & 2033
- Figure 95: Latin America Fantasy Sports Market Revenue (Million), by Application 2025 & 2033
- Figure 96: Latin America Fantasy Sports Market Volume (K Unit), by Application 2025 & 2033
- Figure 97: Latin America Fantasy Sports Market Revenue Share (%), by Application 2025 & 2033
- Figure 98: Latin America Fantasy Sports Market Volume Share (%), by Application 2025 & 2033
- Figure 99: Latin America Fantasy Sports Market Revenue (Million), by Country 2025 & 2033
- Figure 100: Latin America Fantasy Sports Market Volume (K Unit), by Country 2025 & 2033
- Figure 101: Latin America Fantasy Sports Market Revenue Share (%), by Country 2025 & 2033
- Figure 102: Latin America Fantasy Sports Market Volume Share (%), by Country 2025 & 2033
- Figure 103: Middle East and Africa Fantasy Sports Market Revenue (Million), by Type 2025 & 2033
- Figure 104: Middle East and Africa Fantasy Sports Market Volume (K Unit), by Type 2025 & 2033
- Figure 105: Middle East and Africa Fantasy Sports Market Revenue Share (%), by Type 2025 & 2033
- Figure 106: Middle East and Africa Fantasy Sports Market Volume Share (%), by Type 2025 & 2033
- Figure 107: Middle East and Africa Fantasy Sports Market Revenue (Million), by Platform 2025 & 2033
- Figure 108: Middle East and Africa Fantasy Sports Market Volume (K Unit), by Platform 2025 & 2033
- Figure 109: Middle East and Africa Fantasy Sports Market Revenue Share (%), by Platform 2025 & 2033
- Figure 110: Middle East and Africa Fantasy Sports Market Volume Share (%), by Platform 2025 & 2033
- Figure 111: Middle East and Africa Fantasy Sports Market Revenue (Million), by Demographics 2025 & 2033
- Figure 112: Middle East and Africa Fantasy Sports Market Volume (K Unit), by Demographics 2025 & 2033
- Figure 113: Middle East and Africa Fantasy Sports Market Revenue Share (%), by Demographics 2025 & 2033
- Figure 114: Middle East and Africa Fantasy Sports Market Volume Share (%), by Demographics 2025 & 2033
- Figure 115: Middle East and Africa Fantasy Sports Market Revenue (Million), by Application 2025 & 2033
- Figure 116: Middle East and Africa Fantasy Sports Market Volume (K Unit), by Application 2025 & 2033
- Figure 117: Middle East and Africa Fantasy Sports Market Revenue Share (%), by Application 2025 & 2033
- Figure 118: Middle East and Africa Fantasy Sports Market Volume Share (%), by Application 2025 & 2033
- Figure 119: Middle East and Africa Fantasy Sports Market Revenue (Million), by Country 2025 & 2033
- Figure 120: Middle East and Africa Fantasy Sports Market Volume (K Unit), by Country 2025 & 2033
- Figure 121: Middle East and Africa Fantasy Sports Market Revenue Share (%), by Country 2025 & 2033
- Figure 122: Middle East and Africa Fantasy Sports Market Volume Share (%), by Country 2025 & 2033
List of Tables
- Table 1: Global Fantasy Sports Market Revenue Million Forecast, by Type 2020 & 2033
- Table 2: Global Fantasy Sports Market Volume K Unit Forecast, by Type 2020 & 2033
- Table 3: Global Fantasy Sports Market Revenue Million Forecast, by Platform 2020 & 2033
- Table 4: Global Fantasy Sports Market Volume K Unit Forecast, by Platform 2020 & 2033
- Table 5: Global Fantasy Sports Market Revenue Million Forecast, by Demographics 2020 & 2033
- Table 6: Global Fantasy Sports Market Volume K Unit Forecast, by Demographics 2020 & 2033
- Table 7: Global Fantasy Sports Market Revenue Million Forecast, by Application 2020 & 2033
- Table 8: Global Fantasy Sports Market Volume K Unit Forecast, by Application 2020 & 2033
- Table 9: Global Fantasy Sports Market Revenue Million Forecast, by Region 2020 & 2033
- Table 10: Global Fantasy Sports Market Volume K Unit Forecast, by Region 2020 & 2033
- Table 11: Global Fantasy Sports Market Revenue Million Forecast, by Type 2020 & 2033
- Table 12: Global Fantasy Sports Market Volume K Unit Forecast, by Type 2020 & 2033
- Table 13: Global Fantasy Sports Market Revenue Million Forecast, by Platform 2020 & 2033
- Table 14: Global Fantasy Sports Market Volume K Unit Forecast, by Platform 2020 & 2033
- Table 15: Global Fantasy Sports Market Revenue Million Forecast, by Demographics 2020 & 2033
- Table 16: Global Fantasy Sports Market Volume K Unit Forecast, by Demographics 2020 & 2033
- Table 17: Global Fantasy Sports Market Revenue Million Forecast, by Application 2020 & 2033
- Table 18: Global Fantasy Sports Market Volume K Unit Forecast, by Application 2020 & 2033
- Table 19: Global Fantasy Sports Market Revenue Million Forecast, by Country 2020 & 2033
- Table 20: Global Fantasy Sports Market Volume K Unit Forecast, by Country 2020 & 2033
- Table 21: Global Fantasy Sports Market Revenue Million Forecast, by Type 2020 & 2033
- Table 22: Global Fantasy Sports Market Volume K Unit Forecast, by Type 2020 & 2033
- Table 23: Global Fantasy Sports Market Revenue Million Forecast, by Platform 2020 & 2033
- Table 24: Global Fantasy Sports Market Volume K Unit Forecast, by Platform 2020 & 2033
- Table 25: Global Fantasy Sports Market Revenue Million Forecast, by Demographics 2020 & 2033
- Table 26: Global Fantasy Sports Market Volume K Unit Forecast, by Demographics 2020 & 2033
- Table 27: Global Fantasy Sports Market Revenue Million Forecast, by Application 2020 & 2033
- Table 28: Global Fantasy Sports Market Volume K Unit Forecast, by Application 2020 & 2033
- Table 29: Global Fantasy Sports Market Revenue Million Forecast, by Country 2020 & 2033
- Table 30: Global Fantasy Sports Market Volume K Unit Forecast, by Country 2020 & 2033
- Table 31: Global Fantasy Sports Market Revenue Million Forecast, by Type 2020 & 2033
- Table 32: Global Fantasy Sports Market Volume K Unit Forecast, by Type 2020 & 2033
- Table 33: Global Fantasy Sports Market Revenue Million Forecast, by Platform 2020 & 2033
- Table 34: Global Fantasy Sports Market Volume K Unit Forecast, by Platform 2020 & 2033
- Table 35: Global Fantasy Sports Market Revenue Million Forecast, by Demographics 2020 & 2033
- Table 36: Global Fantasy Sports Market Volume K Unit Forecast, by Demographics 2020 & 2033
- Table 37: Global Fantasy Sports Market Revenue Million Forecast, by Application 2020 & 2033
- Table 38: Global Fantasy Sports Market Volume K Unit Forecast, by Application 2020 & 2033
- Table 39: Global Fantasy Sports Market Revenue Million Forecast, by Country 2020 & 2033
- Table 40: Global Fantasy Sports Market Volume K Unit Forecast, by Country 2020 & 2033
- Table 41: Global Fantasy Sports Market Revenue Million Forecast, by Type 2020 & 2033
- Table 42: Global Fantasy Sports Market Volume K Unit Forecast, by Type 2020 & 2033
- Table 43: Global Fantasy Sports Market Revenue Million Forecast, by Platform 2020 & 2033
- Table 44: Global Fantasy Sports Market Volume K Unit Forecast, by Platform 2020 & 2033
- Table 45: Global Fantasy Sports Market Revenue Million Forecast, by Demographics 2020 & 2033
- Table 46: Global Fantasy Sports Market Volume K Unit Forecast, by Demographics 2020 & 2033
- Table 47: Global Fantasy Sports Market Revenue Million Forecast, by Application 2020 & 2033
- Table 48: Global Fantasy Sports Market Volume K Unit Forecast, by Application 2020 & 2033
- Table 49: Global Fantasy Sports Market Revenue Million Forecast, by Country 2020 & 2033
- Table 50: Global Fantasy Sports Market Volume K Unit Forecast, by Country 2020 & 2033
- Table 51: Global Fantasy Sports Market Revenue Million Forecast, by Type 2020 & 2033
- Table 52: Global Fantasy Sports Market Volume K Unit Forecast, by Type 2020 & 2033
- Table 53: Global Fantasy Sports Market Revenue Million Forecast, by Platform 2020 & 2033
- Table 54: Global Fantasy Sports Market Volume K Unit Forecast, by Platform 2020 & 2033
- Table 55: Global Fantasy Sports Market Revenue Million Forecast, by Demographics 2020 & 2033
- Table 56: Global Fantasy Sports Market Volume K Unit Forecast, by Demographics 2020 & 2033
- Table 57: Global Fantasy Sports Market Revenue Million Forecast, by Application 2020 & 2033
- Table 58: Global Fantasy Sports Market Volume K Unit Forecast, by Application 2020 & 2033
- Table 59: Global Fantasy Sports Market Revenue Million Forecast, by Country 2020 & 2033
- Table 60: Global Fantasy Sports Market Volume K Unit Forecast, by Country 2020 & 2033
- Table 61: Global Fantasy Sports Market Revenue Million Forecast, by Type 2020 & 2033
- Table 62: Global Fantasy Sports Market Volume K Unit Forecast, by Type 2020 & 2033
- Table 63: Global Fantasy Sports Market Revenue Million Forecast, by Platform 2020 & 2033
- Table 64: Global Fantasy Sports Market Volume K Unit Forecast, by Platform 2020 & 2033
- Table 65: Global Fantasy Sports Market Revenue Million Forecast, by Demographics 2020 & 2033
- Table 66: Global Fantasy Sports Market Volume K Unit Forecast, by Demographics 2020 & 2033
- Table 67: Global Fantasy Sports Market Revenue Million Forecast, by Application 2020 & 2033
- Table 68: Global Fantasy Sports Market Volume K Unit Forecast, by Application 2020 & 2033
- Table 69: Global Fantasy Sports Market Revenue Million Forecast, by Country 2020 & 2033
- Table 70: Global Fantasy Sports Market Volume K Unit Forecast, by Country 2020 & 2033
Frequently Asked Questions
1. What is the projected Compound Annual Growth Rate (CAGR) of the Fantasy Sports Market?
The projected CAGR is approximately 13.83%.
2. Which companies are prominent players in the Fantasy Sports Market?
Key companies in the market include Sleeper (Blitz Studios Inc ), Sorare SAS, Flutter Entertainment PLC, Vauntek Inc (Fantrax), Low6 Limited, FanDuel Group, NFL Enterprises LLC, ESPN Sports Media Ltd, RealTime Fantasy Sports Inc, CBS Sports Digital, Bovada, DraftKings Inc, Dream Sports Group, Yahoo Fantasy Sports LLC.
3. What are the main segments of the Fantasy Sports Market?
The market segments include Type, Platform, Demographics, Application.
4. Can you provide details about the market size?
The market size is estimated to be USD 32.75 Million as of 2022.
5. What are some drivers contributing to market growth?
Increasing Sports Fan Engagement; Technological Advancements might Drive the Market Growth.
6. What are the notable trends driving market growth?
Increasing Sports Fan Engagement may Drive the Market Growth.
7. Are there any restraints impacting market growth?
Low Awareness and Regulatory Framework; Competition from Traditional Sports Betting.
8. Can you provide examples of recent developments in the market?
March 2023: DraftKings Inc. announced plans to open its renowned online sportsbook, subject to licensing and regulatory approval in Massachusetts. Massachusetts will be the 21st state in the union to provide an online sportsbook by Boston-based DraftKings. In addition to giving Massachusetts residents access to several bet types, such as same-game parlays, player props, unique odds, boost choices, and more, DraftKings will also offer clients in the state attractive and exclusive bonuses.
9. What pricing options are available for accessing the report?
Pricing options include single-user, multi-user, and enterprise licenses priced at USD 4750, USD 5250, and USD 8750 respectively.
10. Is the market size provided in terms of value or volume?
The market size is provided in terms of value, measured in Million and volume, measured in K Unit.
11. Are there any specific market keywords associated with the report?
Yes, the market keyword associated with the report is "Fantasy Sports Market," which aids in identifying and referencing the specific market segment covered.
12. How do I determine which pricing option suits my needs best?
The pricing options vary based on user requirements and access needs. Individual users may opt for single-user licenses, while businesses requiring broader access may choose multi-user or enterprise licenses for cost-effective access to the report.
13. Are there any additional resources or data provided in the Fantasy Sports Market report?
While the report offers comprehensive insights, it's advisable to review the specific contents or supplementary materials provided to ascertain if additional resources or data are available.
14. How can I stay updated on further developments or reports in the Fantasy Sports Market?
To stay informed about further developments, trends, and reports in the Fantasy Sports Market, consider subscribing to industry newsletters, following relevant companies and organizations, or regularly checking reputable industry news sources and publications.
Methodology
Step 1 - Identification of Relevant Samples Size from Population Database


Step 2 - Approaches for Defining Global Market Size (Value, Volume* & Price*)

Note*: In applicable scenarios
Step 3 - Data Sources
Primary Research
- Web Analytics
- Survey Reports
- Research Institute
- Latest Research Reports
- Opinion Leaders
Secondary Research
- Annual Reports
- White Paper
- Latest Press Release
- Industry Association
- Paid Database
- Investor Presentations

Step 4 - Data Triangulation
Involves using different sources of information in order to increase the validity of a study
These sources are likely to be stakeholders in a program - participants, other researchers, program staff, other community members, and so on.
Then we put all data in single framework & apply various statistical tools to find out the dynamic on the market.
During the analysis stage, feedback from the stakeholder groups would be compared to determine areas of agreement as well as areas of divergence