

Key Insights
The Flue Gas Desulfurization (FGD) Systems market is projected for substantial expansion, driven by tightening environmental regulations focused on mitigating sulfur dioxide (SO2) emissions from industrial and power generation facilities. With a current market size of 9.55 billion in the base year of 2025, and an estimated CAGR of 13.06%, the market is poised for significant growth through 2033. This upward trajectory is underpinned by the accelerating adoption of cleaner energy solutions and the rising global demand for electricity, particularly in developing economies. Wet FGD systems currently hold the largest market share, benefiting from their proven efficacy and mature technology. However, dry FGD systems are increasingly gaining favor due to their reduced water requirements and operational expenses, signaling a key growth area. While power generation remains the dominant end-user sector, expanding industrial activities in segments such as cement, chemicals, and iron & steel are diversifying the market's application scope. Geographically, robust growth is anticipated across all regions, with Asia-Pacific, led by China and India, expected to be a major contributor due to rapid industrialization and infrastructure development. Nevertheless, the substantial upfront investment and ongoing maintenance costs for FGD system implementation pose a significant challenge to market penetration, especially for smaller enterprises in emerging markets.
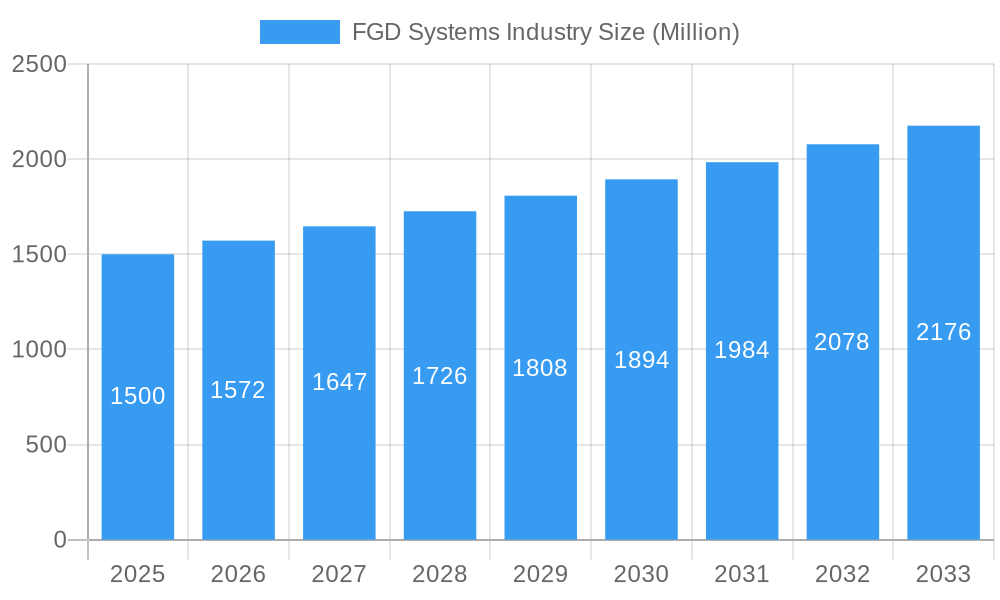
FGD Systems Industry Market Size (In Billion)
The competitive environment is marked by the presence of major multinational corporations and established regional manufacturers. Leading entities such as Ducon Technologies Inc, Hamon Corporation, and Mitsubishi Hitachi Power Systems Ltd are actively investing in research and development to boost the efficiency and cost-effectiveness of their FGD solutions. A notable trend involves the integration of advanced technologies like Artificial Intelligence (AI) and the Internet of Things (IoT) to optimize processes and minimize operational disruptions. This drive for innovation, coupled with a global imperative for sustainable practices, is expected to propel the FGD systems market forward, notwithstanding the financial barriers to initial deployment. Future competitive dynamics are likely to involve strategic alliances, mergers, and acquisitions aimed at enhancing technological prowess and expanding global market access.
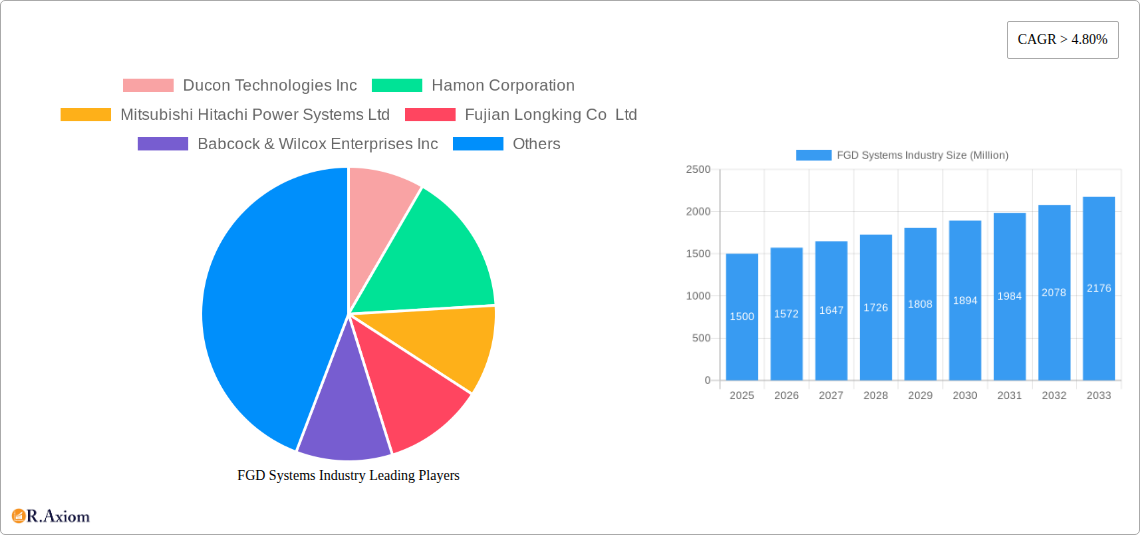
FGD Systems Industry Company Market Share
FGD Systems Industry Market Research Report: 2019-2033
This comprehensive report provides a detailed analysis of the global FGD Systems market, offering valuable insights for stakeholders across the value chain. The report covers the period from 2019 to 2033, with a focus on the forecast period of 2025-2033 and a base year of 2025. The market is valued at $XX Million in 2025 and is projected to reach $XX Million by 2033, exhibiting a CAGR of XX% during the forecast period. Key players analyzed include Ducon Technologies Inc, Hamon Corporation, Mitsubishi Hitachi Power Systems Ltd, Fujian Longking Co Ltd, Babcock & Wilcox Enterprises Inc, Thermax Ltd, John Wood Group PLC, Alstom S A, General Electric Company, and Andritz AG. This is not an exhaustive list.
FGD Systems Industry Market Concentration & Innovation
The FGD Systems market exhibits a moderately concentrated structure, with a few major players holding significant market share. In 2025, the top five companies collectively account for approximately XX% of the global market. However, the market is witnessing increased competition from smaller, specialized players, particularly in niche segments like dry FGD systems for the cement industry. Innovation is a key driver, with companies focusing on improving efficiency, reducing operating costs, and enhancing environmental performance. Stricter environmental regulations globally are pushing innovation towards advanced FGD technologies. M&A activity has been moderate in recent years, with deal values totaling approximately $XX Million in the past five years. Several strategic alliances and joint ventures are also observed, highlighting the importance of technology collaborations and market expansion.
- Market Share (2025): Top 5 players – XX%; Top 10 players – XX%
- M&A Deal Value (2020-2024): $XX Million
- Key Innovation Drivers: Stringent emission regulations, increasing demand for cleaner energy, technological advancements in FGD technology.
- Regulatory Frameworks: Vary significantly across regions, influencing technological choices and investment decisions.
FGD Systems Industry Industry Trends & Insights
The FGD Systems market is experiencing robust growth driven by increasing environmental concerns, stricter emission regulations, and rising power generation capacity globally. The power generation segment accounts for the largest market share, followed by the cement and chemical industries. Technological disruptions are evident, with the adoption of advanced technologies like dry FGD systems gaining traction due to their lower water consumption and reduced operational costs. Consumer preferences are shifting towards environmentally friendly and cost-effective solutions, which are driving demand for innovative FGD systems with improved efficiency and reduced lifecycle costs. Competitive dynamics are shaping the market, with companies focusing on product differentiation, strategic partnerships, and geographic expansion. The market's growth is further fueled by government incentives promoting cleaner energy sources and investments in renewable energy infrastructure. The global market is experiencing a CAGR of approximately XX% from 2025 to 2033, with a market penetration rate of XX% by 2033 in key regions.
Dominant Markets & Segments in FGD Systems Industry
The Asia-Pacific region dominates the FGD Systems market, driven by rapid industrialization, substantial power generation capacity expansion, and stringent environmental regulations in countries like China and India. Within this region, China holds the largest market share, owing to its substantial investments in coal-fired power plants and ambitious emission reduction targets.
- Dominant Region: Asia-Pacific
- Dominant Country: China
- Dominant Segment (Type): Wet FGD (due to established technology and suitability for large-scale applications)
- Dominant Segment (End-User Industry): Power Generation (owing to the largest installed base of coal-fired power plants)
Key drivers for regional dominance include supportive government policies, robust infrastructure development, and increasing investment in renewable energy projects. The strong economic growth in the Asia-Pacific region is further bolstering demand for FGD systems to meet emission standards.
FGD Systems Industry Product Developments
Recent product innovations in FGD systems focus on enhancing efficiency, reducing costs, and minimizing environmental impact. Dry FGD technologies are gaining prominence due to their lower water consumption and reduced sludge disposal issues. Companies are also developing advanced control systems to optimize FGD performance and reduce operational complexity. These developments are tailored to address specific end-user needs and market demands, resulting in improved market fit and competitive advantages. The trend towards integrating FGD systems with other air pollution control technologies is also gaining momentum.
Report Scope & Segmentation Analysis
This report segments the FGD Systems market by type (Dry FGD and Wet FGD) and end-user industry (Power Generation, Cement, Chemical, Iron and Steel, and Other End-User Industries). Each segment's growth projections, market sizes, and competitive dynamics are analyzed in detail.
- Dry FGD: This segment is experiencing faster growth, driven by its advantages in terms of lower water consumption and reduced sludge disposal.
- Wet FGD: This segment holds the larger market share currently, given its established technology and suitability for various applications.
- Power Generation: This segment remains the dominant end-user, owing to the substantial number of coal-fired power plants.
- Cement, Chemical, Iron & Steel, and Other End-User Industries: These segments contribute significantly to the overall market, with considerable growth potential driven by stricter emission regulations.
Key Drivers of FGD Systems Industry Growth
Several factors are driving the growth of the FGD systems industry. Stringent environmental regulations worldwide are mandating the installation of FGD systems in power plants and industrial facilities. Furthermore, increasing power generation capacity, particularly in developing economies, is fuelling demand for FGD systems. Technological advancements, such as dry FGD systems, are increasing efficiency and reducing operational costs, further driving market expansion. Finally, government incentives and subsidies promoting cleaner energy sources are boosting market growth.
Challenges in the FGD Systems Industry Sector
The FGD systems industry faces several challenges. High capital and operational costs can be a significant barrier to adoption, particularly for smaller companies. Supply chain disruptions and the availability of raw materials can impact production and delivery. Intense competition among major players and the emergence of new technologies necessitate continuous innovation and adaptation to maintain market share. Furthermore, fluctuating energy prices can influence the overall profitability of FGD system installations. These factors collectively contribute to market volatility and impact profitability.
Emerging Opportunities in FGD Systems Industry
Emerging opportunities exist in the FGD systems industry. The growing focus on renewable energy sources presents opportunities for integrating FGD systems with advanced energy solutions. Technological advancements in dry FGD systems are opening new markets and applications. The increasing demand for cost-effective and environmentally friendly solutions is driving innovation in FGD technology and creating lucrative opportunities. Emerging economies offer significant growth potential due to rapid industrialization and expanding power generation capacities.
Leading Players in the FGD Systems Industry Market
Key Developments in FGD Systems Industry Industry
- January 2023: Company X launches a new dry FGD system with improved efficiency.
- March 2022: Company Y announces a strategic partnership to expand its global reach.
- June 2021: Company Z acquires a smaller competitor, strengthening its market position.
- September 2020: New environmental regulations are implemented in Region A, stimulating demand for FGD systems.
Strategic Outlook for FGD Systems Industry Market
The FGD Systems market is poised for continued growth, driven by strengthening environmental regulations, rising energy demands, and technological advancements. The increasing adoption of dry FGD systems and the integration of FGD technologies with other air pollution control solutions are key growth catalysts. Emerging economies and the growing renewable energy sector present significant opportunities for market expansion. Companies focusing on innovation, strategic partnerships, and efficient operations are well-positioned to capitalize on the market's future potential.
FGD Systems Industry Segmentation
-
1. Type
- 1.1. Dry FGD
- 1.2. Wet FGD
-
2. End-User Industry
- 2.1. Power Generation
- 2.2. Cement
- 2.3. Chemical
- 2.4. Iron and Steel
- 2.5. Other End-User Industries
FGD Systems Industry Segmentation By Geography
- 1. North America
- 2. Europe
- 3. Asia Pacific
- 4. South America
- 5. Middle East and Africa
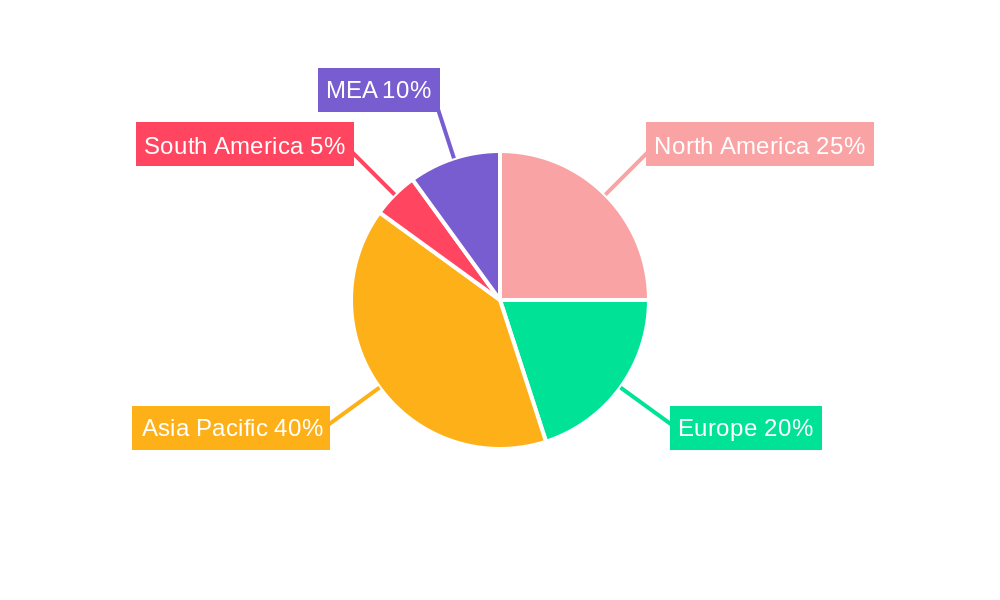
FGD Systems Industry Regional Market Share
Geographic Coverage of FGD Systems Industry
FGD Systems Industry REPORT HIGHLIGHTS
| Aspects | Details |
|---|---|
| Study Period | 2020-2034 |
| Base Year | 2025 |
| Estimated Year | 2026 |
| Forecast Period | 2026-2034 |
| Historical Period | 2020-2025 |
| Growth Rate | CAGR of 13.06% from 2020-2034 |
| Segmentation |
|
Table of Contents
- 1. Introduction
- 1.1. Research Scope
- 1.2. Market Segmentation
- 1.3. Research Objective
- 1.4. Definitions and Assumptions
- 2. Executive Summary
- 2.1. Market Snapshot
- 3. Market Dynamics
- 3.1. Market Drivers
- 3.2. Market Restrains
- 3.3. Market Trends
- 3.4. Market Opportunities
- 4. Market Factor Analysis
- 4.1. Porters Five Forces
- 4.1.1. Bargaining Power of Suppliers
- 4.1.2. Bargaining Power of Buyers
- 4.1.3. Threat of New Entrants
- 4.1.4. Threat of Substitutes
- 4.1.5. Competitive Rivalry
- 4.2. PESTEL analysis
- 4.3. BCG Analysis
- 4.3.1. Stars (High Growth, High Market Share)
- 4.3.2. Cash Cows (Low Growth, High Market Share)
- 4.3.3. Question Mark (High Growth, Low Market Share)
- 4.3.4. Dogs (Low Growth, Low Market Share)
- 4.4. Ansoff Matrix Analysis
- 4.5. Supply Chain Analysis
- 4.6. Regulatory Landscape
- 4.7. Current Market Potential and Opportunity Assessment (TAM–SAM–SOM Framework)
- 4.8. RAX Analyst Note
- 4.1. Porters Five Forces
- 5. Market Analysis, Insights and Forecast 2021-2033
- 5.1. Market Analysis, Insights and Forecast - by Type
- 5.1.1. Dry FGD
- 5.1.2. Wet FGD
- 5.2. Market Analysis, Insights and Forecast - by End-User Industry
- 5.2.1. Power Generation
- 5.2.2. Cement
- 5.2.3. Chemical
- 5.2.4. Iron and Steel
- 5.2.5. Other End-User Industries
- 5.3. Market Analysis, Insights and Forecast - by Region
- 5.3.1. North America
- 5.3.2. Europe
- 5.3.3. Asia Pacific
- 5.3.4. South America
- 5.3.5. Middle East and Africa
- 5.1. Market Analysis, Insights and Forecast - by Type
- 6. Global FGD Systems Industry Analysis, Insights and Forecast, 2021-2033
- 6.1. Market Analysis, Insights and Forecast - by Type
- 6.1.1. Dry FGD
- 6.1.2. Wet FGD
- 6.2. Market Analysis, Insights and Forecast - by End-User Industry
- 6.2.1. Power Generation
- 6.2.2. Cement
- 6.2.3. Chemical
- 6.2.4. Iron and Steel
- 6.2.5. Other End-User Industries
- 6.1. Market Analysis, Insights and Forecast - by Type
- 7. North America FGD Systems Industry Analysis, Insights and Forecast, 2020-2032
- 7.1. Market Analysis, Insights and Forecast - by Type
- 7.1.1. Dry FGD
- 7.1.2. Wet FGD
- 7.2. Market Analysis, Insights and Forecast - by End-User Industry
- 7.2.1. Power Generation
- 7.2.2. Cement
- 7.2.3. Chemical
- 7.2.4. Iron and Steel
- 7.2.5. Other End-User Industries
- 7.1. Market Analysis, Insights and Forecast - by Type
- 8. Europe FGD Systems Industry Analysis, Insights and Forecast, 2020-2032
- 8.1. Market Analysis, Insights and Forecast - by Type
- 8.1.1. Dry FGD
- 8.1.2. Wet FGD
- 8.2. Market Analysis, Insights and Forecast - by End-User Industry
- 8.2.1. Power Generation
- 8.2.2. Cement
- 8.2.3. Chemical
- 8.2.4. Iron and Steel
- 8.2.5. Other End-User Industries
- 8.1. Market Analysis, Insights and Forecast - by Type
- 9. Asia Pacific FGD Systems Industry Analysis, Insights and Forecast, 2020-2032
- 9.1. Market Analysis, Insights and Forecast - by Type
- 9.1.1. Dry FGD
- 9.1.2. Wet FGD
- 9.2. Market Analysis, Insights and Forecast - by End-User Industry
- 9.2.1. Power Generation
- 9.2.2. Cement
- 9.2.3. Chemical
- 9.2.4. Iron and Steel
- 9.2.5. Other End-User Industries
- 9.1. Market Analysis, Insights and Forecast - by Type
- 10. South America FGD Systems Industry Analysis, Insights and Forecast, 2020-2032
- 10.1. Market Analysis, Insights and Forecast - by Type
- 10.1.1. Dry FGD
- 10.1.2. Wet FGD
- 10.2. Market Analysis, Insights and Forecast - by End-User Industry
- 10.2.1. Power Generation
- 10.2.2. Cement
- 10.2.3. Chemical
- 10.2.4. Iron and Steel
- 10.2.5. Other End-User Industries
- 10.1. Market Analysis, Insights and Forecast - by Type
- 11. Middle East and Africa FGD Systems Industry Analysis, Insights and Forecast, 2020-2032
- 11.1. Market Analysis, Insights and Forecast - by Type
- 11.1.1. Dry FGD
- 11.1.2. Wet FGD
- 11.2. Market Analysis, Insights and Forecast - by End-User Industry
- 11.2.1. Power Generation
- 11.2.2. Cement
- 11.2.3. Chemical
- 11.2.4. Iron and Steel
- 11.2.5. Other End-User Industries
- 11.1. Market Analysis, Insights and Forecast - by Type
- 12. Competitive Analysis
- 12.1. Company Profiles
- 12.1.1 Ducon Technologies Inc
- 12.1.1.1. Company Overview
- 12.1.1.2. Products
- 12.1.1.3. Company Financials
- 12.1.1.4. SWOT Analysis
- 12.1.2 Hamon Corporation
- 12.1.2.1. Company Overview
- 12.1.2.2. Products
- 12.1.2.3. Company Financials
- 12.1.2.4. SWOT Analysis
- 12.1.3 Mitsubishi Hitachi Power Systems Ltd
- 12.1.3.1. Company Overview
- 12.1.3.2. Products
- 12.1.3.3. Company Financials
- 12.1.3.4. SWOT Analysis
- 12.1.4 Fujian Longking Co Ltd
- 12.1.4.1. Company Overview
- 12.1.4.2. Products
- 12.1.4.3. Company Financials
- 12.1.4.4. SWOT Analysis
- 12.1.5 Babcock & Wilcox Enterprises Inc
- 12.1.5.1. Company Overview
- 12.1.5.2. Products
- 12.1.5.3. Company Financials
- 12.1.5.4. SWOT Analysis
- 12.1.6 Thermax Ltd*List Not Exhaustive
- 12.1.6.1. Company Overview
- 12.1.6.2. Products
- 12.1.6.3. Company Financials
- 12.1.6.4. SWOT Analysis
- 12.1.7 John Wood Group PLC
- 12.1.7.1. Company Overview
- 12.1.7.2. Products
- 12.1.7.3. Company Financials
- 12.1.7.4. SWOT Analysis
- 12.1.8 Alstom S A
- 12.1.8.1. Company Overview
- 12.1.8.2. Products
- 12.1.8.3. Company Financials
- 12.1.8.4. SWOT Analysis
- 12.1.9 General Electric Company
- 12.1.9.1. Company Overview
- 12.1.9.2. Products
- 12.1.9.3. Company Financials
- 12.1.9.4. SWOT Analysis
- 12.1.10 Andritz AG
- 12.1.10.1. Company Overview
- 12.1.10.2. Products
- 12.1.10.3. Company Financials
- 12.1.10.4. SWOT Analysis
- 12.1.1 Ducon Technologies Inc
- 12.2. Market Entropy
- 12.2.1 Company's Key Areas Served
- 12.2.2 Recent Developments
- 12.3. Company Market Share Analysis 2025
- 12.3.1 Top 5 Companies Market Share Analysis
- 12.3.2 Top 3 Companies Market Share Analysis
- 12.4. List of Potential Customers
- 13. Research Methodology
List of Figures
- Figure 1: Global FGD Systems Industry Revenue Breakdown (billion, %) by Region 2025 & 2033
- Figure 2: North America FGD Systems Industry Revenue (billion), by Type 2025 & 2033
- Figure 3: North America FGD Systems Industry Revenue Share (%), by Type 2025 & 2033
- Figure 4: North America FGD Systems Industry Revenue (billion), by End-User Industry 2025 & 2033
- Figure 5: North America FGD Systems Industry Revenue Share (%), by End-User Industry 2025 & 2033
- Figure 6: North America FGD Systems Industry Revenue (billion), by Country 2025 & 2033
- Figure 7: North America FGD Systems Industry Revenue Share (%), by Country 2025 & 2033
- Figure 8: Europe FGD Systems Industry Revenue (billion), by Type 2025 & 2033
- Figure 9: Europe FGD Systems Industry Revenue Share (%), by Type 2025 & 2033
- Figure 10: Europe FGD Systems Industry Revenue (billion), by End-User Industry 2025 & 2033
- Figure 11: Europe FGD Systems Industry Revenue Share (%), by End-User Industry 2025 & 2033
- Figure 12: Europe FGD Systems Industry Revenue (billion), by Country 2025 & 2033
- Figure 13: Europe FGD Systems Industry Revenue Share (%), by Country 2025 & 2033
- Figure 14: Asia Pacific FGD Systems Industry Revenue (billion), by Type 2025 & 2033
- Figure 15: Asia Pacific FGD Systems Industry Revenue Share (%), by Type 2025 & 2033
- Figure 16: Asia Pacific FGD Systems Industry Revenue (billion), by End-User Industry 2025 & 2033
- Figure 17: Asia Pacific FGD Systems Industry Revenue Share (%), by End-User Industry 2025 & 2033
- Figure 18: Asia Pacific FGD Systems Industry Revenue (billion), by Country 2025 & 2033
- Figure 19: Asia Pacific FGD Systems Industry Revenue Share (%), by Country 2025 & 2033
- Figure 20: South America FGD Systems Industry Revenue (billion), by Type 2025 & 2033
- Figure 21: South America FGD Systems Industry Revenue Share (%), by Type 2025 & 2033
- Figure 22: South America FGD Systems Industry Revenue (billion), by End-User Industry 2025 & 2033
- Figure 23: South America FGD Systems Industry Revenue Share (%), by End-User Industry 2025 & 2033
- Figure 24: South America FGD Systems Industry Revenue (billion), by Country 2025 & 2033
- Figure 25: South America FGD Systems Industry Revenue Share (%), by Country 2025 & 2033
- Figure 26: Middle East and Africa FGD Systems Industry Revenue (billion), by Type 2025 & 2033
- Figure 27: Middle East and Africa FGD Systems Industry Revenue Share (%), by Type 2025 & 2033
- Figure 28: Middle East and Africa FGD Systems Industry Revenue (billion), by End-User Industry 2025 & 2033
- Figure 29: Middle East and Africa FGD Systems Industry Revenue Share (%), by End-User Industry 2025 & 2033
- Figure 30: Middle East and Africa FGD Systems Industry Revenue (billion), by Country 2025 & 2033
- Figure 31: Middle East and Africa FGD Systems Industry Revenue Share (%), by Country 2025 & 2033
List of Tables
- Table 1: Global FGD Systems Industry Revenue billion Forecast, by Type 2020 & 2033
- Table 2: Global FGD Systems Industry Revenue billion Forecast, by End-User Industry 2020 & 2033
- Table 3: Global FGD Systems Industry Revenue billion Forecast, by Region 2020 & 2033
- Table 4: Global FGD Systems Industry Revenue billion Forecast, by Type 2020 & 2033
- Table 5: Global FGD Systems Industry Revenue billion Forecast, by End-User Industry 2020 & 2033
- Table 6: Global FGD Systems Industry Revenue billion Forecast, by Country 2020 & 2033
- Table 7: Global FGD Systems Industry Revenue billion Forecast, by Type 2020 & 2033
- Table 8: Global FGD Systems Industry Revenue billion Forecast, by End-User Industry 2020 & 2033
- Table 9: Global FGD Systems Industry Revenue billion Forecast, by Country 2020 & 2033
- Table 10: Global FGD Systems Industry Revenue billion Forecast, by Type 2020 & 2033
- Table 11: Global FGD Systems Industry Revenue billion Forecast, by End-User Industry 2020 & 2033
- Table 12: Global FGD Systems Industry Revenue billion Forecast, by Country 2020 & 2033
- Table 13: Global FGD Systems Industry Revenue billion Forecast, by Type 2020 & 2033
- Table 14: Global FGD Systems Industry Revenue billion Forecast, by End-User Industry 2020 & 2033
- Table 15: Global FGD Systems Industry Revenue billion Forecast, by Country 2020 & 2033
- Table 16: Global FGD Systems Industry Revenue billion Forecast, by Type 2020 & 2033
- Table 17: Global FGD Systems Industry Revenue billion Forecast, by End-User Industry 2020 & 2033
- Table 18: Global FGD Systems Industry Revenue billion Forecast, by Country 2020 & 2033
Frequently Asked Questions
1. What is the projected Compound Annual Growth Rate (CAGR) of the FGD Systems Industry?
The projected CAGR is approximately 13.06%.
2. Which companies are prominent players in the FGD Systems Industry?
Key companies in the market include Ducon Technologies Inc, Hamon Corporation, Mitsubishi Hitachi Power Systems Ltd, Fujian Longking Co Ltd, Babcock & Wilcox Enterprises Inc, Thermax Ltd*List Not Exhaustive, John Wood Group PLC, Alstom S A, General Electric Company, Andritz AG.
3. What are the main segments of the FGD Systems Industry?
The market segments include Type, End-User Industry.
4. Can you provide details about the market size?
The market size is estimated to be USD 9.55 billion as of 2022.
5. What are some drivers contributing to market growth?
4.; Increasing Industrialization across the World4.; Expansion and Development of New Power Plants.
6. What are the notable trends driving market growth?
Increasing Demand from Power Generation Sector.
7. Are there any restraints impacting market growth?
4.; Increasing Adoption of Renewable Energy.
8. Can you provide examples of recent developments in the market?
N/A
9. What pricing options are available for accessing the report?
Pricing options include single-user, multi-user, and enterprise licenses priced at USD 4750, USD 5250, and USD 8750 respectively.
10. Is the market size provided in terms of value or volume?
The market size is provided in terms of value, measured in billion.
11. Are there any specific market keywords associated with the report?
Yes, the market keyword associated with the report is "FGD Systems Industry," which aids in identifying and referencing the specific market segment covered.
12. How do I determine which pricing option suits my needs best?
The pricing options vary based on user requirements and access needs. Individual users may opt for single-user licenses, while businesses requiring broader access may choose multi-user or enterprise licenses for cost-effective access to the report.
13. Are there any additional resources or data provided in the FGD Systems Industry report?
While the report offers comprehensive insights, it's advisable to review the specific contents or supplementary materials provided to ascertain if additional resources or data are available.
14. How can I stay updated on further developments or reports in the FGD Systems Industry?
To stay informed about further developments, trends, and reports in the FGD Systems Industry, consider subscribing to industry newsletters, following relevant companies and organizations, or regularly checking reputable industry news sources and publications.
Methodology
Step 1 - Identification of Relevant Samples Size from Population Database


Step 2 - Approaches for Defining Global Market Size (Value, Volume* & Price*)

Note*: In applicable scenarios
Step 3 - Data Sources
Primary Research
- Web Analytics
- Survey Reports
- Research Institute
- Latest Research Reports
- Opinion Leaders
Secondary Research
- Annual Reports
- White Paper
- Latest Press Release
- Industry Association
- Paid Database
- Investor Presentations

Step 4 - Data Triangulation
Involves using different sources of information in order to increase the validity of a study
These sources are likely to be stakeholders in a program - participants, other researchers, program staff, other community members, and so on.
Then we put all data in single framework & apply various statistical tools to find out the dynamic on the market.
During the analysis stage, feedback from the stakeholder groups would be compared to determine areas of agreement as well as areas of divergence