


Key Insights
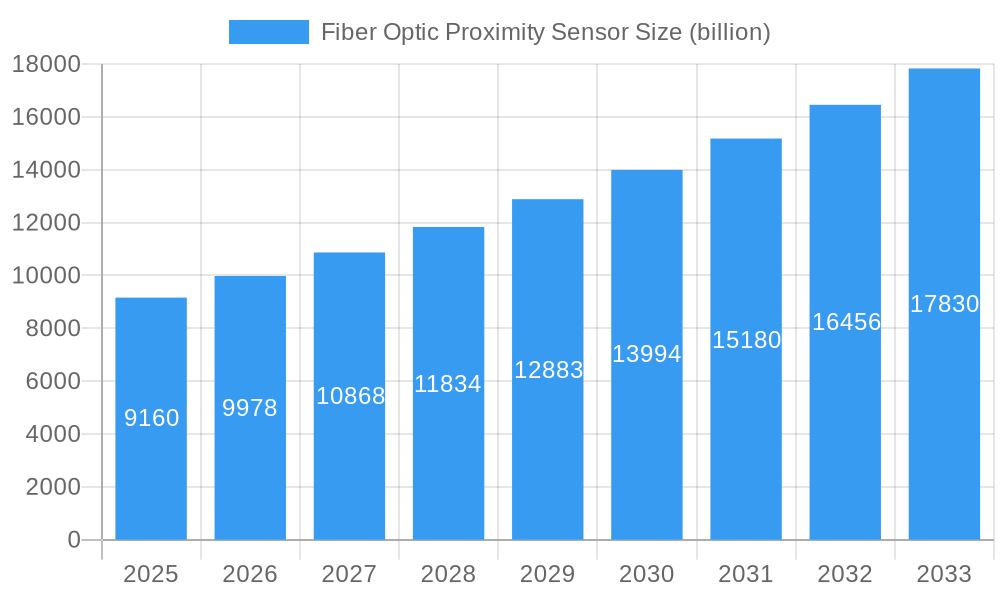
The Fiber Optic Proximity Sensor Market is poised for significant expansion, propelled by widespread industrial automation and the superior attributes of fiber optic technology. With a projected market size of $9.16 billion in the base year of 2025, the market is anticipated to grow at a robust Compound Annual Growth Rate (CAGR) of 8.83%. This sustained growth trajectory, extending to 2033, is driven by the escalating demand for precise, non-contact sensing solutions in critical sectors like robotics, automotive manufacturing, and food processing. The convergence of Industry 4.0 and smart manufacturing initiatives further amplifies this demand, coupled with the inherent advantages of fiber optic sensors, including immunity to electromagnetic interference (EMI), exceptional high-temperature tolerance, and extended sensing ranges. Leading industry participants, including Tri-Tronics, RS Components, and Pepperl+Fuchs, are actively pursuing strategic product development and market penetration to leverage this growth opportunity.
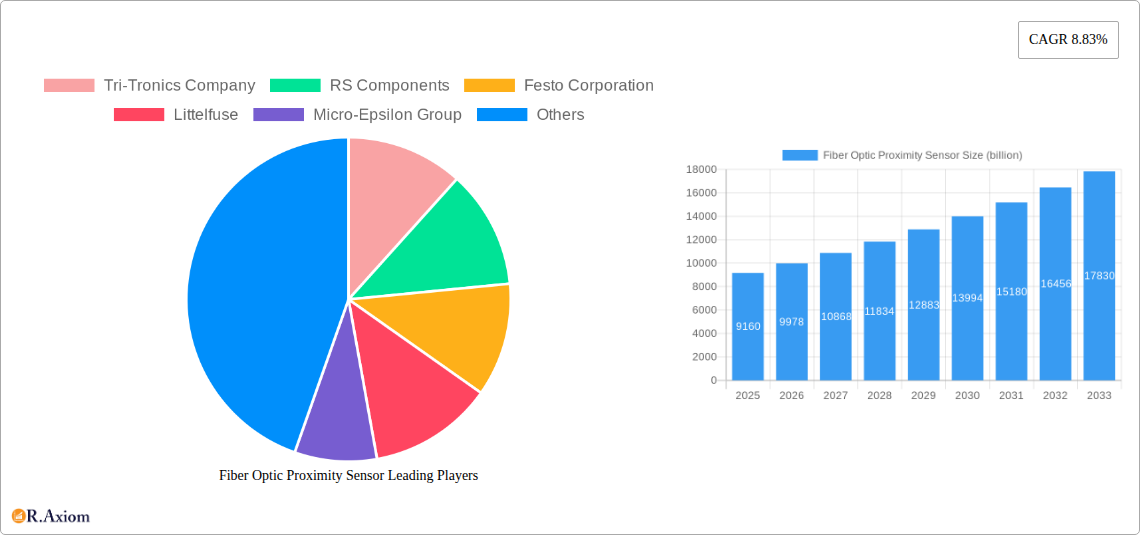
Fiber Optic Proximity Sensor Market Size (In Billion)

Market growth, however, faces certain constraints. The initial capital expenditure required for implementing fiber optic sensor systems and the necessity for specialized technical proficiency can present entry barriers, particularly for small and medium-sized enterprises. Additionally, the intricate process of integrating these advanced sensors into pre-existing infrastructure can pose integration challenges. Nevertheless, continuous innovation in fiber optic sensor technology, marked by the development of more compact, cost-efficient, and seamlessly integrable solutions, is expected to effectively address these limitations and sustain market momentum. The market is strategically segmented by sensor type (e.g., through-beam, retro-reflective), application (e.g., automotive, industrial automation), and geographical region (North America, Europe, Asia-Pacific, etc.), with North America and Asia-Pacific anticipated to dominate market share.
Fiber Optic Proximity Sensor Company Market Share
Fiber Optic Proximity Sensor Market Report: A Comprehensive Analysis (2019-2033)
This in-depth report provides a comprehensive analysis of the global fiber optic proximity sensor market, offering valuable insights into market dynamics, competitive landscape, and future growth potential. The study covers the period 2019-2033, with a focus on the forecast period 2025-2033, using 2025 as the base year. The report analyzes key market trends, segments, and leading players, offering actionable intelligence for industry stakeholders. Market values are expressed in millions.
Fiber Optic Proximity Sensor Market Concentration & Innovation
This section analyzes the market concentration, highlighting the leading players and their respective market shares. Innovation drivers, regulatory landscapes impacting the adoption of fiber optic proximity sensors, and the existence of substitute products are also examined. Further, the report investigates end-user trends influencing demand and the impact of mergers and acquisitions (M&A) activities on market dynamics. The estimated 2025 market size is $XX million.
- Market Concentration: The fiber optic proximity sensor market exhibits a moderately concentrated landscape, with the top five players accounting for approximately xx% of the global market share in 2025.
- Innovation Drivers: Advancements in fiber optic technology, miniaturization, enhanced performance characteristics (increased range, accuracy, and speed), and the growing need for robust and reliable sensing solutions are key innovation drivers.
- Regulatory Framework: Compliance with safety and industry standards (e.g., IEC, UL) influences product design and adoption. Stringent regulations in specific industries (e.g., automotive, healthcare) drive demand for certified sensors.
- Product Substitutes: While fiber optic sensors offer advantages in terms of immunity to electromagnetic interference and harsh environments, alternative technologies like inductive and capacitive sensors present competitive pressures.
- End-User Trends: The increasing automation across various industries, demand for improved safety and efficiency, and the need for non-contact sensing solutions are driving market growth.
- M&A Activities: The total value of M&A deals in the fiber optic proximity sensor market during the historical period (2019-2024) is estimated at $XX million, with a significant focus on strategic acquisitions to expand product portfolios and market reach.
Fiber Optic Proximity Sensor Industry Trends & Insights
This section delves into the key trends shaping the fiber optic proximity sensor market, focusing on market growth drivers, technological advancements, consumer preferences, and competitive dynamics. The compound annual growth rate (CAGR) and market penetration rates are analyzed to provide a comprehensive understanding of market evolution. The estimated 2025 market size is $XX million, projected to reach $XX million by 2033, exhibiting a CAGR of xx%.
The market is characterized by rapid technological advancements, resulting in improved sensor performance and functionalities. The increasing demand for automation in diverse industries, such as manufacturing, automotive, and logistics, is a major growth driver. Consumer preferences are shifting towards more reliable, precise, and cost-effective sensing solutions. Intense competition among established players and emerging companies fuels innovation and drives price optimization. Market penetration is steadily increasing across various regions, driven by factors such as rising industrial automation and technological advancements.
Dominant Markets & Segments in Fiber Optic Proximity Sensor
This section identifies the leading regions, countries, and market segments exhibiting significant growth in fiber optic proximity sensor adoption. Key drivers for dominance are analyzed, including economic policies, infrastructure development, and industry-specific applications. The estimated 2025 market size for the dominant region is $XX million.
- Dominant Region: [Insert Dominant Region, e.g., North America]
- Key Drivers: Strong industrial base, high adoption of automation technologies, favorable regulatory environment, and robust investment in R&D.
- Dominant Country: [Insert Dominant Country, e.g., United States]
- Key Drivers: Well-established manufacturing sector, extensive automation in various industries, significant government support for technological advancements, and a high concentration of key players.
- Dominant Segment: [Insert Dominant Segment, e.g., Automotive Industry]
- Key Drivers: Growing demand for advanced driver-assistance systems (ADAS), increasing vehicle automation, and stringent safety regulations.
Fiber Optic Proximity Sensor Product Developments
This section summarizes recent product innovations, applications, and competitive advantages in the fiber optic proximity sensor market. Technological trends and the market fit of these innovations are discussed. The ongoing development of smaller, faster, and more energy-efficient sensors reflects ongoing innovation. Advanced features, such as enhanced accuracy and immunity to environmental factors, continue to be key differentiators. These advancements broaden the applications of fiber optic proximity sensors across various industries, driving increased market penetration.
Report Scope & Segmentation Analysis
This report segments the fiber optic proximity sensor market based on [Insert Segmentation parameters, e.g., type, range, application, and region]. Each segment's growth projections, market size, and competitive dynamics are analyzed individually. Detailed information on specific market segments and their growth trajectories are provided.
Key Drivers of Fiber Optic Proximity Sensor Growth
Technological advancements, increasing automation across various sectors, and stringent regulatory requirements are driving the growth of the fiber optic proximity sensor market. The growing adoption of Industry 4.0 principles and the expansion of the automotive and manufacturing sectors are also contributing factors.
Challenges in the Fiber Optic Proximity Sensor Sector
High initial investment costs, the complexity of installation and integration, and the potential for signal interference can hinder market growth. Supply chain disruptions and intense competition among numerous industry players further present challenges to market expansion.
Emerging Opportunities in Fiber Optic Proximity Sensor
Emerging opportunities lie in the expansion into new applications in fields like robotics, healthcare, and smart infrastructure. The development of innovative sensor designs and functionalities creates potential for increased market penetration. The increasing demand for robust, reliable, and cost-effective sensing solutions across various industrial sectors opens up new avenues for growth.
Leading Players in the Fiber Optic Proximity Sensor Market
- Tri-Tronics Company
- RS Components
- Festo Corporation
- Littelfuse
- Micro-Epsilon Group
- ifm electronic
- SensoPart
- Locon Sensor Systems
- Newark
- Eaton Corporation
- Pepperl+Fuchs
- Takex America
- Optex
- Baumer
- MTI Instruments
- Banner Engineering
- KEYENCE
- OMEGA Engineering
- Azbil Corporation
- Fiso
- Shenzhen Boyi Jingke Technology
- Hunan F and C
Key Developments in Fiber Optic Proximity Sensor Industry
- 2022 Q4: [Insert Key Development, e.g., Launch of a new high-precision fiber optic proximity sensor by Company X]
- 2023 Q1: [Insert Key Development, e.g., Acquisition of Company Y by Company Z]
- 2023 Q3: [Insert Key Development, e.g., Introduction of a new fiber optic sensor technology with enhanced range and accuracy]
Strategic Outlook for Fiber Optic Proximity Sensor Market
The fiber optic proximity sensor market is poised for significant growth driven by the accelerating pace of automation across various sectors, the rising demand for high-precision sensing solutions, and ongoing technological advancements. New application areas and product innovations will continue to drive market expansion throughout the forecast period. The market's strong growth trajectory is expected to persist, offering attractive opportunities for both established players and new entrants.
Fiber Optic Proximity Sensor Segmentation
-
1. Application
- 1.1. Aerospace
- 1.2. National Defense
- 1.3. Military
- 1.4. Energy
- 1.5. Traffic
- 1.6. Correspondence
- 1.7. Others
-
2. Type
- 2.1. Through Beam
- 2.2. Diffuse
- 2.3. Thru-beam
- 2.4. Others
Fiber Optic Proximity Sensor Segmentation By Geography
-
1. North America
- 1.1. United States
- 1.2. Canada
- 1.3. Mexico
-
2. South America
- 2.1. Brazil
- 2.2. Argentina
- 2.3. Rest of South America
-
3. Europe
- 3.1. United Kingdom
- 3.2. Germany
- 3.3. France
- 3.4. Italy
- 3.5. Spain
- 3.6. Russia
- 3.7. Benelux
- 3.8. Nordics
- 3.9. Rest of Europe
-
4. Middle East & Africa
- 4.1. Turkey
- 4.2. Israel
- 4.3. GCC
- 4.4. North Africa
- 4.5. South Africa
- 4.6. Rest of Middle East & Africa
-
5. Asia Pacific
- 5.1. China
- 5.2. India
- 5.3. Japan
- 5.4. South Korea
- 5.5. ASEAN
- 5.6. Oceania
- 5.7. Rest of Asia Pacific
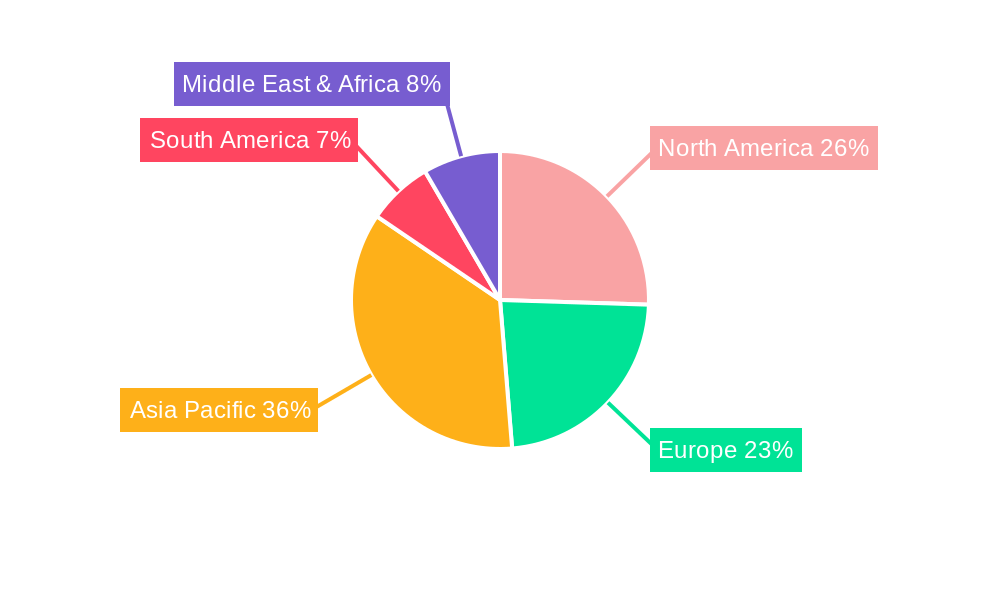
Fiber Optic Proximity Sensor Regional Market Share
Geographic Coverage of Fiber Optic Proximity Sensor
Fiber Optic Proximity Sensor REPORT HIGHLIGHTS
| Aspects | Details |
|---|---|
| Study Period | 2020-2034 |
| Base Year | 2025 |
| Estimated Year | 2026 |
| Forecast Period | 2026-2034 |
| Historical Period | 2020-2025 |
| Growth Rate | CAGR of 8.83% from 2020-2034 |
| Segmentation |
|
Table of Contents
- 1. Introduction
- 1.1. Research Scope
- 1.2. Market Segmentation
- 1.3. Research Methodology
- 1.4. Definitions and Assumptions
- 2. Executive Summary
- 2.1. Introduction
- 3. Market Dynamics
- 3.1. Introduction
- 3.2. Market Drivers
- 3.3. Market Restrains
- 3.4. Market Trends
- 4. Market Factor Analysis
- 4.1. Porters Five Forces
- 4.2. Supply/Value Chain
- 4.3. PESTEL analysis
- 4.4. Market Entropy
- 4.5. Patent/Trademark Analysis
- 5. Global Fiber Optic Proximity Sensor Analysis, Insights and Forecast, 2020-2032
- 5.1. Market Analysis, Insights and Forecast - by Application
- 5.1.1. Aerospace
- 5.1.2. National Defense
- 5.1.3. Military
- 5.1.4. Energy
- 5.1.5. Traffic
- 5.1.6. Correspondence
- 5.1.7. Others
- 5.2. Market Analysis, Insights and Forecast - by Type
- 5.2.1. Through Beam
- 5.2.2. Diffuse
- 5.2.3. Thru-beam
- 5.2.4. Others
- 5.3. Market Analysis, Insights and Forecast - by Region
- 5.3.1. North America
- 5.3.2. South America
- 5.3.3. Europe
- 5.3.4. Middle East & Africa
- 5.3.5. Asia Pacific
- 5.1. Market Analysis, Insights and Forecast - by Application
- 6. North America Fiber Optic Proximity Sensor Analysis, Insights and Forecast, 2020-2032
- 6.1. Market Analysis, Insights and Forecast - by Application
- 6.1.1. Aerospace
- 6.1.2. National Defense
- 6.1.3. Military
- 6.1.4. Energy
- 6.1.5. Traffic
- 6.1.6. Correspondence
- 6.1.7. Others
- 6.2. Market Analysis, Insights and Forecast - by Type
- 6.2.1. Through Beam
- 6.2.2. Diffuse
- 6.2.3. Thru-beam
- 6.2.4. Others
- 6.1. Market Analysis, Insights and Forecast - by Application
- 7. South America Fiber Optic Proximity Sensor Analysis, Insights and Forecast, 2020-2032
- 7.1. Market Analysis, Insights and Forecast - by Application
- 7.1.1. Aerospace
- 7.1.2. National Defense
- 7.1.3. Military
- 7.1.4. Energy
- 7.1.5. Traffic
- 7.1.6. Correspondence
- 7.1.7. Others
- 7.2. Market Analysis, Insights and Forecast - by Type
- 7.2.1. Through Beam
- 7.2.2. Diffuse
- 7.2.3. Thru-beam
- 7.2.4. Others
- 7.1. Market Analysis, Insights and Forecast - by Application
- 8. Europe Fiber Optic Proximity Sensor Analysis, Insights and Forecast, 2020-2032
- 8.1. Market Analysis, Insights and Forecast - by Application
- 8.1.1. Aerospace
- 8.1.2. National Defense
- 8.1.3. Military
- 8.1.4. Energy
- 8.1.5. Traffic
- 8.1.6. Correspondence
- 8.1.7. Others
- 8.2. Market Analysis, Insights and Forecast - by Type
- 8.2.1. Through Beam
- 8.2.2. Diffuse
- 8.2.3. Thru-beam
- 8.2.4. Others
- 8.1. Market Analysis, Insights and Forecast - by Application
- 9. Middle East & Africa Fiber Optic Proximity Sensor Analysis, Insights and Forecast, 2020-2032
- 9.1. Market Analysis, Insights and Forecast - by Application
- 9.1.1. Aerospace
- 9.1.2. National Defense
- 9.1.3. Military
- 9.1.4. Energy
- 9.1.5. Traffic
- 9.1.6. Correspondence
- 9.1.7. Others
- 9.2. Market Analysis, Insights and Forecast - by Type
- 9.2.1. Through Beam
- 9.2.2. Diffuse
- 9.2.3. Thru-beam
- 9.2.4. Others
- 9.1. Market Analysis, Insights and Forecast - by Application
- 10. Asia Pacific Fiber Optic Proximity Sensor Analysis, Insights and Forecast, 2020-2032
- 10.1. Market Analysis, Insights and Forecast - by Application
- 10.1.1. Aerospace
- 10.1.2. National Defense
- 10.1.3. Military
- 10.1.4. Energy
- 10.1.5. Traffic
- 10.1.6. Correspondence
- 10.1.7. Others
- 10.2. Market Analysis, Insights and Forecast - by Type
- 10.2.1. Through Beam
- 10.2.2. Diffuse
- 10.2.3. Thru-beam
- 10.2.4. Others
- 10.1. Market Analysis, Insights and Forecast - by Application
- 11. Competitive Analysis
- 11.1. Global Market Share Analysis 2025
- 11.2. Company Profiles
- 11.2.1 Tri-Tronics Company
- 11.2.1.1. Overview
- 11.2.1.2. Products
- 11.2.1.3. SWOT Analysis
- 11.2.1.4. Recent Developments
- 11.2.1.5. Financials (Based on Availability)
- 11.2.2 RS Components
- 11.2.2.1. Overview
- 11.2.2.2. Products
- 11.2.2.3. SWOT Analysis
- 11.2.2.4. Recent Developments
- 11.2.2.5. Financials (Based on Availability)
- 11.2.3 Festo Corporation
- 11.2.3.1. Overview
- 11.2.3.2. Products
- 11.2.3.3. SWOT Analysis
- 11.2.3.4. Recent Developments
- 11.2.3.5. Financials (Based on Availability)
- 11.2.4 Littelfuse
- 11.2.4.1. Overview
- 11.2.4.2. Products
- 11.2.4.3. SWOT Analysis
- 11.2.4.4. Recent Developments
- 11.2.4.5. Financials (Based on Availability)
- 11.2.5 Micro-Epsilon Group
- 11.2.5.1. Overview
- 11.2.5.2. Products
- 11.2.5.3. SWOT Analysis
- 11.2.5.4. Recent Developments
- 11.2.5.5. Financials (Based on Availability)
- 11.2.6 ifm electronic
- 11.2.6.1. Overview
- 11.2.6.2. Products
- 11.2.6.3. SWOT Analysis
- 11.2.6.4. Recent Developments
- 11.2.6.5. Financials (Based on Availability)
- 11.2.7 SensoPart
- 11.2.7.1. Overview
- 11.2.7.2. Products
- 11.2.7.3. SWOT Analysis
- 11.2.7.4. Recent Developments
- 11.2.7.5. Financials (Based on Availability)
- 11.2.8 Locon Sensor Systems
- 11.2.8.1. Overview
- 11.2.8.2. Products
- 11.2.8.3. SWOT Analysis
- 11.2.8.4. Recent Developments
- 11.2.8.5. Financials (Based on Availability)
- 11.2.9 Newark
- 11.2.9.1. Overview
- 11.2.9.2. Products
- 11.2.9.3. SWOT Analysis
- 11.2.9.4. Recent Developments
- 11.2.9.5. Financials (Based on Availability)
- 11.2.10 Eaton Corporation
- 11.2.10.1. Overview
- 11.2.10.2. Products
- 11.2.10.3. SWOT Analysis
- 11.2.10.4. Recent Developments
- 11.2.10.5. Financials (Based on Availability)
- 11.2.11 Pepperl+Fuchs
- 11.2.11.1. Overview
- 11.2.11.2. Products
- 11.2.11.3. SWOT Analysis
- 11.2.11.4. Recent Developments
- 11.2.11.5. Financials (Based on Availability)
- 11.2.12 Takex America
- 11.2.12.1. Overview
- 11.2.12.2. Products
- 11.2.12.3. SWOT Analysis
- 11.2.12.4. Recent Developments
- 11.2.12.5. Financials (Based on Availability)
- 11.2.13 Optex
- 11.2.13.1. Overview
- 11.2.13.2. Products
- 11.2.13.3. SWOT Analysis
- 11.2.13.4. Recent Developments
- 11.2.13.5. Financials (Based on Availability)
- 11.2.14 Baumer
- 11.2.14.1. Overview
- 11.2.14.2. Products
- 11.2.14.3. SWOT Analysis
- 11.2.14.4. Recent Developments
- 11.2.14.5. Financials (Based on Availability)
- 11.2.15 MTI Instruments
- 11.2.15.1. Overview
- 11.2.15.2. Products
- 11.2.15.3. SWOT Analysis
- 11.2.15.4. Recent Developments
- 11.2.15.5. Financials (Based on Availability)
- 11.2.16 Banner Engineering
- 11.2.16.1. Overview
- 11.2.16.2. Products
- 11.2.16.3. SWOT Analysis
- 11.2.16.4. Recent Developments
- 11.2.16.5. Financials (Based on Availability)
- 11.2.17 KEYENCE
- 11.2.17.1. Overview
- 11.2.17.2. Products
- 11.2.17.3. SWOT Analysis
- 11.2.17.4. Recent Developments
- 11.2.17.5. Financials (Based on Availability)
- 11.2.18 OMEGA Engineering
- 11.2.18.1. Overview
- 11.2.18.2. Products
- 11.2.18.3. SWOT Analysis
- 11.2.18.4. Recent Developments
- 11.2.18.5. Financials (Based on Availability)
- 11.2.19 Azbil Corporation
- 11.2.19.1. Overview
- 11.2.19.2. Products
- 11.2.19.3. SWOT Analysis
- 11.2.19.4. Recent Developments
- 11.2.19.5. Financials (Based on Availability)
- 11.2.20 Fiso
- 11.2.20.1. Overview
- 11.2.20.2. Products
- 11.2.20.3. SWOT Analysis
- 11.2.20.4. Recent Developments
- 11.2.20.5. Financials (Based on Availability)
- 11.2.21 Shenzhen Boyi Jingke Technology
- 11.2.21.1. Overview
- 11.2.21.2. Products
- 11.2.21.3. SWOT Analysis
- 11.2.21.4. Recent Developments
- 11.2.21.5. Financials (Based on Availability)
- 11.2.22 Hunan F and C
- 11.2.22.1. Overview
- 11.2.22.2. Products
- 11.2.22.3. SWOT Analysis
- 11.2.22.4. Recent Developments
- 11.2.22.5. Financials (Based on Availability)
- 11.2.1 Tri-Tronics Company
List of Figures
- Figure 1: Global Fiber Optic Proximity Sensor Revenue Breakdown (billion, %) by Region 2025 & 2033
- Figure 2: North America Fiber Optic Proximity Sensor Revenue (billion), by Application 2025 & 2033
- Figure 3: North America Fiber Optic Proximity Sensor Revenue Share (%), by Application 2025 & 2033
- Figure 4: North America Fiber Optic Proximity Sensor Revenue (billion), by Type 2025 & 2033
- Figure 5: North America Fiber Optic Proximity Sensor Revenue Share (%), by Type 2025 & 2033
- Figure 6: North America Fiber Optic Proximity Sensor Revenue (billion), by Country 2025 & 2033
- Figure 7: North America Fiber Optic Proximity Sensor Revenue Share (%), by Country 2025 & 2033
- Figure 8: South America Fiber Optic Proximity Sensor Revenue (billion), by Application 2025 & 2033
- Figure 9: South America Fiber Optic Proximity Sensor Revenue Share (%), by Application 2025 & 2033
- Figure 10: South America Fiber Optic Proximity Sensor Revenue (billion), by Type 2025 & 2033
- Figure 11: South America Fiber Optic Proximity Sensor Revenue Share (%), by Type 2025 & 2033
- Figure 12: South America Fiber Optic Proximity Sensor Revenue (billion), by Country 2025 & 2033
- Figure 13: South America Fiber Optic Proximity Sensor Revenue Share (%), by Country 2025 & 2033
- Figure 14: Europe Fiber Optic Proximity Sensor Revenue (billion), by Application 2025 & 2033
- Figure 15: Europe Fiber Optic Proximity Sensor Revenue Share (%), by Application 2025 & 2033
- Figure 16: Europe Fiber Optic Proximity Sensor Revenue (billion), by Type 2025 & 2033
- Figure 17: Europe Fiber Optic Proximity Sensor Revenue Share (%), by Type 2025 & 2033
- Figure 18: Europe Fiber Optic Proximity Sensor Revenue (billion), by Country 2025 & 2033
- Figure 19: Europe Fiber Optic Proximity Sensor Revenue Share (%), by Country 2025 & 2033
- Figure 20: Middle East & Africa Fiber Optic Proximity Sensor Revenue (billion), by Application 2025 & 2033
- Figure 21: Middle East & Africa Fiber Optic Proximity Sensor Revenue Share (%), by Application 2025 & 2033
- Figure 22: Middle East & Africa Fiber Optic Proximity Sensor Revenue (billion), by Type 2025 & 2033
- Figure 23: Middle East & Africa Fiber Optic Proximity Sensor Revenue Share (%), by Type 2025 & 2033
- Figure 24: Middle East & Africa Fiber Optic Proximity Sensor Revenue (billion), by Country 2025 & 2033
- Figure 25: Middle East & Africa Fiber Optic Proximity Sensor Revenue Share (%), by Country 2025 & 2033
- Figure 26: Asia Pacific Fiber Optic Proximity Sensor Revenue (billion), by Application 2025 & 2033
- Figure 27: Asia Pacific Fiber Optic Proximity Sensor Revenue Share (%), by Application 2025 & 2033
- Figure 28: Asia Pacific Fiber Optic Proximity Sensor Revenue (billion), by Type 2025 & 2033
- Figure 29: Asia Pacific Fiber Optic Proximity Sensor Revenue Share (%), by Type 2025 & 2033
- Figure 30: Asia Pacific Fiber Optic Proximity Sensor Revenue (billion), by Country 2025 & 2033
- Figure 31: Asia Pacific Fiber Optic Proximity Sensor Revenue Share (%), by Country 2025 & 2033
List of Tables
- Table 1: Global Fiber Optic Proximity Sensor Revenue billion Forecast, by Application 2020 & 2033
- Table 2: Global Fiber Optic Proximity Sensor Revenue billion Forecast, by Type 2020 & 2033
- Table 3: Global Fiber Optic Proximity Sensor Revenue billion Forecast, by Region 2020 & 2033
- Table 4: Global Fiber Optic Proximity Sensor Revenue billion Forecast, by Application 2020 & 2033
- Table 5: Global Fiber Optic Proximity Sensor Revenue billion Forecast, by Type 2020 & 2033
- Table 6: Global Fiber Optic Proximity Sensor Revenue billion Forecast, by Country 2020 & 2033
- Table 7: United States Fiber Optic Proximity Sensor Revenue (billion) Forecast, by Application 2020 & 2033
- Table 8: Canada Fiber Optic Proximity Sensor Revenue (billion) Forecast, by Application 2020 & 2033
- Table 9: Mexico Fiber Optic Proximity Sensor Revenue (billion) Forecast, by Application 2020 & 2033
- Table 10: Global Fiber Optic Proximity Sensor Revenue billion Forecast, by Application 2020 & 2033
- Table 11: Global Fiber Optic Proximity Sensor Revenue billion Forecast, by Type 2020 & 2033
- Table 12: Global Fiber Optic Proximity Sensor Revenue billion Forecast, by Country 2020 & 2033
- Table 13: Brazil Fiber Optic Proximity Sensor Revenue (billion) Forecast, by Application 2020 & 2033
- Table 14: Argentina Fiber Optic Proximity Sensor Revenue (billion) Forecast, by Application 2020 & 2033
- Table 15: Rest of South America Fiber Optic Proximity Sensor Revenue (billion) Forecast, by Application 2020 & 2033
- Table 16: Global Fiber Optic Proximity Sensor Revenue billion Forecast, by Application 2020 & 2033
- Table 17: Global Fiber Optic Proximity Sensor Revenue billion Forecast, by Type 2020 & 2033
- Table 18: Global Fiber Optic Proximity Sensor Revenue billion Forecast, by Country 2020 & 2033
- Table 19: United Kingdom Fiber Optic Proximity Sensor Revenue (billion) Forecast, by Application 2020 & 2033
- Table 20: Germany Fiber Optic Proximity Sensor Revenue (billion) Forecast, by Application 2020 & 2033
- Table 21: France Fiber Optic Proximity Sensor Revenue (billion) Forecast, by Application 2020 & 2033
- Table 22: Italy Fiber Optic Proximity Sensor Revenue (billion) Forecast, by Application 2020 & 2033
- Table 23: Spain Fiber Optic Proximity Sensor Revenue (billion) Forecast, by Application 2020 & 2033
- Table 24: Russia Fiber Optic Proximity Sensor Revenue (billion) Forecast, by Application 2020 & 2033
- Table 25: Benelux Fiber Optic Proximity Sensor Revenue (billion) Forecast, by Application 2020 & 2033
- Table 26: Nordics Fiber Optic Proximity Sensor Revenue (billion) Forecast, by Application 2020 & 2033
- Table 27: Rest of Europe Fiber Optic Proximity Sensor Revenue (billion) Forecast, by Application 2020 & 2033
- Table 28: Global Fiber Optic Proximity Sensor Revenue billion Forecast, by Application 2020 & 2033
- Table 29: Global Fiber Optic Proximity Sensor Revenue billion Forecast, by Type 2020 & 2033
- Table 30: Global Fiber Optic Proximity Sensor Revenue billion Forecast, by Country 2020 & 2033
- Table 31: Turkey Fiber Optic Proximity Sensor Revenue (billion) Forecast, by Application 2020 & 2033
- Table 32: Israel Fiber Optic Proximity Sensor Revenue (billion) Forecast, by Application 2020 & 2033
- Table 33: GCC Fiber Optic Proximity Sensor Revenue (billion) Forecast, by Application 2020 & 2033
- Table 34: North Africa Fiber Optic Proximity Sensor Revenue (billion) Forecast, by Application 2020 & 2033
- Table 35: South Africa Fiber Optic Proximity Sensor Revenue (billion) Forecast, by Application 2020 & 2033
- Table 36: Rest of Middle East & Africa Fiber Optic Proximity Sensor Revenue (billion) Forecast, by Application 2020 & 2033
- Table 37: Global Fiber Optic Proximity Sensor Revenue billion Forecast, by Application 2020 & 2033
- Table 38: Global Fiber Optic Proximity Sensor Revenue billion Forecast, by Type 2020 & 2033
- Table 39: Global Fiber Optic Proximity Sensor Revenue billion Forecast, by Country 2020 & 2033
- Table 40: China Fiber Optic Proximity Sensor Revenue (billion) Forecast, by Application 2020 & 2033
- Table 41: India Fiber Optic Proximity Sensor Revenue (billion) Forecast, by Application 2020 & 2033
- Table 42: Japan Fiber Optic Proximity Sensor Revenue (billion) Forecast, by Application 2020 & 2033
- Table 43: South Korea Fiber Optic Proximity Sensor Revenue (billion) Forecast, by Application 2020 & 2033
- Table 44: ASEAN Fiber Optic Proximity Sensor Revenue (billion) Forecast, by Application 2020 & 2033
- Table 45: Oceania Fiber Optic Proximity Sensor Revenue (billion) Forecast, by Application 2020 & 2033
- Table 46: Rest of Asia Pacific Fiber Optic Proximity Sensor Revenue (billion) Forecast, by Application 2020 & 2033
Frequently Asked Questions
1. What is the projected Compound Annual Growth Rate (CAGR) of the Fiber Optic Proximity Sensor?
The projected CAGR is approximately 8.83%.
2. Which companies are prominent players in the Fiber Optic Proximity Sensor?
Key companies in the market include Tri-Tronics Company, RS Components, Festo Corporation, Littelfuse, Micro-Epsilon Group, ifm electronic, SensoPart, Locon Sensor Systems, Newark, Eaton Corporation, Pepperl+Fuchs, Takex America, Optex, Baumer, MTI Instruments, Banner Engineering, KEYENCE, OMEGA Engineering, Azbil Corporation, Fiso, Shenzhen Boyi Jingke Technology, Hunan F and C.
3. What are the main segments of the Fiber Optic Proximity Sensor?
The market segments include Application, Type.
4. Can you provide details about the market size?
The market size is estimated to be USD 9.16 billion as of 2022.
5. What are some drivers contributing to market growth?
N/A
6. What are the notable trends driving market growth?
N/A
7. Are there any restraints impacting market growth?
N/A
8. Can you provide examples of recent developments in the market?
N/A
9. What pricing options are available for accessing the report?
Pricing options include single-user, multi-user, and enterprise licenses priced at USD 2900.00, USD 4350.00, and USD 5800.00 respectively.
10. Is the market size provided in terms of value or volume?
The market size is provided in terms of value, measured in billion.
11. Are there any specific market keywords associated with the report?
Yes, the market keyword associated with the report is "Fiber Optic Proximity Sensor," which aids in identifying and referencing the specific market segment covered.
12. How do I determine which pricing option suits my needs best?
The pricing options vary based on user requirements and access needs. Individual users may opt for single-user licenses, while businesses requiring broader access may choose multi-user or enterprise licenses for cost-effective access to the report.
13. Are there any additional resources or data provided in the Fiber Optic Proximity Sensor report?
While the report offers comprehensive insights, it's advisable to review the specific contents or supplementary materials provided to ascertain if additional resources or data are available.
14. How can I stay updated on further developments or reports in the Fiber Optic Proximity Sensor?
To stay informed about further developments, trends, and reports in the Fiber Optic Proximity Sensor, consider subscribing to industry newsletters, following relevant companies and organizations, or regularly checking reputable industry news sources and publications.
Methodology
Step 1 - Identification of Relevant Samples Size from Population Database


Step 2 - Approaches for Defining Global Market Size (Value, Volume* & Price*)

Note*: In applicable scenarios
Step 3 - Data Sources
Primary Research
- Web Analytics
- Survey Reports
- Research Institute
- Latest Research Reports
- Opinion Leaders
Secondary Research
- Annual Reports
- White Paper
- Latest Press Release
- Industry Association
- Paid Database
- Investor Presentations

Step 4 - Data Triangulation
Involves using different sources of information in order to increase the validity of a study
These sources are likely to be stakeholders in a program - participants, other researchers, program staff, other community members, and so on.
Then we put all data in single framework & apply various statistical tools to find out the dynamic on the market.
During the analysis stage, feedback from the stakeholder groups would be compared to determine areas of agreement as well as areas of divergence