
Key Insights
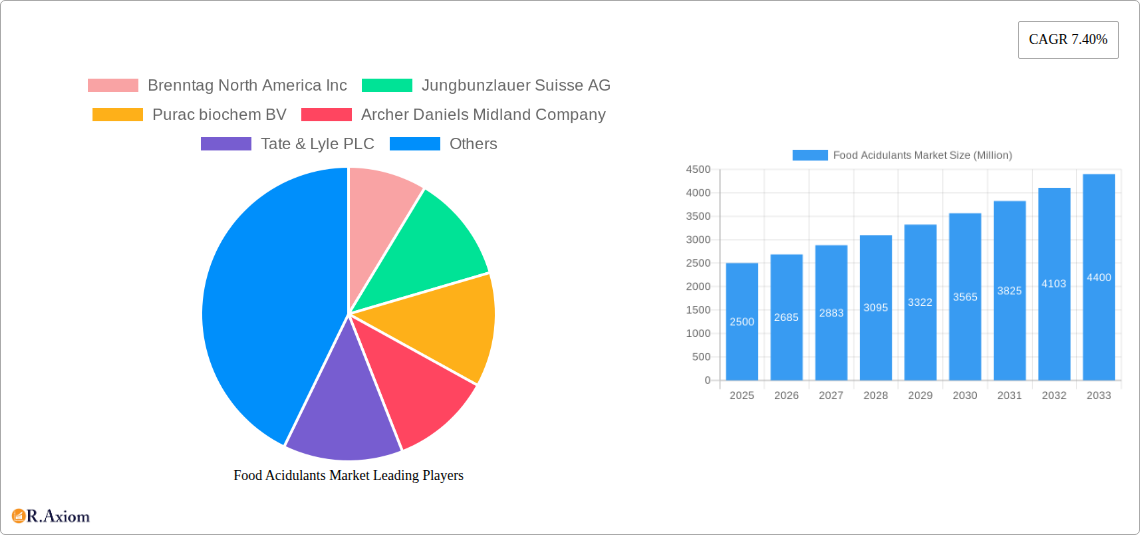
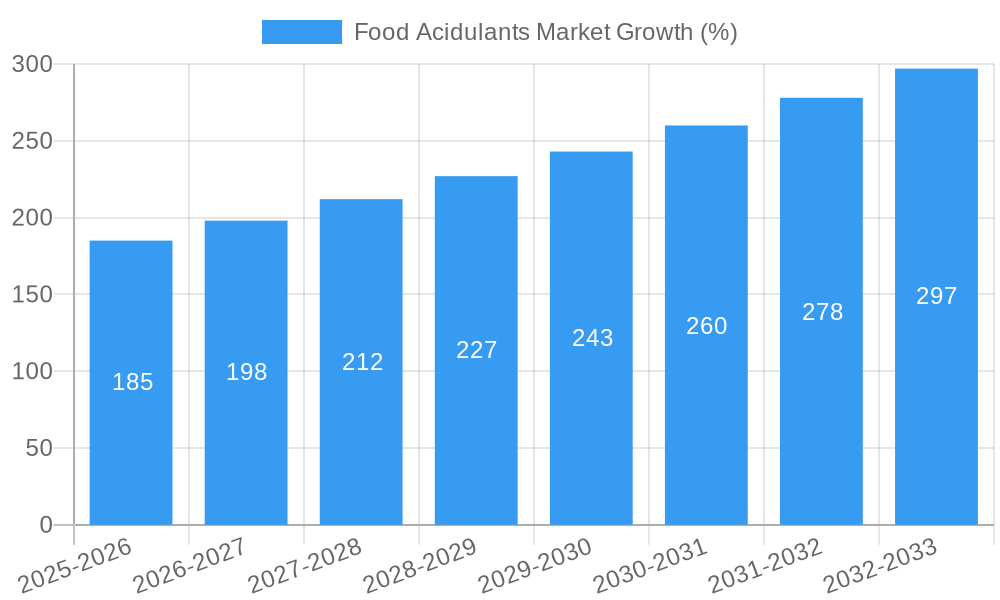
The global food acidulants market, valued at approximately $XX million in 2025, is projected to experience robust growth, driven by a compound annual growth rate (CAGR) of 7.40% from 2025 to 2033. This expansion is fueled by several key factors. The increasing demand for processed foods and beverages, particularly in developing economies, is a major catalyst. Consumers are increasingly seeking convenient and shelf-stable food products, driving the demand for preservatives and flavor enhancers like food acidulants. Furthermore, the growing popularity of healthier food options and functional foods is also contributing to market growth, as certain acidulants offer health benefits. The rising adoption of acidulants in various applications, including beverages, dairy, bakery, and meat products, is further bolstering market expansion. Within the segment breakdown, citric acid, owing to its widespread use and versatility, currently holds a significant market share. However, other acidulants like lactic acid and malic acid are witnessing increased adoption due to their functional properties and health benefits. Geographic segmentation shows a strong presence in North America and Europe, but the Asia-Pacific region is expected to witness significant growth in the coming years, driven by rising disposable incomes and changing dietary preferences.
While the market presents significant opportunities, certain challenges exist. Fluctuations in raw material prices, particularly for agricultural products used in acidulant production, can impact profitability. Stringent regulatory requirements regarding food additives and preservatives can also create hurdles for market players. However, ongoing research and development efforts focused on sustainable and cost-effective production methods are expected to mitigate some of these constraints. The competitive landscape is characterized by the presence of both large multinational corporations and smaller specialized manufacturers. Strategic partnerships, mergers, and acquisitions are anticipated to shape the market dynamics in the coming years, further contributing to its growth trajectory.
Food Acidulants Market: A Comprehensive Report (2019-2033)
This detailed report provides a comprehensive analysis of the global Food Acidulants Market, offering invaluable insights for stakeholders seeking to understand market dynamics, competitive landscapes, and future growth potential. The study period spans from 2019 to 2033, with 2025 serving as the base and estimated year. The forecast period covers 2025-2033, while the historical period analyzed is 2019-2024. The market is segmented by type (Citric Acid, Lactic Acid, Acetic Acid, Phosphoric Acid, Malic Acid, Other Types) and application (Beverages, Dairy and Frozen Products, Bakery, Meat Industry, Confectionery, Other Applications). Key players profiled include Brenntag North America Inc, Jungbunzlauer Suisse AG, Purac biochem BV, Archer Daniels Midland Company, Tate & Lyle PLC, Hawkins Watts Limited, Fuerst Day Lawson Limited, Cargill Inc, Corbion NV, and Bartek Ingredients Inc. The report’s findings are supported by robust data analysis and expert insights.
Food Acidulants Market Concentration & Innovation
The Food Acidulants market exhibits a moderately concentrated structure, with a handful of major players holding significant market share. Precise figures for market share are unavailable at this time (xx%), but the competitive landscape is characterized by both established multinational corporations and smaller, specialized producers. Innovation within the industry is driven by the need for cleaner labels, improved functionality, and sustainable production methods. Regulatory frameworks, particularly concerning food safety and labeling, significantly influence market dynamics. The presence of product substitutes, such as natural alternatives, presents ongoing competitive pressures. End-user trends towards healthier and more natural food products are shaping demand. M&A activity in the sector has been moderate, with deal values varying significantly depending on the size and strategic fit of the companies involved. For example, in 2022, a major player (name unavailable, xx Million USD) in the citric acid segment acquired a smaller competitor. This activity reflects a push towards consolidating market share and expanding product portfolios. Furthermore, the rise of private label brands also affects the market concentration, though the exact quantification of this impact is difficult to calculate precisely at this time (xx%).
Food Acidulants Market Industry Trends & Insights
The global Food Acidulants market is expected to experience robust growth during the forecast period, driven by several key factors. The projected Compound Annual Growth Rate (CAGR) is estimated to be xx% between 2025 and 2033. This growth is fueled by rising consumer demand for processed foods, expanding applications in various food and beverage segments, and increasing health consciousness amongst consumers. Technological advancements in production processes are leading to cost efficiency and improved product quality. Consumer preferences for clean-label ingredients are encouraging the adoption of natural acidulants, creating both opportunities and challenges for manufacturers. Competitive dynamics are characterized by intense rivalry among major players, driving innovation and price competition. Market penetration of specific acidulants varies considerably, with citric acid maintaining a dominant position while others like malic acid are experiencing increased growth due to rising demand in specific segments, such as the confectionery market. The market’s growth trajectory is significantly influenced by changing dietary habits, growing health consciousness, and increasing focus on food safety regulations globally. Moreover, the rising popularity of functional foods and beverages is further pushing this market upward.
Dominant Markets & Segments in Food Acidulants Market
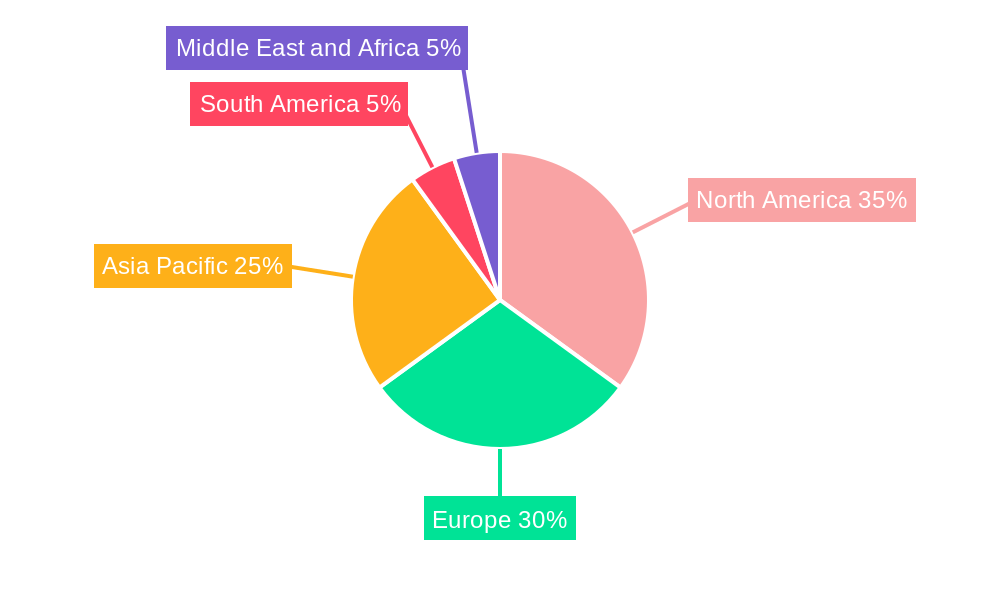
- Leading Region: North America is projected to remain a dominant market, driven by high consumption of processed foods and the presence of major food and beverage manufacturers. This is also facilitated by well-established distribution channels and robust infrastructure.
- Leading Country: The United States is anticipated to hold the largest market share due to factors such as high per capita consumption of processed foods and developed food processing industries.
- Dominant Segments:
- By Type: Citric acid is the leading segment due to its wide applicability, cost-effectiveness, and widespread availability. Lactic acid is also gaining traction, driven by its perceived health benefits and use in dairy and meat products.
- By Application: The beverages segment is projected to maintain its dominant position, followed closely by the dairy and frozen products segments, due to the extensive use of food acidulants in preserving, flavoring, and enhancing product quality.
Several factors contribute to the dominance of these markets and segments, including favorable economic policies encouraging food processing industries, well-developed infrastructure, and a high degree of consumer awareness. Conversely, emerging economies in Asia-Pacific show significant growth potential but may face challenges linked to infrastructure development and regulatory frameworks.
Food Acidulants Market Product Developments
Recent product innovations focus on the development of natural, organic, and sustainably sourced food acidulants to meet growing consumer demand for cleaner label products. This includes the introduction of acidulants derived from renewable resources and the use of advanced extraction techniques. Companies are also focusing on developing acidulants with improved functionalities, such as enhanced solubility and controlled release properties to optimize their performance in different food applications. This innovation addresses market needs for improved food quality, taste, and shelf life, and offers a substantial competitive advantage in a market highly sensitive to consumer preferences for natural and sustainable alternatives.
Report Scope & Segmentation Analysis
The report comprehensively analyzes the global Food Acidulants market segmented by:
By Type: Citric Acid (Market size xx Million, growth projection xx%), Lactic Acid (Market size xx Million, growth projection xx%), Acetic Acid (Market size xx Million, growth projection xx%), Phosphoric Acid (Market size xx Million, growth projection xx%), Malic Acid (Market size xx Million, growth projection xx%), Other Types (Market size xx Million, growth projection xx%). Each segment's analysis includes market size, growth projections, and competitive dynamics.
By Application: Beverages (Market size xx Million, growth projection xx%), Dairy and Frozen Products (Market size xx Million, growth projection xx%), Bakery (Market size xx Million, growth projection xx%), Meat Industry (Market size xx Million, growth projection xx%), Confectionery (Market size xx Million, growth projection xx%), Other Applications (Market size xx Million, growth projection xx%). Each segment’s analysis includes market size, growth projections, and competitive dynamics.
Key Drivers of Food Acidulants Market Growth
Several factors fuel the growth of the Food Acidulants market. Increasing demand for processed and convenience foods drives consumption. The growing food and beverage industry globally fuels acidulant demand. Consumer preference for longer shelf-life products necessitates the use of preservatives like acidulants. Furthermore, technological advancements in production processes result in improved efficiency and cost reduction. Finally, stringent food safety regulations worldwide enforce the use of approved acidulants, ensuring consistent quality and safety.
Challenges in the Food Acidulants Market Sector
The Food Acidulants market faces challenges such as fluctuating raw material prices that can impact profitability. Stringent regulatory requirements and certifications for food additives add complexity and increase costs. Intense competition among established and emerging players can pressure pricing and margins. Furthermore, supply chain disruptions can lead to production delays and shortages. These factors represent ongoing obstacles to sustained and predictable market growth.
Emerging Opportunities in Food Acidulants Market
Emerging opportunities include expanding into new markets, particularly in developing economies with growing food and beverage industries. The increasing demand for natural and organic acidulants provides avenues for innovation. Development of specialized acidulants tailored for specific food applications offers another avenue of growth. Finally, exploring sustainable production methods and reducing environmental impacts provide opportunities to meet growing consumer demands for environmentally responsible products.
Leading Players in the Food Acidulants Market Market
- Brenntag North America Inc
- Jungbunzlauer Suisse AG
- Purac biochem BV
- Archer Daniels Midland Company
- Tate & Lyle PLC
- Hawkins Watts Limited
- Fuerst Day Lawson Limited
- Cargill Inc
- Corbion NV
- Bartek Ingredients Inc *List Not Exhaustive
Key Developments in Food Acidulants Market Industry
- January 2023: Company X launched a new line of organic citric acid.
- March 2022: Company Y acquired Company Z, expanding its product portfolio.
- June 2021: New regulations on food additives were implemented in the EU. (Further developments need to be added here)
Strategic Outlook for Food Acidulants Market Market
The Food Acidulants market presents a strong outlook for continued growth, driven by factors like expanding food and beverage industries globally, the increasing demand for convenience foods, and the sustained need for food preservation. Opportunities lie in innovation focused on natural, sustainable, and functional acidulants tailored to meet evolving consumer demands. The market’s future trajectory hinges on successfully navigating regulatory changes, managing supply chain challenges, and fostering innovation to cater to increasingly health-conscious consumers.
Food Acidulants Market Segmentation
-
1. Type
- 1.1. Citric Acid
- 1.2. Lactic Acid
- 1.3. Acetic Acid
- 1.4. Phosphoric Acid
- 1.5. Malic Acid
- 1.6. Other Types
-
2. Application
- 2.1. Beverages
- 2.2. Dairy and Frozen Products
- 2.3. Bakery
- 2.4. Meat Industry
- 2.5. Confectionery
- 2.6. Other Applications
Food Acidulants Market Segmentation By Geography
-
1. North America
- 1.1. United States
- 1.2. Canada
- 1.3. Mexico
- 1.4. Rest of North America
-
2. Europe
- 2.1. Spain
- 2.2. United Kingdom
- 2.3. Germany
- 2.4. France
- 2.5. Italy
- 2.6. Russia
- 2.7. Rest of Europe
-
3. Asia Pacific
- 3.1. China
- 3.2. Japan
- 3.3. India
- 3.4. Australia
- 3.5. Rest of Asia Pacific
-
4. South America
- 4.1. Brazil
- 4.2. Argentina
- 4.3. Rest of South America
-
5. Middle East and Africa
- 5.1. South Africa
- 5.2. United Arab Emirates
- 5.3. Rest of Middle East and Africa
Food Acidulants Market REPORT HIGHLIGHTS
| Aspects | Details |
|---|---|
| Study Period | 2019-2033 |
| Base Year | 2024 |
| Estimated Year | 2025 |
| Forecast Period | 2025-2033 |
| Historical Period | 2019-2024 |
| Growth Rate | CAGR of 7.40% from 2019-2033 |
| Segmentation |
|
Table of Contents
- 1. Introduction
- 1.1. Research Scope
- 1.2. Market Segmentation
- 1.3. Research Methodology
- 1.4. Definitions and Assumptions
- 2. Executive Summary
- 2.1. Introduction
- 3. Market Dynamics
- 3.1. Introduction
- 3.2. Market Drivers
- 3.2.1. Increasing demand for processed and convenience foods is driving the food acidulants market
- 3.3. Market Restrains
- 3.3.1. Increasing prevalence of hydroglycemia
- 3.4. Market Trends
- 3.4.1. Use of Citric Acid in Processed Food and Beverage
- 4. Market Factor Analysis
- 4.1. Porters Five Forces
- 4.2. Supply/Value Chain
- 4.3. PESTEL analysis
- 4.4. Market Entropy
- 4.5. Patent/Trademark Analysis
- 5. Global Food Acidulants Market Analysis, Insights and Forecast, 2019-2031
- 5.1. Market Analysis, Insights and Forecast - by Type
- 5.1.1. Citric Acid
- 5.1.2. Lactic Acid
- 5.1.3. Acetic Acid
- 5.1.4. Phosphoric Acid
- 5.1.5. Malic Acid
- 5.1.6. Other Types
- 5.2. Market Analysis, Insights and Forecast - by Application
- 5.2.1. Beverages
- 5.2.2. Dairy and Frozen Products
- 5.2.3. Bakery
- 5.2.4. Meat Industry
- 5.2.5. Confectionery
- 5.2.6. Other Applications
- 5.3. Market Analysis, Insights and Forecast - by Region
- 5.3.1. North America
- 5.3.2. Europe
- 5.3.3. Asia Pacific
- 5.3.4. South America
- 5.3.5. Middle East and Africa
- 5.1. Market Analysis, Insights and Forecast - by Type
- 6. North America Food Acidulants Market Analysis, Insights and Forecast, 2019-2031
- 6.1. Market Analysis, Insights and Forecast - by Type
- 6.1.1. Citric Acid
- 6.1.2. Lactic Acid
- 6.1.3. Acetic Acid
- 6.1.4. Phosphoric Acid
- 6.1.5. Malic Acid
- 6.1.6. Other Types
- 6.2. Market Analysis, Insights and Forecast - by Application
- 6.2.1. Beverages
- 6.2.2. Dairy and Frozen Products
- 6.2.3. Bakery
- 6.2.4. Meat Industry
- 6.2.5. Confectionery
- 6.2.6. Other Applications
- 6.1. Market Analysis, Insights and Forecast - by Type
- 7. Europe Food Acidulants Market Analysis, Insights and Forecast, 2019-2031
- 7.1. Market Analysis, Insights and Forecast - by Type
- 7.1.1. Citric Acid
- 7.1.2. Lactic Acid
- 7.1.3. Acetic Acid
- 7.1.4. Phosphoric Acid
- 7.1.5. Malic Acid
- 7.1.6. Other Types
- 7.2. Market Analysis, Insights and Forecast - by Application
- 7.2.1. Beverages
- 7.2.2. Dairy and Frozen Products
- 7.2.3. Bakery
- 7.2.4. Meat Industry
- 7.2.5. Confectionery
- 7.2.6. Other Applications
- 7.1. Market Analysis, Insights and Forecast - by Type
- 8. Asia Pacific Food Acidulants Market Analysis, Insights and Forecast, 2019-2031
- 8.1. Market Analysis, Insights and Forecast - by Type
- 8.1.1. Citric Acid
- 8.1.2. Lactic Acid
- 8.1.3. Acetic Acid
- 8.1.4. Phosphoric Acid
- 8.1.5. Malic Acid
- 8.1.6. Other Types
- 8.2. Market Analysis, Insights and Forecast - by Application
- 8.2.1. Beverages
- 8.2.2. Dairy and Frozen Products
- 8.2.3. Bakery
- 8.2.4. Meat Industry
- 8.2.5. Confectionery
- 8.2.6. Other Applications
- 8.1. Market Analysis, Insights and Forecast - by Type
- 9. South America Food Acidulants Market Analysis, Insights and Forecast, 2019-2031
- 9.1. Market Analysis, Insights and Forecast - by Type
- 9.1.1. Citric Acid
- 9.1.2. Lactic Acid
- 9.1.3. Acetic Acid
- 9.1.4. Phosphoric Acid
- 9.1.5. Malic Acid
- 9.1.6. Other Types
- 9.2. Market Analysis, Insights and Forecast - by Application
- 9.2.1. Beverages
- 9.2.2. Dairy and Frozen Products
- 9.2.3. Bakery
- 9.2.4. Meat Industry
- 9.2.5. Confectionery
- 9.2.6. Other Applications
- 9.1. Market Analysis, Insights and Forecast - by Type
- 10. Middle East and Africa Food Acidulants Market Analysis, Insights and Forecast, 2019-2031
- 10.1. Market Analysis, Insights and Forecast - by Type
- 10.1.1. Citric Acid
- 10.1.2. Lactic Acid
- 10.1.3. Acetic Acid
- 10.1.4. Phosphoric Acid
- 10.1.5. Malic Acid
- 10.1.6. Other Types
- 10.2. Market Analysis, Insights and Forecast - by Application
- 10.2.1. Beverages
- 10.2.2. Dairy and Frozen Products
- 10.2.3. Bakery
- 10.2.4. Meat Industry
- 10.2.5. Confectionery
- 10.2.6. Other Applications
- 10.1. Market Analysis, Insights and Forecast - by Type
- 11. North America Food Acidulants Market Analysis, Insights and Forecast, 2019-2031
- 11.1. Market Analysis, Insights and Forecast - By Country/Sub-region
- 11.1.1 United States
- 11.1.2 Canada
- 11.1.3 Mexico
- 11.1.4 Rest of North America
- 12. Europe Food Acidulants Market Analysis, Insights and Forecast, 2019-2031
- 12.1. Market Analysis, Insights and Forecast - By Country/Sub-region
- 12.1.1 Spain
- 12.1.2 United Kingdom
- 12.1.3 Germany
- 12.1.4 France
- 12.1.5 Italy
- 12.1.6 Russia
- 12.1.7 Rest of Europe
- 13. Asia Pacific Food Acidulants Market Analysis, Insights and Forecast, 2019-2031
- 13.1. Market Analysis, Insights and Forecast - By Country/Sub-region
- 13.1.1 China
- 13.1.2 Japan
- 13.1.3 India
- 13.1.4 Australia
- 13.1.5 Rest of Asia Pacific
- 14. South America Food Acidulants Market Analysis, Insights and Forecast, 2019-2031
- 14.1. Market Analysis, Insights and Forecast - By Country/Sub-region
- 14.1.1 Brazil
- 14.1.2 Argentina
- 14.1.3 Rest of South America
- 15. Middle East and Africa Food Acidulants Market Analysis, Insights and Forecast, 2019-2031
- 15.1. Market Analysis, Insights and Forecast - By Country/Sub-region
- 15.1.1 South Africa
- 15.1.2 United Arab Emirates
- 15.1.3 Rest of Middle East and Africa
- 16. Competitive Analysis
- 16.1. Global Market Share Analysis 2024
- 16.2. Company Profiles
- 16.2.1 Brenntag North America Inc
- 16.2.1.1. Overview
- 16.2.1.2. Products
- 16.2.1.3. SWOT Analysis
- 16.2.1.4. Recent Developments
- 16.2.1.5. Financials (Based on Availability)
- 16.2.2 Jungbunzlauer Suisse AG
- 16.2.2.1. Overview
- 16.2.2.2. Products
- 16.2.2.3. SWOT Analysis
- 16.2.2.4. Recent Developments
- 16.2.2.5. Financials (Based on Availability)
- 16.2.3 Purac biochem BV
- 16.2.3.1. Overview
- 16.2.3.2. Products
- 16.2.3.3. SWOT Analysis
- 16.2.3.4. Recent Developments
- 16.2.3.5. Financials (Based on Availability)
- 16.2.4 Archer Daniels Midland Company
- 16.2.4.1. Overview
- 16.2.4.2. Products
- 16.2.4.3. SWOT Analysis
- 16.2.4.4. Recent Developments
- 16.2.4.5. Financials (Based on Availability)
- 16.2.5 Tate & Lyle PLC
- 16.2.5.1. Overview
- 16.2.5.2. Products
- 16.2.5.3. SWOT Analysis
- 16.2.5.4. Recent Developments
- 16.2.5.5. Financials (Based on Availability)
- 16.2.6 Hawkins Watts Limited
- 16.2.6.1. Overview
- 16.2.6.2. Products
- 16.2.6.3. SWOT Analysis
- 16.2.6.4. Recent Developments
- 16.2.6.5. Financials (Based on Availability)
- 16.2.7 Fuerst Day Lawson Limited
- 16.2.7.1. Overview
- 16.2.7.2. Products
- 16.2.7.3. SWOT Analysis
- 16.2.7.4. Recent Developments
- 16.2.7.5. Financials (Based on Availability)
- 16.2.8 Cargill Inc
- 16.2.8.1. Overview
- 16.2.8.2. Products
- 16.2.8.3. SWOT Analysis
- 16.2.8.4. Recent Developments
- 16.2.8.5. Financials (Based on Availability)
- 16.2.9 Corbion NV
- 16.2.9.1. Overview
- 16.2.9.2. Products
- 16.2.9.3. SWOT Analysis
- 16.2.9.4. Recent Developments
- 16.2.9.5. Financials (Based on Availability)
- 16.2.10 Bartek Ingredients Inc *List Not Exhaustive
- 16.2.10.1. Overview
- 16.2.10.2. Products
- 16.2.10.3. SWOT Analysis
- 16.2.10.4. Recent Developments
- 16.2.10.5. Financials (Based on Availability)
- 16.2.1 Brenntag North America Inc
List of Figures
- Figure 1: Global Food Acidulants Market Revenue Breakdown (Million, %) by Region 2024 & 2032
- Figure 2: Global Food Acidulants Market Volume Breakdown (K Tons, %) by Region 2024 & 2032
- Figure 3: North America Food Acidulants Market Revenue (Million), by Country 2024 & 2032
- Figure 4: North America Food Acidulants Market Volume (K Tons), by Country 2024 & 2032
- Figure 5: North America Food Acidulants Market Revenue Share (%), by Country 2024 & 2032
- Figure 6: North America Food Acidulants Market Volume Share (%), by Country 2024 & 2032
- Figure 7: Europe Food Acidulants Market Revenue (Million), by Country 2024 & 2032
- Figure 8: Europe Food Acidulants Market Volume (K Tons), by Country 2024 & 2032
- Figure 9: Europe Food Acidulants Market Revenue Share (%), by Country 2024 & 2032
- Figure 10: Europe Food Acidulants Market Volume Share (%), by Country 2024 & 2032
- Figure 11: Asia Pacific Food Acidulants Market Revenue (Million), by Country 2024 & 2032
- Figure 12: Asia Pacific Food Acidulants Market Volume (K Tons), by Country 2024 & 2032
- Figure 13: Asia Pacific Food Acidulants Market Revenue Share (%), by Country 2024 & 2032
- Figure 14: Asia Pacific Food Acidulants Market Volume Share (%), by Country 2024 & 2032
- Figure 15: South America Food Acidulants Market Revenue (Million), by Country 2024 & 2032
- Figure 16: South America Food Acidulants Market Volume (K Tons), by Country 2024 & 2032
- Figure 17: South America Food Acidulants Market Revenue Share (%), by Country 2024 & 2032
- Figure 18: South America Food Acidulants Market Volume Share (%), by Country 2024 & 2032
- Figure 19: Middle East and Africa Food Acidulants Market Revenue (Million), by Country 2024 & 2032
- Figure 20: Middle East and Africa Food Acidulants Market Volume (K Tons), by Country 2024 & 2032
- Figure 21: Middle East and Africa Food Acidulants Market Revenue Share (%), by Country 2024 & 2032
- Figure 22: Middle East and Africa Food Acidulants Market Volume Share (%), by Country 2024 & 2032
- Figure 23: North America Food Acidulants Market Revenue (Million), by Type 2024 & 2032
- Figure 24: North America Food Acidulants Market Volume (K Tons), by Type 2024 & 2032
- Figure 25: North America Food Acidulants Market Revenue Share (%), by Type 2024 & 2032
- Figure 26: North America Food Acidulants Market Volume Share (%), by Type 2024 & 2032
- Figure 27: North America Food Acidulants Market Revenue (Million), by Application 2024 & 2032
- Figure 28: North America Food Acidulants Market Volume (K Tons), by Application 2024 & 2032
- Figure 29: North America Food Acidulants Market Revenue Share (%), by Application 2024 & 2032
- Figure 30: North America Food Acidulants Market Volume Share (%), by Application 2024 & 2032
- Figure 31: North America Food Acidulants Market Revenue (Million), by Country 2024 & 2032
- Figure 32: North America Food Acidulants Market Volume (K Tons), by Country 2024 & 2032
- Figure 33: North America Food Acidulants Market Revenue Share (%), by Country 2024 & 2032
- Figure 34: North America Food Acidulants Market Volume Share (%), by Country 2024 & 2032
- Figure 35: Europe Food Acidulants Market Revenue (Million), by Type 2024 & 2032
- Figure 36: Europe Food Acidulants Market Volume (K Tons), by Type 2024 & 2032
- Figure 37: Europe Food Acidulants Market Revenue Share (%), by Type 2024 & 2032
- Figure 38: Europe Food Acidulants Market Volume Share (%), by Type 2024 & 2032
- Figure 39: Europe Food Acidulants Market Revenue (Million), by Application 2024 & 2032
- Figure 40: Europe Food Acidulants Market Volume (K Tons), by Application 2024 & 2032
- Figure 41: Europe Food Acidulants Market Revenue Share (%), by Application 2024 & 2032
- Figure 42: Europe Food Acidulants Market Volume Share (%), by Application 2024 & 2032
- Figure 43: Europe Food Acidulants Market Revenue (Million), by Country 2024 & 2032
- Figure 44: Europe Food Acidulants Market Volume (K Tons), by Country 2024 & 2032
- Figure 45: Europe Food Acidulants Market Revenue Share (%), by Country 2024 & 2032
- Figure 46: Europe Food Acidulants Market Volume Share (%), by Country 2024 & 2032
- Figure 47: Asia Pacific Food Acidulants Market Revenue (Million), by Type 2024 & 2032
- Figure 48: Asia Pacific Food Acidulants Market Volume (K Tons), by Type 2024 & 2032
- Figure 49: Asia Pacific Food Acidulants Market Revenue Share (%), by Type 2024 & 2032
- Figure 50: Asia Pacific Food Acidulants Market Volume Share (%), by Type 2024 & 2032
- Figure 51: Asia Pacific Food Acidulants Market Revenue (Million), by Application 2024 & 2032
- Figure 52: Asia Pacific Food Acidulants Market Volume (K Tons), by Application 2024 & 2032
- Figure 53: Asia Pacific Food Acidulants Market Revenue Share (%), by Application 2024 & 2032
- Figure 54: Asia Pacific Food Acidulants Market Volume Share (%), by Application 2024 & 2032
- Figure 55: Asia Pacific Food Acidulants Market Revenue (Million), by Country 2024 & 2032
- Figure 56: Asia Pacific Food Acidulants Market Volume (K Tons), by Country 2024 & 2032
- Figure 57: Asia Pacific Food Acidulants Market Revenue Share (%), by Country 2024 & 2032
- Figure 58: Asia Pacific Food Acidulants Market Volume Share (%), by Country 2024 & 2032
- Figure 59: South America Food Acidulants Market Revenue (Million), by Type 2024 & 2032
- Figure 60: South America Food Acidulants Market Volume (K Tons), by Type 2024 & 2032
- Figure 61: South America Food Acidulants Market Revenue Share (%), by Type 2024 & 2032
- Figure 62: South America Food Acidulants Market Volume Share (%), by Type 2024 & 2032
- Figure 63: South America Food Acidulants Market Revenue (Million), by Application 2024 & 2032
- Figure 64: South America Food Acidulants Market Volume (K Tons), by Application 2024 & 2032
- Figure 65: South America Food Acidulants Market Revenue Share (%), by Application 2024 & 2032
- Figure 66: South America Food Acidulants Market Volume Share (%), by Application 2024 & 2032
- Figure 67: South America Food Acidulants Market Revenue (Million), by Country 2024 & 2032
- Figure 68: South America Food Acidulants Market Volume (K Tons), by Country 2024 & 2032
- Figure 69: South America Food Acidulants Market Revenue Share (%), by Country 2024 & 2032
- Figure 70: South America Food Acidulants Market Volume Share (%), by Country 2024 & 2032
- Figure 71: Middle East and Africa Food Acidulants Market Revenue (Million), by Type 2024 & 2032
- Figure 72: Middle East and Africa Food Acidulants Market Volume (K Tons), by Type 2024 & 2032
- Figure 73: Middle East and Africa Food Acidulants Market Revenue Share (%), by Type 2024 & 2032
- Figure 74: Middle East and Africa Food Acidulants Market Volume Share (%), by Type 2024 & 2032
- Figure 75: Middle East and Africa Food Acidulants Market Revenue (Million), by Application 2024 & 2032
- Figure 76: Middle East and Africa Food Acidulants Market Volume (K Tons), by Application 2024 & 2032
- Figure 77: Middle East and Africa Food Acidulants Market Revenue Share (%), by Application 2024 & 2032
- Figure 78: Middle East and Africa Food Acidulants Market Volume Share (%), by Application 2024 & 2032
- Figure 79: Middle East and Africa Food Acidulants Market Revenue (Million), by Country 2024 & 2032
- Figure 80: Middle East and Africa Food Acidulants Market Volume (K Tons), by Country 2024 & 2032
- Figure 81: Middle East and Africa Food Acidulants Market Revenue Share (%), by Country 2024 & 2032
- Figure 82: Middle East and Africa Food Acidulants Market Volume Share (%), by Country 2024 & 2032
List of Tables
- Table 1: Global Food Acidulants Market Revenue Million Forecast, by Region 2019 & 2032
- Table 2: Global Food Acidulants Market Volume K Tons Forecast, by Region 2019 & 2032
- Table 3: Global Food Acidulants Market Revenue Million Forecast, by Type 2019 & 2032
- Table 4: Global Food Acidulants Market Volume K Tons Forecast, by Type 2019 & 2032
- Table 5: Global Food Acidulants Market Revenue Million Forecast, by Application 2019 & 2032
- Table 6: Global Food Acidulants Market Volume K Tons Forecast, by Application 2019 & 2032
- Table 7: Global Food Acidulants Market Revenue Million Forecast, by Region 2019 & 2032
- Table 8: Global Food Acidulants Market Volume K Tons Forecast, by Region 2019 & 2032
- Table 9: Global Food Acidulants Market Revenue Million Forecast, by Country 2019 & 2032
- Table 10: Global Food Acidulants Market Volume K Tons Forecast, by Country 2019 & 2032
- Table 11: United States Food Acidulants Market Revenue (Million) Forecast, by Application 2019 & 2032
- Table 12: United States Food Acidulants Market Volume (K Tons) Forecast, by Application 2019 & 2032
- Table 13: Canada Food Acidulants Market Revenue (Million) Forecast, by Application 2019 & 2032
- Table 14: Canada Food Acidulants Market Volume (K Tons) Forecast, by Application 2019 & 2032
- Table 15: Mexico Food Acidulants Market Revenue (Million) Forecast, by Application 2019 & 2032
- Table 16: Mexico Food Acidulants Market Volume (K Tons) Forecast, by Application 2019 & 2032
- Table 17: Rest of North America Food Acidulants Market Revenue (Million) Forecast, by Application 2019 & 2032
- Table 18: Rest of North America Food Acidulants Market Volume (K Tons) Forecast, by Application 2019 & 2032
- Table 19: Global Food Acidulants Market Revenue Million Forecast, by Country 2019 & 2032
- Table 20: Global Food Acidulants Market Volume K Tons Forecast, by Country 2019 & 2032
- Table 21: Spain Food Acidulants Market Revenue (Million) Forecast, by Application 2019 & 2032
- Table 22: Spain Food Acidulants Market Volume (K Tons) Forecast, by Application 2019 & 2032
- Table 23: United Kingdom Food Acidulants Market Revenue (Million) Forecast, by Application 2019 & 2032
- Table 24: United Kingdom Food Acidulants Market Volume (K Tons) Forecast, by Application 2019 & 2032
- Table 25: Germany Food Acidulants Market Revenue (Million) Forecast, by Application 2019 & 2032
- Table 26: Germany Food Acidulants Market Volume (K Tons) Forecast, by Application 2019 & 2032
- Table 27: France Food Acidulants Market Revenue (Million) Forecast, by Application 2019 & 2032
- Table 28: France Food Acidulants Market Volume (K Tons) Forecast, by Application 2019 & 2032
- Table 29: Italy Food Acidulants Market Revenue (Million) Forecast, by Application 2019 & 2032
- Table 30: Italy Food Acidulants Market Volume (K Tons) Forecast, by Application 2019 & 2032
- Table 31: Russia Food Acidulants Market Revenue (Million) Forecast, by Application 2019 & 2032
- Table 32: Russia Food Acidulants Market Volume (K Tons) Forecast, by Application 2019 & 2032
- Table 33: Rest of Europe Food Acidulants Market Revenue (Million) Forecast, by Application 2019 & 2032
- Table 34: Rest of Europe Food Acidulants Market Volume (K Tons) Forecast, by Application 2019 & 2032
- Table 35: Global Food Acidulants Market Revenue Million Forecast, by Country 2019 & 2032
- Table 36: Global Food Acidulants Market Volume K Tons Forecast, by Country 2019 & 2032
- Table 37: China Food Acidulants Market Revenue (Million) Forecast, by Application 2019 & 2032
- Table 38: China Food Acidulants Market Volume (K Tons) Forecast, by Application 2019 & 2032
- Table 39: Japan Food Acidulants Market Revenue (Million) Forecast, by Application 2019 & 2032
- Table 40: Japan Food Acidulants Market Volume (K Tons) Forecast, by Application 2019 & 2032
- Table 41: India Food Acidulants Market Revenue (Million) Forecast, by Application 2019 & 2032
- Table 42: India Food Acidulants Market Volume (K Tons) Forecast, by Application 2019 & 2032
- Table 43: Australia Food Acidulants Market Revenue (Million) Forecast, by Application 2019 & 2032
- Table 44: Australia Food Acidulants Market Volume (K Tons) Forecast, by Application 2019 & 2032
- Table 45: Rest of Asia Pacific Food Acidulants Market Revenue (Million) Forecast, by Application 2019 & 2032
- Table 46: Rest of Asia Pacific Food Acidulants Market Volume (K Tons) Forecast, by Application 2019 & 2032
- Table 47: Global Food Acidulants Market Revenue Million Forecast, by Country 2019 & 2032
- Table 48: Global Food Acidulants Market Volume K Tons Forecast, by Country 2019 & 2032
- Table 49: Brazil Food Acidulants Market Revenue (Million) Forecast, by Application 2019 & 2032
- Table 50: Brazil Food Acidulants Market Volume (K Tons) Forecast, by Application 2019 & 2032
- Table 51: Argentina Food Acidulants Market Revenue (Million) Forecast, by Application 2019 & 2032
- Table 52: Argentina Food Acidulants Market Volume (K Tons) Forecast, by Application 2019 & 2032
- Table 53: Rest of South America Food Acidulants Market Revenue (Million) Forecast, by Application 2019 & 2032
- Table 54: Rest of South America Food Acidulants Market Volume (K Tons) Forecast, by Application 2019 & 2032
- Table 55: Global Food Acidulants Market Revenue Million Forecast, by Country 2019 & 2032
- Table 56: Global Food Acidulants Market Volume K Tons Forecast, by Country 2019 & 2032
- Table 57: South Africa Food Acidulants Market Revenue (Million) Forecast, by Application 2019 & 2032
- Table 58: South Africa Food Acidulants Market Volume (K Tons) Forecast, by Application 2019 & 2032
- Table 59: United Arab Emirates Food Acidulants Market Revenue (Million) Forecast, by Application 2019 & 2032
- Table 60: United Arab Emirates Food Acidulants Market Volume (K Tons) Forecast, by Application 2019 & 2032
- Table 61: Rest of Middle East and Africa Food Acidulants Market Revenue (Million) Forecast, by Application 2019 & 2032
- Table 62: Rest of Middle East and Africa Food Acidulants Market Volume (K Tons) Forecast, by Application 2019 & 2032
- Table 63: Global Food Acidulants Market Revenue Million Forecast, by Type 2019 & 2032
- Table 64: Global Food Acidulants Market Volume K Tons Forecast, by Type 2019 & 2032
- Table 65: Global Food Acidulants Market Revenue Million Forecast, by Application 2019 & 2032
- Table 66: Global Food Acidulants Market Volume K Tons Forecast, by Application 2019 & 2032
- Table 67: Global Food Acidulants Market Revenue Million Forecast, by Country 2019 & 2032
- Table 68: Global Food Acidulants Market Volume K Tons Forecast, by Country 2019 & 2032
- Table 69: United States Food Acidulants Market Revenue (Million) Forecast, by Application 2019 & 2032
- Table 70: United States Food Acidulants Market Volume (K Tons) Forecast, by Application 2019 & 2032
- Table 71: Canada Food Acidulants Market Revenue (Million) Forecast, by Application 2019 & 2032
- Table 72: Canada Food Acidulants Market Volume (K Tons) Forecast, by Application 2019 & 2032
- Table 73: Mexico Food Acidulants Market Revenue (Million) Forecast, by Application 2019 & 2032
- Table 74: Mexico Food Acidulants Market Volume (K Tons) Forecast, by Application 2019 & 2032
- Table 75: Rest of North America Food Acidulants Market Revenue (Million) Forecast, by Application 2019 & 2032
- Table 76: Rest of North America Food Acidulants Market Volume (K Tons) Forecast, by Application 2019 & 2032
- Table 77: Global Food Acidulants Market Revenue Million Forecast, by Type 2019 & 2032
- Table 78: Global Food Acidulants Market Volume K Tons Forecast, by Type 2019 & 2032
- Table 79: Global Food Acidulants Market Revenue Million Forecast, by Application 2019 & 2032
- Table 80: Global Food Acidulants Market Volume K Tons Forecast, by Application 2019 & 2032
- Table 81: Global Food Acidulants Market Revenue Million Forecast, by Country 2019 & 2032
- Table 82: Global Food Acidulants Market Volume K Tons Forecast, by Country 2019 & 2032
- Table 83: Spain Food Acidulants Market Revenue (Million) Forecast, by Application 2019 & 2032
- Table 84: Spain Food Acidulants Market Volume (K Tons) Forecast, by Application 2019 & 2032
- Table 85: United Kingdom Food Acidulants Market Revenue (Million) Forecast, by Application 2019 & 2032
- Table 86: United Kingdom Food Acidulants Market Volume (K Tons) Forecast, by Application 2019 & 2032
- Table 87: Germany Food Acidulants Market Revenue (Million) Forecast, by Application 2019 & 2032
- Table 88: Germany Food Acidulants Market Volume (K Tons) Forecast, by Application 2019 & 2032
- Table 89: France Food Acidulants Market Revenue (Million) Forecast, by Application 2019 & 2032
- Table 90: France Food Acidulants Market Volume (K Tons) Forecast, by Application 2019 & 2032
- Table 91: Italy Food Acidulants Market Revenue (Million) Forecast, by Application 2019 & 2032
- Table 92: Italy Food Acidulants Market Volume (K Tons) Forecast, by Application 2019 & 2032
- Table 93: Russia Food Acidulants Market Revenue (Million) Forecast, by Application 2019 & 2032
- Table 94: Russia Food Acidulants Market Volume (K Tons) Forecast, by Application 2019 & 2032
- Table 95: Rest of Europe Food Acidulants Market Revenue (Million) Forecast, by Application 2019 & 2032
- Table 96: Rest of Europe Food Acidulants Market Volume (K Tons) Forecast, by Application 2019 & 2032
- Table 97: Global Food Acidulants Market Revenue Million Forecast, by Type 2019 & 2032
- Table 98: Global Food Acidulants Market Volume K Tons Forecast, by Type 2019 & 2032
- Table 99: Global Food Acidulants Market Revenue Million Forecast, by Application 2019 & 2032
- Table 100: Global Food Acidulants Market Volume K Tons Forecast, by Application 2019 & 2032
- Table 101: Global Food Acidulants Market Revenue Million Forecast, by Country 2019 & 2032
- Table 102: Global Food Acidulants Market Volume K Tons Forecast, by Country 2019 & 2032
- Table 103: China Food Acidulants Market Revenue (Million) Forecast, by Application 2019 & 2032
- Table 104: China Food Acidulants Market Volume (K Tons) Forecast, by Application 2019 & 2032
- Table 105: Japan Food Acidulants Market Revenue (Million) Forecast, by Application 2019 & 2032
- Table 106: Japan Food Acidulants Market Volume (K Tons) Forecast, by Application 2019 & 2032
- Table 107: India Food Acidulants Market Revenue (Million) Forecast, by Application 2019 & 2032
- Table 108: India Food Acidulants Market Volume (K Tons) Forecast, by Application 2019 & 2032
- Table 109: Australia Food Acidulants Market Revenue (Million) Forecast, by Application 2019 & 2032
- Table 110: Australia Food Acidulants Market Volume (K Tons) Forecast, by Application 2019 & 2032
- Table 111: Rest of Asia Pacific Food Acidulants Market Revenue (Million) Forecast, by Application 2019 & 2032
- Table 112: Rest of Asia Pacific Food Acidulants Market Volume (K Tons) Forecast, by Application 2019 & 2032
- Table 113: Global Food Acidulants Market Revenue Million Forecast, by Type 2019 & 2032
- Table 114: Global Food Acidulants Market Volume K Tons Forecast, by Type 2019 & 2032
- Table 115: Global Food Acidulants Market Revenue Million Forecast, by Application 2019 & 2032
- Table 116: Global Food Acidulants Market Volume K Tons Forecast, by Application 2019 & 2032
- Table 117: Global Food Acidulants Market Revenue Million Forecast, by Country 2019 & 2032
- Table 118: Global Food Acidulants Market Volume K Tons Forecast, by Country 2019 & 2032
- Table 119: Brazil Food Acidulants Market Revenue (Million) Forecast, by Application 2019 & 2032
- Table 120: Brazil Food Acidulants Market Volume (K Tons) Forecast, by Application 2019 & 2032
- Table 121: Argentina Food Acidulants Market Revenue (Million) Forecast, by Application 2019 & 2032
- Table 122: Argentina Food Acidulants Market Volume (K Tons) Forecast, by Application 2019 & 2032
- Table 123: Rest of South America Food Acidulants Market Revenue (Million) Forecast, by Application 2019 & 2032
- Table 124: Rest of South America Food Acidulants Market Volume (K Tons) Forecast, by Application 2019 & 2032
- Table 125: Global Food Acidulants Market Revenue Million Forecast, by Type 2019 & 2032
- Table 126: Global Food Acidulants Market Volume K Tons Forecast, by Type 2019 & 2032
- Table 127: Global Food Acidulants Market Revenue Million Forecast, by Application 2019 & 2032
- Table 128: Global Food Acidulants Market Volume K Tons Forecast, by Application 2019 & 2032
- Table 129: Global Food Acidulants Market Revenue Million Forecast, by Country 2019 & 2032
- Table 130: Global Food Acidulants Market Volume K Tons Forecast, by Country 2019 & 2032
- Table 131: South Africa Food Acidulants Market Revenue (Million) Forecast, by Application 2019 & 2032
- Table 132: South Africa Food Acidulants Market Volume (K Tons) Forecast, by Application 2019 & 2032
- Table 133: United Arab Emirates Food Acidulants Market Revenue (Million) Forecast, by Application 2019 & 2032
- Table 134: United Arab Emirates Food Acidulants Market Volume (K Tons) Forecast, by Application 2019 & 2032
- Table 135: Rest of Middle East and Africa Food Acidulants Market Revenue (Million) Forecast, by Application 2019 & 2032
- Table 136: Rest of Middle East and Africa Food Acidulants Market Volume (K Tons) Forecast, by Application 2019 & 2032
Frequently Asked Questions
1. What is the projected Compound Annual Growth Rate (CAGR) of the Food Acidulants Market?
The projected CAGR is approximately 7.40%.
2. Which companies are prominent players in the Food Acidulants Market?
Key companies in the market include Brenntag North America Inc, Jungbunzlauer Suisse AG, Purac biochem BV, Archer Daniels Midland Company, Tate & Lyle PLC, Hawkins Watts Limited, Fuerst Day Lawson Limited, Cargill Inc, Corbion NV, Bartek Ingredients Inc *List Not Exhaustive.
3. What are the main segments of the Food Acidulants Market?
The market segments include Type, Application.
4. Can you provide details about the market size?
The market size is estimated to be USD XX Million as of 2022.
5. What are some drivers contributing to market growth?
Increasing demand for processed and convenience foods is driving the food acidulants market.
6. What are the notable trends driving market growth?
Use of Citric Acid in Processed Food and Beverage.
7. Are there any restraints impacting market growth?
Increasing prevalence of hydroglycemia.
8. Can you provide examples of recent developments in the market?
N/A
9. What pricing options are available for accessing the report?
Pricing options include single-user, multi-user, and enterprise licenses priced at USD 4750, USD 5250, and USD 8750 respectively.
10. Is the market size provided in terms of value or volume?
The market size is provided in terms of value, measured in Million and volume, measured in K Tons.
11. Are there any specific market keywords associated with the report?
Yes, the market keyword associated with the report is "Food Acidulants Market," which aids in identifying and referencing the specific market segment covered.
12. How do I determine which pricing option suits my needs best?
The pricing options vary based on user requirements and access needs. Individual users may opt for single-user licenses, while businesses requiring broader access may choose multi-user or enterprise licenses for cost-effective access to the report.
13. Are there any additional resources or data provided in the Food Acidulants Market report?
While the report offers comprehensive insights, it's advisable to review the specific contents or supplementary materials provided to ascertain if additional resources or data are available.
14. How can I stay updated on further developments or reports in the Food Acidulants Market?
To stay informed about further developments, trends, and reports in the Food Acidulants Market, consider subscribing to industry newsletters, following relevant companies and organizations, or regularly checking reputable industry news sources and publications.
Methodology
Step 1 - Identification of Relevant Samples Size from Population Database


Step 2 - Approaches for Defining Global Market Size (Value, Volume* & Price*)

Note*: In applicable scenarios
Step 3 - Data Sources
Primary Research
- Web Analytics
- Survey Reports
- Research Institute
- Latest Research Reports
- Opinion Leaders
Secondary Research
- Annual Reports
- White Paper
- Latest Press Release
- Industry Association
- Paid Database
- Investor Presentations

Step 4 - Data Triangulation
Involves using different sources of information in order to increase the validity of a study
These sources are likely to be stakeholders in a program - participants, other researchers, program staff, other community members, and so on.
Then we put all data in single framework & apply various statistical tools to find out the dynamic on the market.
During the analysis stage, feedback from the stakeholder groups would be compared to determine areas of agreement as well as areas of divergence


